EURNZD Analysis , Support Bounce and Bullish PotentialEURNZD is currently trading at 1.83300, with a target price of 1.89000. This suggests a potential upward movement of 500+ pips. The price is bouncing off a strong support level, indicating a possible bullish reversal. The support and resistance pattern highlights key price zones where buying and selling pressure increase. A successful bounce from support strengthens the bullish outlook. Traders anticipate the price moving towards the next resistance level at 1.89000. Confirmation through candlestick patterns and volume analysis is essential. Risk management should include a stop-loss below the support level. Fundamental factors like interest rate decisions can impact price action. Monitoring market sentiment and economic news is crucial for trade execution.
NZDEUR trade ideas

ABOUT EURNZDMy option about Is more bearish so that zone is good and strong restanice if the price comes to that zone it can pullback

EUR-NZD Potential Long! Buy!
Hello,Traders!
EUR-NZD keeps falling
But a strong horizontal
Support level is ahead
At 1.8249 from where
We will be expecting a
Local bullish correction
Buy!
Comment and subscribe to help us grow!
Check out other forecasts below too!

EURNZD - SELL ( Double Top )Well We Can See A Scenario Of A Sell Side In EURNZD. Lets See What Happens, Price Action Is Really Following Good....

EURNZD: Long Trade with Entry/SL/TP
EURNZD
- Classic bullish formation
- Our team expects growth
SUGGESTED TRADE:
Swing Trade
Buy EURNZD
Entry Level - 1.8319
Sl - 1.8280
Tp - 1.8391
Our Risk - 1%
Start protection of your profits from lower levels
❤️ Please, support our work with like & comment! ❤️

EUR/NZD Triangle Breakout (5.2.2025)The EUR/NZD Pair on the M30 timeframe presents a Potential Selling Opportunity due to a recent Formation of a Triangle Breakout Pattern. This suggests a shift in momentum towards the downside in the coming hours.
Possible Short Trade:
Entry: Consider Entering A Short Position around Trendline Of The Pattern.
Target Levels:
1st Support – 1.8220
2nd Support – 1.8140
🎁 Please hit the like button and
🎁 Leave a comment to support for My Post !
Your likes and comments are incredibly motivating and will encourage me to share more analysis with you.
Best Regards, KABHI_TA_TRADING
Thank you.

NZDUSDAs of February 4, 2025, the labor market data for New Zealand is anticipated to reveal significant trends that could influence economic policy and market sentiment. Here’s what to expect based on the latest figures and forecasts:
Key Data Points
Employment Change (q/q):
Forecast: -0.2%
Previous: -0.5%
The slight improvement in the forecast suggests a potential stabilization in employment levels, though still negative, indicating that the labor market is under pressure but may be starting to recover.
Unemployment Rate:
Forecast: 5.1%
Previous: 4.8%
This forecast indicates a rise in unemployment, reflecting ongoing economic challenges. Predictions suggest that the unemployment rate could peak at around 5.5% during 2025 as the economy continues to adjust post-recession13.
Labor Cost Index (q/q):
Forecast: 0.6%
Previous: 0.6%
The stability in labor costs suggests that while employment conditions are tough, wage pressures are not currently escalating.
Economic Context
Rising Unemployment: The increase to 5.1% signifies that job seekers face a challenging environment, with many economists predicting a further rise in unemployment due to ongoing economic adjustments following a recession134.
Job Market Dynamics: Reports indicate that while there is a rebound in job advertisements, overall hiring remains subdued, with many candidates competing for fewer positions4. The labor market is still catching up to previous economic conditions, and recovery is expected to be slow as lower interest rates begin to stimulate household spending and business activity34.
Future Outlook: Economists expect the labor market to remain tight in the first half of 2025, with a gradual recovery anticipated as economic indicators improve over time23. However, this recovery may not be uniform across all sectors.
Conclusion
The upcoming labor market data is crucial for understanding the current state of New Zealand's economy. While there are signs of stabilization in employment change, the rising unemployment rate reflects ongoing challenges. Stakeholders will closely monitor these figures as they may influence monetary policy decisions by the Reserve Bank of New Zealand.

EUR/NZD:Complex Correction Unfolding – Wave 2 Nearing CompletionEUR/NZD has been trapped in a sideways range since July 2024, forming what appears to be a complex correction for wave 2. If this Elliott Wave count is accurate, the current resistance zone could hold, allowing bears to step in and drive prices lower to complete the second wave.
Watch for reversal signals like engulfing candles or strong rejections before entering short positions! 📉🔥
#ElliottWave #ForexTrading #EURNZD #TechnicalAnalysis

EURNZD REVERSALTechnically:
EURNZD printing double top
EURNZD printing bearish divergence
EURNZD break it last higher low
Fundamentally:
COT shows EXY is bearish
COT data shows ZXY is bullish
EURNZD Set To Grow! BUY!
My dear subscribers,
My technical analysis for EURNZD is below:
The price is coiling around a solid key level - 1.8379
Bias - Bullish
Technical Indicators: Pivot Points Low anticipates a potential price reversal.
Super trend shows a clear buy, giving a perfect indicators' convergence.
Goal - 1.8416
About Used Indicators:
By the very nature of the supertrend indicator, it offers firm support and resistance levels for traders to enter and exit trades. Additionally, it also provides signals for setting stop losses
———————————
WISH YOU ALL LUCK

ABOUT EURNZDMy option about eurnzd Is more bullish so that zone is good and strong support,if the price comes to that zone you buy


EURNZD Trading IdeaBased on Simple Technical Analysis ( Trendline + Support & Resistance )
Risk Disclaimer:
Please be advised that I am not telling anyone how to spend or invest their money. Take all of my analysis as my own opinion, as entertainment, and at your own risk. I assume no responsibility or liability for any errors or omissions in the content of this page, and they are for educational purposes only. Any action you take on the information in this analysis is strictly at your own risk. There is a very high degree of risk involved in trading. Past results are not indicative of future returns. Good luck :-)

Descending Channel on EUR/NZD @ D1A descending channel pattern formed on the daily chart of the EUR/NZD currency pair following a month-long uptrend. The pattern's borders are marked with the yellow lines. The potential entry level is at the cyan line. The potential take-profit level is at the green line. The stop-loss can be set to the low of the candle preceding the breakout candle. It's not shown on the chart. I will ignore bearish breakouts from this descending channel formation.

EURNZD Set To Fall! SELL!
My dear subscribers,
My technical analysis for EURNZD is below:
The price is coiling around a solid key level - 1.8438
Bias - Bearish
Technical Indicators: Pivot Points High anticipates a potential price reversal.
Super trend shows a clear sell, giving a perfect indicators' convergence.
Goal - 1.8386
About Used Indicators:
By the very nature of the supertrend indicator, it offers firm support and resistance levels for traders to enter and exit trades. Additionally, it also provides signals for setting stop losses
———————————
WISH YOU ALL LUCK

EURNZD EASY SNIPER ENTRY.The analysis is very easy .. we have an area to retest and execute sells on the perfect time. Enjoy

EURNZD Short Term Buy IdeaH4 - Bullish trend pattern followed by a pullback
Until the two strong support zones hold my short term view remains bullish here.

15R EURNZDExpecting a continuation of the trend here.
Had a nice larger consolidation pattern on the higher time frame (it’s over to the left, not directly visible here).
The visible pattern here is a 4H pattern and I see it as a reaccumulation pattern above support.
The target is a 1:1 measured leg of the weekly trend.
Very high probability trade - 60% chance of success.

eurnzd sell signal. Don't forget about stop-loss.
Write in the comments all your questions and instruments analysis of which you want to see.
Friends, push the like button, write a comment, and share with your mates - that would be the best THANK YOU.
P.S. I personally will open entry if the price will show it according to my strategy.
Always make your analysis before a trade

Is the EURNZD on a long-term rise?
Hi Dears
It seems like we are in a bullish move for the EURNZD pair.
We are in a channel or wedge pattern that is now in the middle of the channel and it looks like we should see the EUR rise against the New Zealand Dollar.
This is a long-term analysis. If you like my analysis, please support me by liking and commenting and introducing my page to your other friends.

EURNZD is ready to push againNo comment needed. All information is in the chart analysis.
Steps to follow:
Analyze yourself.
Take the position with SL and Take Profits.
Wait, it may take a couple of days, so take a break and step away from the screen from time to time, just like I do :)
Get the result.
I will update the trade every day.
Like, comment with your good mood or viewpoint, share with your circle. It’s together that we get stronger!
Good trades, Traders!
The golden bear

EURNZD?
This week.
We seen weekly high broken.
Will we see a continuation to upside ?
Will be looking for edge in the lower timeframe. 1H
InsideBar etc
My Stoploss = 1.83900
All the best

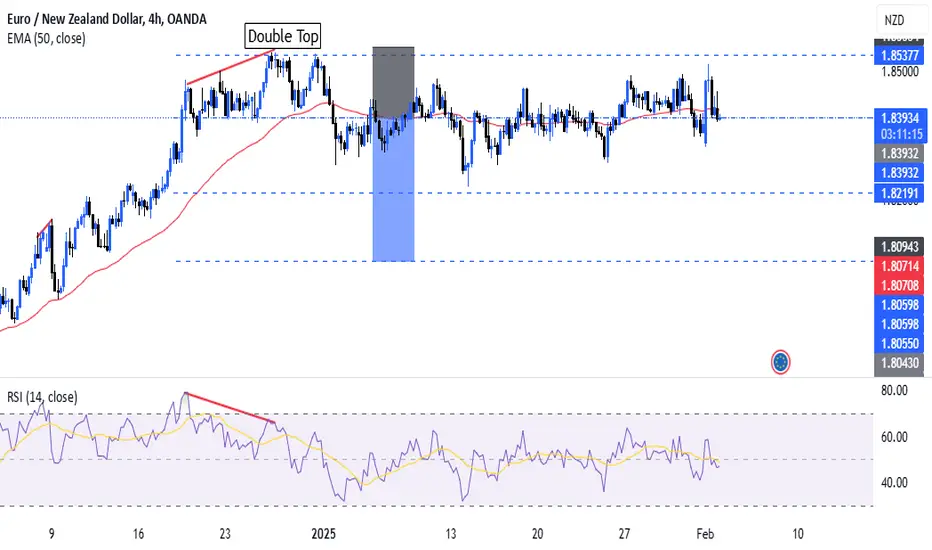
EURNZD PRINTING REVERSAL Technically:
EURNZD printing double top.
EURNZD printing bearish divergence.
EURNZD currently moving side ways after break its last lower high
