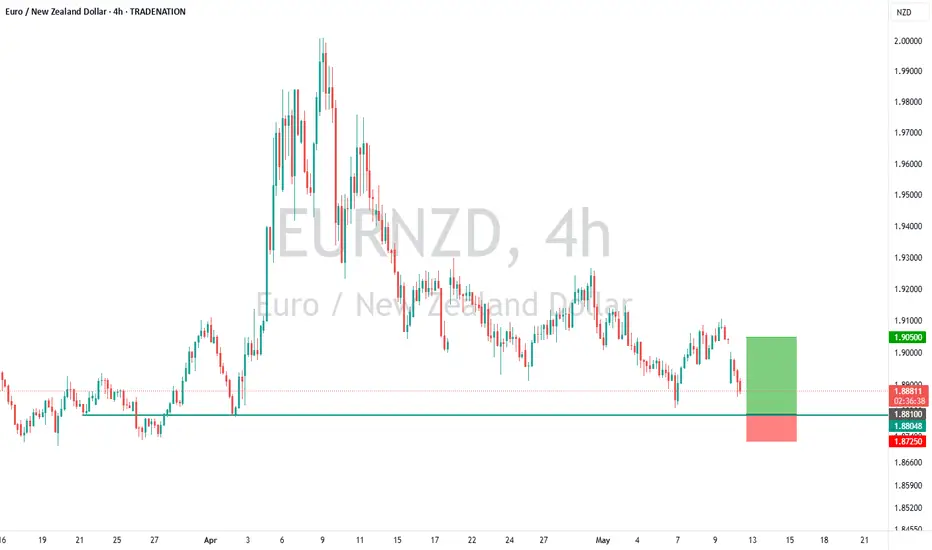
EUR-NZD Support Ahead! Buy!
Hello,Traders!
EUR-NZD keeps falling
But the pair will soon
Retest a horizontal support
Level of 1.8732 so after
The pair makes the retest
We will be expecting a
Local bullish rebound
Buy!
Comment and subscribe to help us grow!
Check out other forecasts below too!
Disclosure: I am part of Trade Nation's Influencer program and receive a monthly fee for using their TradingView charts in my analysis.
NZDEUR trade ideas

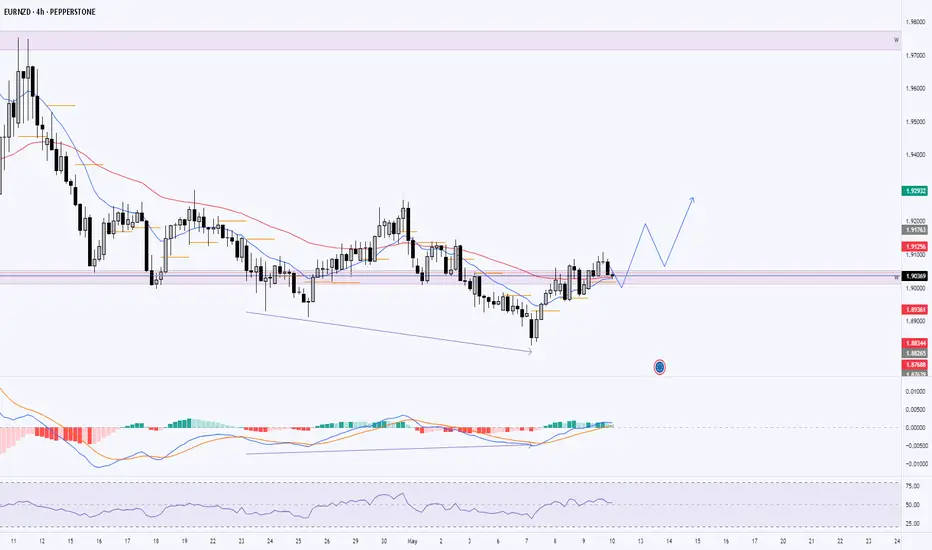
EUR/NZD Forex Heist: Thief Trading Style Strikes! Greetings, Profit Hunters & Market Raiders! 🤑💰✈️
Prepare to plunder the EUR/NZD Forex Market with our slick Thief Trading Style, fusing razor-sharp technicals with savvy fundamental insights! 📊🔥 Our mission? Dive in for a bearish score, targeting the high-risk Green MA Zone where oversold conditions, consolidation, or a bullish reversal could trap the unwary. Let’s grab the loot and slip away like pros! 🏆💸
📈 The Forex Heist Blueprint
Entry Point 🚪:
🏴☠️ Bearish Strike: The vault’s open—pounce on the bearish move at any price! For precision, place Sell Limit Orders at the nearest 15M/30M swing high/low for pullback entries.
Tip: Set a chart alert to snag the perfect entry! 🔔
Stop Loss (SL) 🛑:
Place your Thief SL at the nearest 5H swing high (1.91000) for swing trades.
Adjust SL based on your risk, lot size, and number of orders. This is your escape hatch—use it wisely! ⚠️
Take Profit (TP) 🎯:
Aim for 1.85000 or exit early for safety if the Green MA Zone shows reversal signs.
Escape Plan: Watch for bullish strength or consolidation to avoid getting caught! 🚨
📡 Why EUR/NZD?
The EUR/NZD market is in a bearish trend 🐻, fueled by:
Fundamentals: Eurozone economic struggles vs. NZD resilience.
Macroeconomics: Weak Eurozone data contrasts with NZ’s export strength.
COT Data: Speculative bets lean bearish on EUR.
Intermarket: NZD gains from commodity correlations; EUR lags on energy costs.
Quantitative: Technicals (RSI, MA crossovers) signal bearish momentum.
🧠 Sentiment Outlook
Retail Traders:
🟢 Bullish: 38% 😊 (Eyeing EUR rebound on oversold signals)
🔴 Bearish: 50% 😟 (NZD strength and Eurozone woes dominate)
⚪ Neutral: 12% 🤔
Institutional Traders:
🟢 Bullish: 25% 💼 (Hedging for EUR recovery)
🔴 Bearish: 65% ⚠️ (NZD favored on trade and yield flows)
⚪ Neutral: 10% 🧐
⚠️ Trading Alert: News & Risk Management 📰
News can flip the market like a switch! Protect your haul:
Avoid new trades during high-impact news releases.
Use trailing stop-loss to secure profits and limit losses.
Stay alert—volatility is our ally, but only with a plan!
💪 Join the Thief Trading Squad!
Tap the Boost Button to supercharge our Thief Trading Style and make this heist legendary! 🚀 Every boost strengthens our crew, letting us raid profits daily with ease. Let’s dominate the EUR/NZD market together! 🤝
Stay locked in for the next heist! 🐱👤 Keep your charts primed, alerts set, and trading spirit wild. See you in the profits, raiders! 🤑🎉
#ThiefTrading #EURNZD #ForexHeist #TradingView #GrabThePips

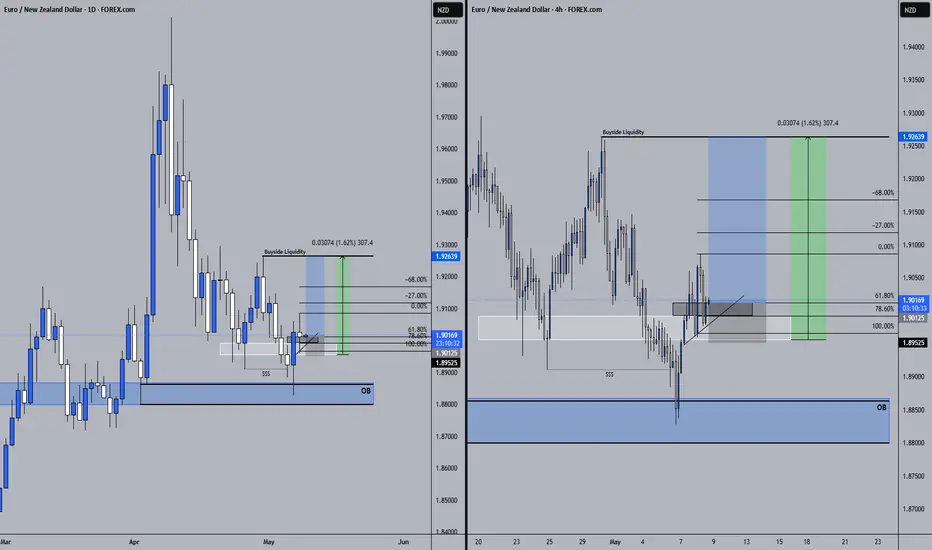
EURNZD Short Term Buy Trade Update!!!Hi Traders, on May 8th I shared this idea "EURNZD - Expecting Bullish Continuation In The Short Term"
I expected retraces and bullish continuation higher from the marked Fibonacci support zones. You can read the full post using the link above.
Price reached the first Fibonacci support zone, respected it and bounced higher as expected!!!
If you enjoy this idea, don’t forget to LIKE 👍, FOLLOW ✅, SHARE 🙌, and COMMENT ✍! Drop your thoughts and charts below to keep the discussion going. Your support helps keep this content free and reach more people! 🚀
-------------------------------------------------------------------------------------------------------------------
Disclosure: I am part of Trade Nation's Influencer program and receive a monthly fee for using their TradingView charts in my analysis.

EURNZD 12/05/2025Weekly:
-Weekly low could be rejected again.
-Bullish M pattern.
Daily:
-Bullish M pattern.
-OB.
-M formation.
-Daily lows.
4H:
-Inverse H&S pattern.

EURNZD Bearish Reversal Confirmed: Break and Retest Below Key Su🧠 Market Context & Structure:
Trend Analysis: The pair is currently in a bearish structure. This is evident from lower highs and lower lows forming after a failed bullish breakout attempt.
Key Zone: A supply zone (highlighted in red) around 1.90198 – 1.90750 has acted as a strong resistance. Price was rejected here after retesting.
Break of Structure (BoS): A clear bearish breakout below the ascending trendline and the horizontal support confirms a shift in sentiment.
📉 Indicators & Confluences:
EMA Analysis:
EMA 50 (red): 1.90757
EMA 200 (blue): 1.90728
Price is trading below both EMAs, which confirms bearish momentum. Also, a bearish EMA crossover (50 crossing below 200) may be forming or has just occurred — a death cross, which further supports downside bias.
🎯 Trade Setup Breakdown (Bearish Bias):
Entry: Around 1.89760 (current price)
Stop Loss: Above the supply zone (~1.9020 - 1.9070)
Take Profit Target: Around 1.86035 (highlighted in green), aligning with previous demand zone or measured move.
Risk-to-Reward Ratio (RRR): Estimated at ~3:1, making this a favorable setup.
🔽 Technical Patterns:
Bear Flag / Rising Wedge: The broken ascending pattern suggests a bearish continuation.
Retest Confirmation: Price retested the broken structure before continuing down — classic bearish retest behavior.
✅ Conclusion:
This is a textbook bearish setup supported by:
A failed breakout and structure shift
Resistance at a key supply zone
Break and retest of support
Price under both EMAs (bearish confirmation)
📌 Bias: Bearish
📌 Invalidation Level: Close above 1.9075
📌 Next Support Zone: 1.8600–1.8550 range

eurnzd buy signal. Don't forget about stop-loss.
Write in the comments all your questions and instruments analysis of which you want to see.
Friends, push the like button, write a comment, and share with your mates - that would be the best THANK YOU.
P.S. I personally will open entry if the price will show it according to my strategy.
Always make your analysis before a trade

EURNZD Under Pressure! SELL!
My dear subscribers,
EURNZD looks like it will make a good move, and here are the details:
The market is trading on 1.9051 pivot level.
Bias - Bearish
Technical Indicators: Both Super Trend & Pivot HL indicate a highly probable Bearish continuation.
Target - 1.8984
About Used Indicators:
The average true range (ATR) plays an important role in 'Supertrend' as the indicator uses ATR to calculate its value. The ATR indicator signals the degree of price volatility.
Disclosure: I am part of Trade Nation's Influencer program and receive a monthly fee for using their TradingView charts in my analysis.
———————————
WISH YOU ALL LUCK

EURNZD I Technical Analysis & Forecast Welcome back! Let me know your thoughts in the comments!
** EURNZD Analysis - Listen to video!
We recommend that you keep this pair on your watchlist and enter when the entry criteria of your strategy is met.
Please support this idea with a LIKE and COMMENT if you find it useful and Click "Follow" on our profile if you'd like these trade ideas delivered straight to your email in the future.
Thanks for your continued support!Welcome back! Let me know your thoughts in the comments!

EURNZD: Bullish Continuation is Highly Probable! Here is Why:
It is essential that we apply multitimeframe technical analysis and there is no better example of why that is the case than the current EURNZD chart which, if analyzed properly, clearly points in the upward direction.
Disclosure: I am part of Trade Nation's Influencer program and receive a monthly fee for using their TradingView charts in my analysis.
❤️ Please, support our work with like & comment! ❤️

Trade Idea: EURNZD – Buy on Dip Toward Trend Line SupportExpires: 13/05/2025 06:00
Trade Idea
Type: Buy Limit
Entry: 1.8810
Stop Loss: 1.8725
Target: 1.9050
Duration: Intraday
Technical Overview
The primary trend for EURNZD remains bullish, with recent price action showing a controlled pullback.
Price is approaching a well-defined ascending trendline, offering strong support near 1.8800.
Buying on dips into this zone offers a favorable risk/reward opportunity.
Disclosure: I am part of Trade Nation's Influencer program and receive a monthly fee for using their TradingView charts in my analysis.
EURNZD..LONGOANDA:EURNZD
Analysis complete — scenarios outlined. The zone could be a decision point for . Price reaction here may define the next move.
If price breaks and pulls back to retest, a reversal setup might emerge.

EURNZD Buy – Retest at Weekly Breakout Zone📅 Date: 11/05/2025🕒 Timeframe: 4H / 1H
🔍 Market Bias:
Trend direction: Uptrend
Key structure: Higher highs and higher lows in 4h.
Fundamental/Bias if any: No major news scheduled; technical setup driven
📊 Technical Analysis:
Key Support/Resistance zones:
1.90116 - 1.90515 – Weekly Resistance turned Support
1.90265 – Minor 4h Resistance
Indicators used:
EMA50: Price is holding above both on Daily and 4H, indicating bullish momentum
MACD: Showing early signs of bullish divergence on Daily timeframe
Chart patterns / Price Action:
Retest of broken weekly resistance with rejection wick
4H market structure shift + price breaking above EMA50 – early sign of trend continuation
🟢 Entry Criteria:
Trendline Break and retest of minor resistance near 1.9016 on 1H
Candle close above 1H EMA50 and trendline break confirmation
Bullish engulfing or momentum candle off support area
⚠️ Risk Management:
Risk per trade: 1% of account
Trade invalidation if: Price closes below 1.89698 on 4H with bearish momentum
EurnzdAfter the first buy we are expecting a retracment back to the support zone den I will buy again to the top

EURNZD - The Bull of the Week!Hello TradingView Family / Fellow Traders. This is Richard, also known as theSignalyst.
📈EURNZD has been overall bearish trading within the falling channel marked in red.
However, it is retesting the lower bound of the channel acting as an over-sold area.
Moreover, the blue zone is a strong demand!
🏹 Thus, the highlighted blue circle is a strong area to look for buy setups as it is the intersection of demand and lower red trendline acting as a non-horizontal support.
📚 As per my trading style:
As #EURNZD approaches the blue circle zone, I will be looking for bullish reversal setups (like a double bottom pattern, trendline break , and so on...)
📚 Always follow your trading plan regarding entry, risk management, and trade management.
Good luck!
All Strategies Are Good; If Managed Properly!
~Rich
Disclosure: I am part of Trade Nation's Influencer program and receive a monthly fee for using their TradingView charts in my analysis.

EUR/NZD BEARS ARE GAINING STRENGTH|SHORT
Hello, Friends!
EUR/NZD pair is in the downtrend because previous week’s candle is red, while the price is obviously rising on the 9H timeframe. And after the retest of the resistance line above I believe we will see a move down towards the target below at 1.890 because the pair is overbought due to its proximity to the upper BB band and a bearish correction is likely.
Disclosure: I am part of Trade Nation's Influencer program and receive a monthly fee for using their TradingView charts in my analysis.
✅LIKE AND COMMENT MY IDEAS✅

EURNZD Sellers In Panic! BUY!
My dear friends,
EURNZD looks like it will make a good move, and here are the details:
The market is trading on 1.8991 pivot level.
Bias - Bullish
Technical Indicators: Supper Trend generates a clear long signal while Pivot Point HL is currently determining the overall Bullish trend of the market.
Goal - 1.9076
Recommended Stop Loss - 1.8942
About Used Indicators:
Pivot points are a great way to identify areas of support and resistance, but they work best when combined with other kinds of technical analysis
Disclosure: I am part of Trade Nation's Influencer program and receive a monthly fee for using their TradingView charts in my analysis.
———————————
WISH YOU ALL LUCK

Bearish Look for potential Reversal bearish candlestick Patterns formation upon the retest of 1 hour supply zone

EURNZD 08/05/2025Weekly:
-Bullish M pattern.
-Weekly low rejected.
-Liquidity sweep.
Daily:
-Inverse H&S pattern.
-OB.
4H:
-Bullish M pattern.
EURNZD SELL/SHORETBy utilizing levels, historical patterns, , we can formulate a hypothesis that the market might follow a similar trajectory if bearish sentiment prevails.

EURNZD - Expecting Bullish Continuation In The Short TermM15 - Strong bullish move.
No opposite signs.
Expecting further continuation higher until the two Fibonacci support zones hold.
If you enjoy this idea, don’t forget to LIKE 👍, FOLLOW ✅, SHARE 🙌, and COMMENT ✍! Drop your thoughts and charts below to keep the discussion going. Your support helps keep this content free and reach more people! 🚀
--------------------------------------------------------------------------------------------------------------------
Disclosure: I am part of Trade Nation's Influencer program and receive a monthly fee for using their TradingView charts in my analysis.

EURNZD Wave Analysis – 7 May 2025
- EURNZD reversed from support level 1.8845
- Likely to rise to resistance level 1.9200
EURNZD currency pair recently reversed from the support level 1.8845 intersecting with the lower daily Bollinger Band and the 61.8% Fibonacci correction of the upward impulse from February.
The upward reversal from the support level 1.8845 stopped the C-wave of the active medium-term ABC correction (4) from the start of April.
Given the clear daily uptrend, EURNZD currency pair can be expected to rise to the next resistance level 1.9200.

$EURNZD Interesting technicalsOANDA:EURNZD Another interesting euro cross technical idea this evening. Rejecting from a previous daily level with a bullish engulfing on the daily. There is a suitable intra-day level near the .382 fib.

EUR/NZD SELLERS WILL DOMINATE THE MARKET|SHORT
Hello, Friends!
EUR/NZD pair is trading in a local downtrend which know by looking at the previous 1W candle which is red. On the 2H timeframe the pair is going up. The pair is overbought because the price is close to the upper band of the BB indicator. So we are looking to sell the pair with the upper BB line acting as resistance. The next target is 1.884 area.
Disclosure: I am part of Trade Nation's Influencer program and receive a monthly fee for using their TradingView charts in my analysis.
✅LIKE AND COMMENT MY IDEAS✅
