GBPNZD: Market of Buyers
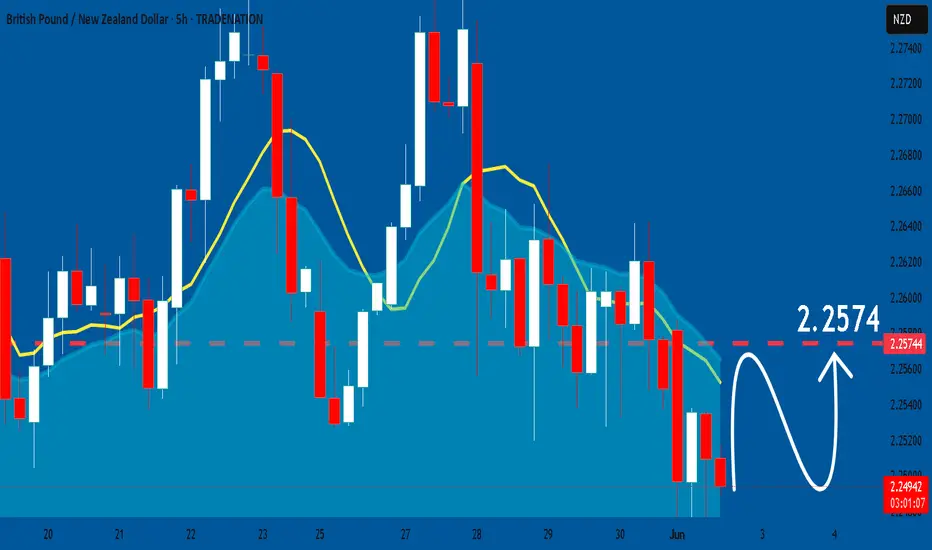
The charts are full of distraction, disturbance and are a graveyard of fear and greed which shall not cloud our judgement on the current state of affairs in the GBPNZD pair price action which suggests a high likelihood of a coming move up.
Disclosure: I am part of Trade Nation's Influencer program and receive a monthly fee for using their TradingView charts in my analysis.
❤️ Please, support our work with like & comment! ❤️
NZDGBP trade ideas
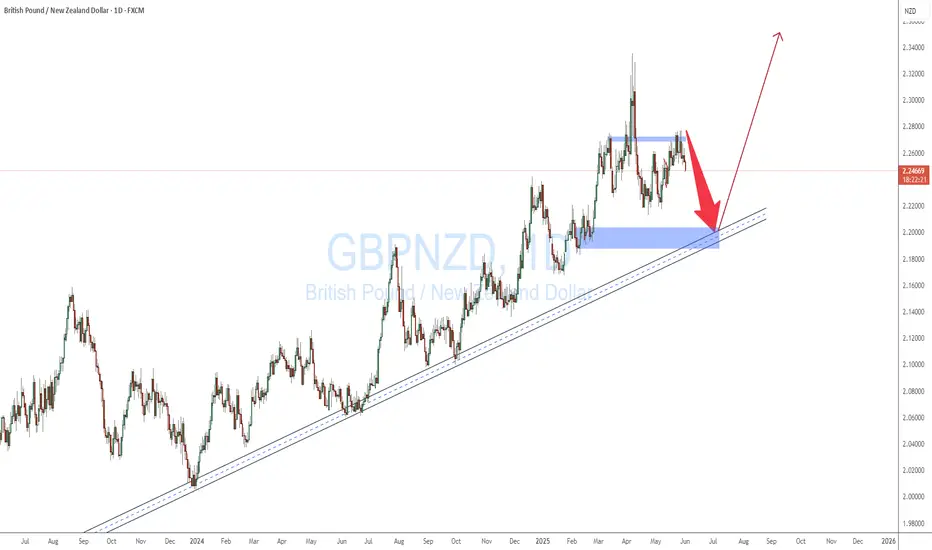
GBPNZD TANK BEFORE THE SURGEGBPNZD is expected to fall o the daily dynamic support before the surgeto break the next high.
the pair keeps tanking from a a dailt TF quasimodo LEVEL
GBPNZD Swing BuyFor this trade, I have waited for weeks. I have been impatiently waiting fro price to break below 2.25 for a while now and finally, price breaks below 2.25 on a crucial week. I want to see price go to the moon now I am watching this double bottom on D chart.

GBPNZD Pushing itself in a buy directionHello Traders
In This Chart GBPNZD 4 HOURLY Forex Forecast By FOREX PLANET
today GBPNZD analysis 👆
🟢This Chart includes GBPNZD market update)
🟢What is The Next Opportunity on EURNZD Market
🟢how to Enter to the Valid Entry With Assurance Profit
This CHART is For Trader's that Want to Improve Their Technical Analysis Skills and Their Trading By Understanding How To Analyze The Market Using Multiple Timeframes and Understanding The Bigger Picture on the Charts

GBP-NZD Local Long! Buy!
Hello,Traders!
GBP-NZD will soon hit a
Horizontal support level
Of 2.0518 and as we have
Seem multiple rebounds
From the level we can
Bet on a one more rebound
And go long from the level
On Monday
Buy!
Comment and subscribe to help us grow!
Check out other forecasts below too!
Disclosure: I am part of Trade Nation's Influencer program and receive a monthly fee for using their TradingView charts in my analysis.

GBP/NZD SHORT FROM RESISTANCE
Hello, Friends!
The BB upper band is nearby so GBP-NZD is in the overbought territory. Thus, despite the uptrend on the 1W timeframe I think that we will see a bearish reaction from the resistance line above and a move down towards the target at around 2.218.
Disclosure: I am part of Trade Nation's Influencer program and receive a monthly fee for using their TradingView charts in my analysis.
✅LIKE AND COMMENT MY IDEAS✅

GBP_AUD RIKSY LONG|
✅GBP_AUD is going down to retest
A horizontal support of 2.2504
And we are locally bullish biased
So I think that we will see a rebound
And a move up from the level
Towards the target above at 2.2571
LONG🚀
✅Like and subscribe to never miss a new idea!✅
Disclosure: I am part of Trade Nation's Influencer program and receive a monthly fee for using their TradingView charts in my analysis.

GBP/NZD For Bullishyou can go long now
or
wait for pull-back near by entry point and then go long
general trend is up trend
have fun :)
GBPNZD Set To Fall! SELL!
My dear followers,
This is my opinion on the GBPNZD next move:
The asset is approaching an important pivot point 2.2732
Bias - Bearish
Safe Stop Loss - 2.2905
Technical Indicators: Supper Trend generates a clear short signal while Pivot Point HL is currently determining the overall Bearish trend of the market.
Goal - 2.2594
About Used Indicators:
For more efficient signals, super-trend is used in combination with other indicators like Pivot Points.
Disclosure: I am part of Trade Nation's Influencer program and receive a monthly fee for using their TradingView charts in my analysis.
———————————
WISH YOU ALL LUCK

GBPNZD Sell Revisiting this pair again but with more value and a bit closer to a significant structure level.
The level we have marked has shown some strenght and has been respected as resistance for a while now and so after some heavy bearish price action candle formation, I have spotted this as an entry candle.
My entry candle is the bearish rejecton candle before by position tool was added.
I have gone for a 1:3 risk to reward to manage my risk.
Best of luck on the charts !!!

GBPNZD – Bullish Bias Still IntactWe’ve seen a slightly deeper pullback with resistance forming around 2.26228. While price remains bullish overall, this week could present either a breakout or deeper retracement setup:
🔁 High risk/reward buys: from 2.25282 if structure holds
🟢 Safe continuation buys: break above 2.26228 or 2.27286
🛡️ Safest breakout buys: clear break of 2.28114
We’ll reassess at the previous high levels of 2.29000+ once we get confirmation.

GBPNZD STARTED FORMING DOWNTREND IN DAILY TIMEFRAMEGBPNZD started forming Bearish trend.
Lower low has confirmed downtrend in the market.
Price is currently trading in a secondary trend.
A primary trend is expected to form soon.
Market is expected to remain bearish for upcoming trading sessions.
On higher side, market may test the resistance levels of 2.33528.
On bearish side, market is expected to hit the level of 2.18880.

GBP_NZD RISKY LONG|
✅GBP_NZD is going down now
But a strong support level is ahead at 2.2520
Thus I am expecting a rebound
And a move up towards the target of 2.2609
LONG🚀
✅Like and subscribe to never miss a new idea!✅
Disclosure: I am part of Trade Nation's Influencer program and receive a monthly fee for using their TradingView charts in my analysis.

GBPNZD Pushing itself in a buy directionHello Traders
In This Chart GBPNZD 4 HOURLY Forex Forecast By FOREX PLANET
today GBPNZD analysis 👆
🟢This Chart includes GBPNZD market update)
🟢What is The Next Opportunity on EURNZD Market
🟢how to Enter to the Valid Entry With Assurance Profit
This CHART is For Trader's that Want to Improve Their Technical Analysis Skills and Their Trading By Understanding How To Analyze The Market Using Multiple Timeframes and Understanding The Bigger Picture on the Charts

GBPNZD Is Very Bullish! Long!
Here is our detailed technical review for GBPNZD.
Time Frame: 1D
Current Trend: Bullish
Sentiment: Oversold (based on 7-period RSI)
Forecast: Bullish
The market is trading around a solid horizontal structure 2.262.
The above observations make me that the market will inevitably achieve 2.298 level.
P.S
The term oversold refers to a condition where an asset has traded lower in price and has the potential for a price bounce.
Overbought refers to market scenarios where the instrument is traded considerably higher than its fair value. Overvaluation is caused by market sentiments when there is positive news.
Disclosure: I am part of Trade Nation's Influencer program and receive a monthly fee for using their TradingView charts in my analysis.
Like and subscribe and comment my ideas if you enjoy them!

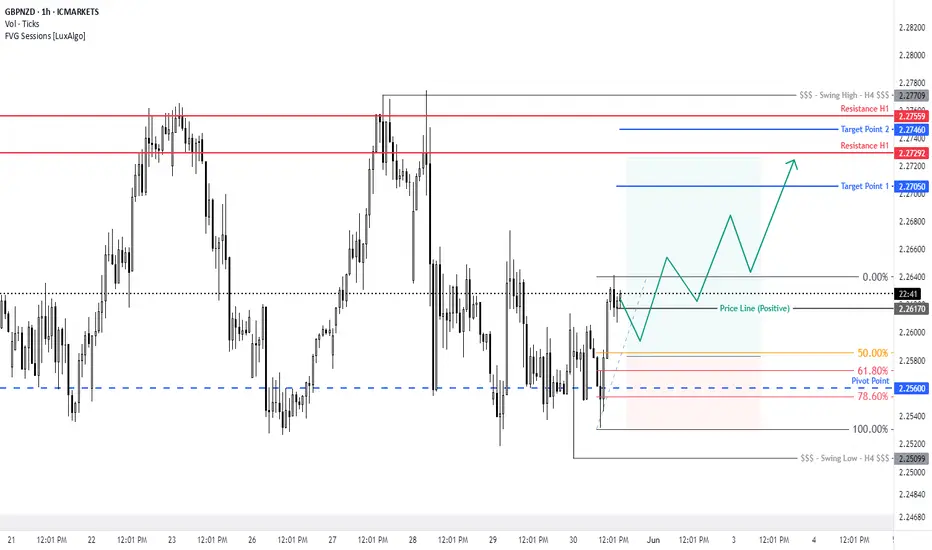
Pair: GBPNZD Bias: Bullish (contingent on breakout or support hoPrice has repeatedly rejected resistance at 2.27286 and is now consolidating between this key level and 2.25282. With this week being month-end, it’s likely we could see a pullback before a larger move into June.
Trade Zones:
Buy from 2.25282 if we pull back and hold as support
Buy above 2.28114 if we get the breakout
Targets:
First: 2.29580
Extended: 2.31200
Invalidation:
Break and close below 2.25282 with bearish follow-through
Notes:
Wait for price action confirmations.
Be mindful of low volume and false moves during month-end flow.


GBPNZD Sell Setup- Go for sell only when entry setup given
- Refine entry with smaller SL for better RR, if you know how
- keep looking for sell even if price goes one more up
A Message To Traders:
I’ll be sharing high-quality trade setups for a period time. No bullshit, no fluff, no complicated nonsense — just real, actionable forecast the algorithm is executing. If you’re struggling with trading and desperate for better results, follow my posts closely.
Check out my previously posted setups and forecasts — you’ll be amazed by the high accuracy of the results.

GBPNZD: Price came back to strong bullish reversal point!GBPNZD reversed from a point we previously pointed out in our analysis. The price moved nicely, but it didn’t continue the bullish trend as we had initially expected. Since the price has decided to retest the bullish zone one more time, we thought it would be a great zone to swing buy GBPNZD. You can set two take-profit targets based on your own analysis and bias.
This analysis is purely for educational and secondary bias purposes only and does not guarantee that the price will move as described in the chart.
We really appreciate your unwavering support! ❤️🚀
If you’d like to lend a hand, here are a few ways you can contribute:
- Give our ideas a like
- Share your thoughts in the comments
- Spread the word about our ideas
Cheers,
Team Setupsfx_

GBPNZD 4H Long📘 Educational Caption for Your Trading Chat
🟩 GBPNZD 4H Long Setup (Smart Money Strategy)
I'm in a long position on GBPNZD from the 2.26169 zone after observing a Break of Structure (BOS) followed by a clean retest of the refined demand area.
📈 Entry: 2.26169
🎯 Target: 2.29401
🛡️ Stop Loss: 2.24902
⚖️ Risk-Reward: ~1:2.8 — solid return with minimal downside
This trade aligns with Smart Money Concepts (SMC) — price broke structure, retraced into a demand zone, and formed a bullish continuation pattern. Liquidity has been swept, and the market shows signs of institutional accumulation.
🔔 Note: Let the setup play out. Targets may take time to reach. Stick to your plan and trust the process.
⚠️ Disclaimer: This trade is shared for educational purposes only. Always do your own analysis and manage risk responsibly. This is not financial advice.

GBPNZD Trading Opportunity! SELL!
My dear friends,
Please, find my technical outlook for GBPNZD below:
The instrument tests an important psychological level 2.2738
Bias - Bearish
Technical Indicators: Supper Trend gives a precise Bearish signal, while Pivot Point HL predicts price changes and potential reversals in the market.
Target - 2.2584
Recommended Stop Loss - 2.2812
About Used Indicators:
Super-trend indicator is more useful in trending markets where there are clear uptrends and downtrends in price.
Disclosure: I am part of Trade Nation's Influencer program and receive a monthly fee for using their TradingView charts in my analysis.
———————————
WISH YOU ALL LUCK

GBPNZD SHORT TERM SELLS BEFORE THE BULLSGbpnzd is expected to sell for a short term correction before the major buys

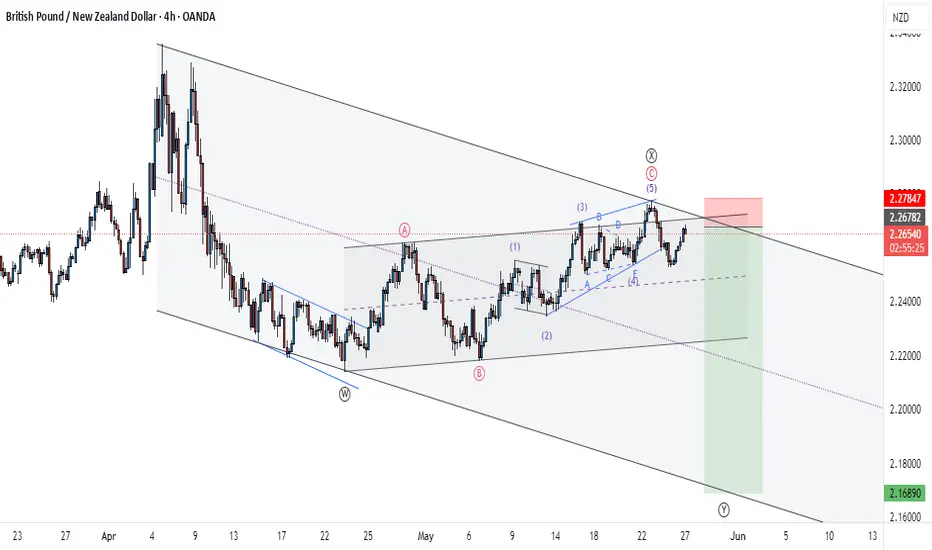
Potential BullsLooks like the market is on a correction phase and done with leg W and X, we`re now looking to complete with leg Y downstairs. It`s a famous pattern in the Elliott wave world.