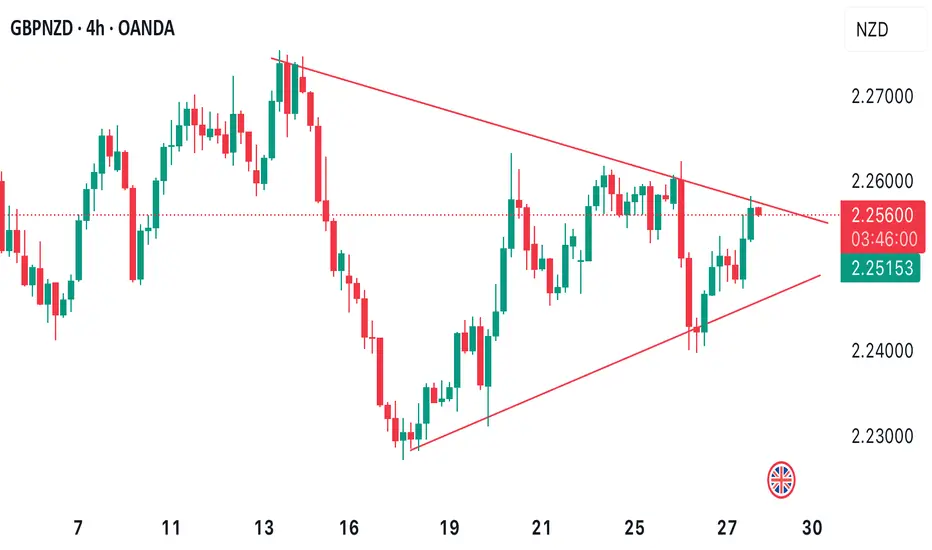
GBPNZD BULLISH TREND CONTINUES Price recently broke out of the symmetrical triangle pattern after bouncing off the pullback support level of 2.23463 we might continue to experience more bullish price movement from the current high.
NZDGBP trade ideas


sell position on GBPNZDpair is reacting to trendline and is probable to go heading south
according to price action pattern we are entering short with reward to risk ratio of 4
RR=4
let's see market reaction


GBP/NZD For Bullishwait for pull-back near by entry point and then go long
general trend is up trend
have fun :)

gbpnzd sell signal
. Don't forget about stop-loss.
Write in the comments all your questions and instruments analysis of which you want to see.
Friends, push the like button, write a comment, and share with your mates - that would be the best THANK YOU.
P.S. I personally will open entry if the price will show it according to my strategy.
Always make your analysis before a trade

GBPNZD SELL?4H timeframe break of structure...with a strong supply order lock....looking like a premium area to short GBP NZD?
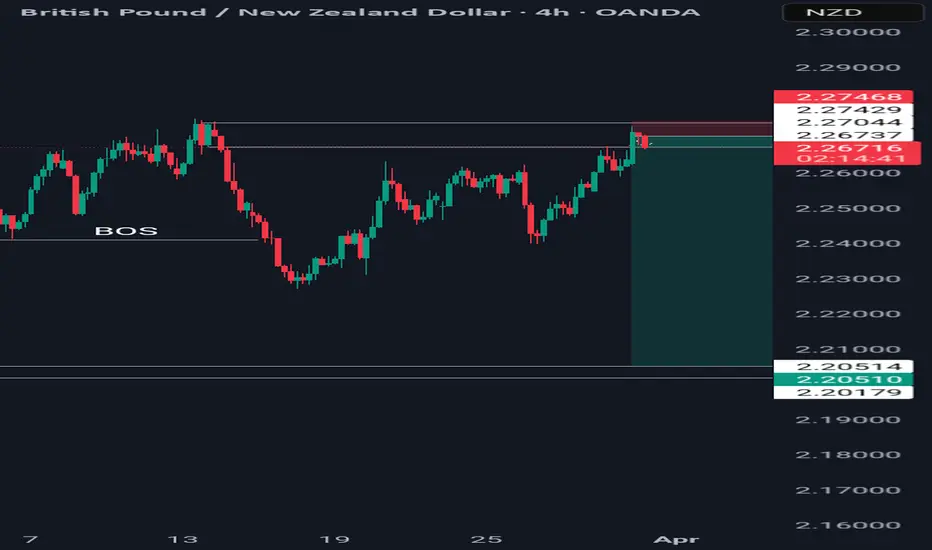
Clean breakDouble top confirmed. the pair is bouncing up to test the broken support (dead cat). Not sure if it will make it all the way up the broken support zone, it might start dropping now. SL triggers if a daily candle closes above the broken support now resistance area.

GBP_NZD GROWTH AHEAD|LONG|
✅GBP_NZD made a retest
Of the key horizontal level of 2.2600
Which is now a support after a powerful
Breakout so we are bullish biased
And we will be expecting a further
Bullish move up
LONG🚀
✅Like and subscribe to never miss a new idea!✅
Disclosure: I am part of Trade Nation's Influencer program and receive a monthly fee for using their TradingView charts in my analysis.

GBPNZD is in Selling DirectionHello Traders
In This Chart GBPNZD 4 HOURLY Forex Forecast By FOREX PLANET
today GBPNZD analysis 👆
🟢This Chart includes GBPNZD market update)
🟢What is The Next Opportunity on GBPNZD Market
🟢how to Enter to the Valid Entry With Assurance Profit
This CHART is For Trader's that Want to Improve Their Technical Analysis Skills and Their Trading By Understanding How To Analyze The Market Using Multiple Timeframes and Understanding The Bigger Picture on the Charts

GBPNZD in down trend ? After recent breakdown the price retested the resistance and after consolidation now looks to be moving in the down trend.

GBP-NZD Free Signal! Buy!
Hello,Traders!
GBP-NZD is trading in an
Uptrend and the pair made
A bullish breakout of the
Key horizontal level of 2.2600
Which is now a support then
Made a retest and we are now
Seeing a bullish rebound
Already which reinforces our
Bullish bias on the pair and
Suggests that we enter
A long trade with the
Take Profit of 2.2715
And the Stop Loss of 2.2568
Buy!
Comment and subscribe to help us grow!
Check out other forecasts below too!
Disclosure: I am part of Trade Nation's Influencer program and receive a monthly fee for using their TradingView charts in my analysis.

GBPNZD The Target Is DOWN! SELL!
My dear subscribers,
This is my opinion on the GBPNZD next move:
The instrument tests an important psychological level 2.2627
Bias - Bearish
Technical Indicators: Supper Trend gives a precise Bearish signal, while Pivot Point HL predicts price changes and potential reversals in the market.
Target - 2.2500
My Stop Loss - 2.2695
About Used Indicators:
On the subsequent day, trading above the pivot point is thought to indicate ongoing bullish sentiment, while trading below the pivot point indicates bearish sentiment.
Disclosure: I am part of Trade Nation's Influencer program and receive a monthly fee for using their TradingView charts in my analysis.
———————————
WISH YOU ALL LUCK

GBPNZD BREAKOUT! BUY!This idea is a follow up to our previously published article. Price broke out of the symmetrical triangle. A buy opportunity is envisaged from the current market price on a short-term. We anticipate price to trade & close a new high this month of March.

GBPNZD Will Move Lower! Short!
Here is our detailed technical review for GBPNZD.
Time Frame: 1D
Current Trend: Bearish
Sentiment: Overbought (based on 7-period RSI)
Forecast: Bearish
The market is trading around a solid horizontal structure 2.263.
The above observations make me that the market will inevitably achieve 2.229 level.
P.S
We determine oversold/overbought condition with RSI indicator.
When it drops below 30 - the market is considered to be oversold.
When it bounces above 70 - the market is considered to be overbought.
Disclosure: I am part of Trade Nation's Influencer program and receive a monthly fee for using their TradingView charts in my analysis.
Like and subscribe and comment my ideas if you enjoy them!

GBPNZD is ready to push againNo comment needed. All information is in the chart analysis.
Steps to follow:
Analyze yourself.
Take the position with SL and Take Profits.
Wait, it may take a couple of days, so take a break and step away from the screen from time to time, just like I do :)
Get the result.
I will update the trade every day.
Like, comment with your good mood or viewpoint, share with your circle. It’s together that we get stronger!
Good trades, Traders!
The golden bear


GBP-NZD Potential Short! Sell!
Hello,Traders!
GBP-NZD is making a local
Bullish move upwards and the
Pair will soon hit a horizontal
Resistance of 2.2620 and after
The retest a local bearish
Correction is to be expected
Sell!
Comment and subscribe to help us grow!
Check out other forecasts below too!
Disclosure: I am part of Trade Nation's Influencer program and receive a monthly fee for using their TradingView charts in my analysis.

GBPNZD SOON TO EXPLODE!Price is currently forming a symmetrical triangle as we’ve seen both the presence of buyers & sellers for the last 3 weeks now. We’re looking forward to seeing price either breaking to the upside for further bullish price action or breaking to the downside for a potential correction of price.
Keep a close watch!
GBPNZD Sell Limit: Shorting from Key Resistance at 2.2590📉 GBPNZD: Sell Limit Trade Idea (Intraday)
Published: 27/03/2025 16:06 | Expires: 28/03/2025 15:00
Overview
Trading Bias: Mixed and volatile, with a preference to sell into rallies.
Market Context: GBPNZD has been showing short-term volatility, with the RSI trending higher, indicating potential for a temporary move upward before resuming the downtrend.
Trade Details
Entry (Sell Limit): 2.2590
Stop Loss: 2.2650 (-60 pips)
Take Profit: 2.2350 (+240 pips)
Risk/Reward Ratio: 4:1
Key Levels
Resistance Levels:
R1: 2.2590 (Bespoke resistance, preferred entry point)
R2: 2.2620
R3: 2.2680
Support Levels:
S1: 2.2450
S2: 2.2400
S3: 2.2330
Rationale
Preferred Setup: We expect a temporary rally into resistance at 2.2590, providing a favorable entry point to initiate short positions.
Momentum: While RSI indicates higher momentum in the short term, this aligns with a corrective rally rather than a sustained bullish move.
Volatility Risks: Key UK economic events (retail sales figures and national accounts) on 28/03/2025 at 07:00 GMT could trigger significant price swings. Traders should closely monitor these data points.
Disclosure: I am part of Trade Nation's Influencer program and receive a monthly fee for using their TradingView charts in my analysis.

GBPNZD Sell GBPNZD is showing a Change of Character (ChoCh) on the Daily, signaling a potential shift in market structure. This is further reinforced by a double top confirmation on the 4-hour timeframe, indicating strong resistance and potential exhaustion of buyers. With price rejecting key levels and bearish momentum building, this setup presents a high-probability sell opportunity, especially if we see a strong bearish break and retest.

GBPNZD is in Selling DirectionHello Traders
In This Chart GBPNZD 4 HOURLY Forex Forecast By FOREX PLANET
today GBPNZD analysis 👆
🟢This Chart includes GBPNZD market update)
🟢What is The Next Opportunity on GBPNZD Market
🟢how to Enter to the Valid Entry With Assurance Profit
This CHART is For Trader's that Want to Improve Their Technical Analysis Skills and Their Trading By Understanding How To Analyze The Market Using Multiple Timeframes and Understanding The Bigger Picture on the Charts
