GBPNZD SELLPrice is forming a head and shoulders pattern on the daily chart. The right shoulder is currently forming, with a minor resistance being tested on the H4 chart. I'll be on the lookout for a signal for entry at that level.
NZDGBP trade ideas

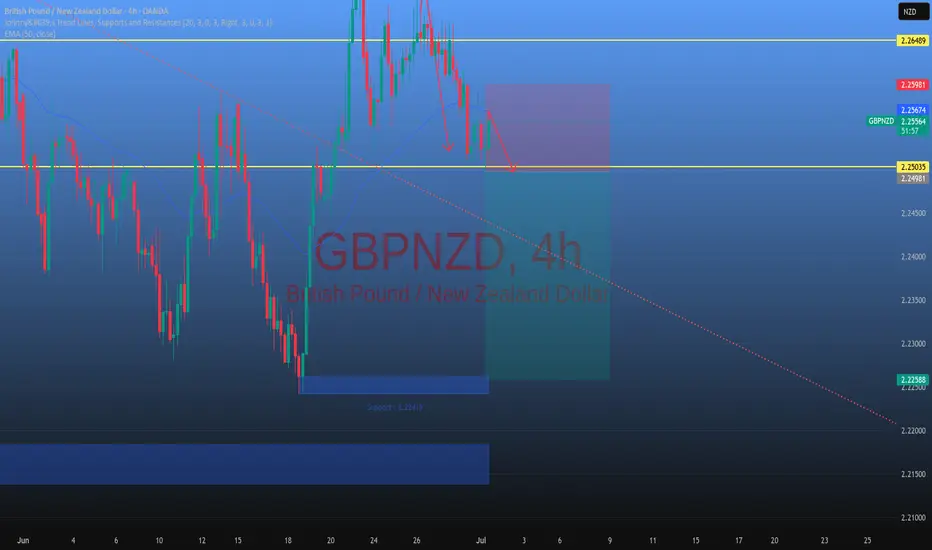
GBPNZD chart suggests a potential long (buy) setupThis GBPNZD chart suggests a **potential long (buy) setup**, but only **after confirmation** via a **break of structure**, as indicated. Here's a full breakdown of the bullish scenario:
---
### 🧠 **Multi-Timeframe Analysis Bias**
* **Weekly: Bearish**
* **Daily: Bearish**
* **12H: Bullish**
* **6H: Mixed (Bearish & Bullish)**
* **4H: Bearish**
* ✅ Overall: **60% Bearish Bias** — but short-term strength is visible.
This means the trade is **counter-trend** on higher timeframes, but has potential due to **short-term structure shift**.
---
### 🧱 **Technical Structure – Inverse Head & Shoulders**
* A **bullish reversal pattern** is forming:
* **Left Shoulder**, **Head**, and **Right Shoulder** identified.
* Entry is planned **only after a clear break of the neckline** (resistance zone), confirming bullish momentum.
---
### 📍 **Key Zones**
* **Neckline / Resistance Zone**: \~2.2525–2.2565 — key level to break for confirmation.
* **Entry** is anticipated after a **successful breakout** and **bullish retest**.
* **Target**: Daily AOI around **2.2727–2.2739**.
* **Stop Loss**: Below the right shoulder, \~2.2507 or lower.
---
### 🧰 **Indicators and Confluences**
* Price is approaching both the **50 EMA** (blue) and **200 EMA** (red).
* A **break above these EMAs and structure** would likely trigger momentum buying.
* Right shoulder formed cleanly inside a **support zone**, providing a valid base for continuation.
---
### 💡 **Buy Trade Idea Summary**
* **Wait for confirmation**: break above 2.2565 structure.
* **Enter on retest** of broken neckline zone (blue arrows path).
* **Target**: 2.2727–2.2739 (Daily AOI).
* **Stop**: Below right shoulder (2.2500–2.2510).
* **Risk/Reward**: Favorable based on projected move and structure.

Market Breakdown Week 28Several pairs on watch. Mainly focusing on the AUD/KIWI pairs for this week.
Looking for the last leg on FX:GBPNZD before the shorts are in play.
CRYPTO:ETHUSD Both trades tagget out, the original for 1% and the other scale-in for -1%.
Still love both plays. Simply waiting till the markets shows its hand.
Explained within the video.
As always, not financial advice.
Keep pushing chads!

GBP NZD Price will use the ema as resistance goes down to my entry point and continue selling waiting for more confirmation !
PRICE SYMMETRYHello awesome traders! 👑✨
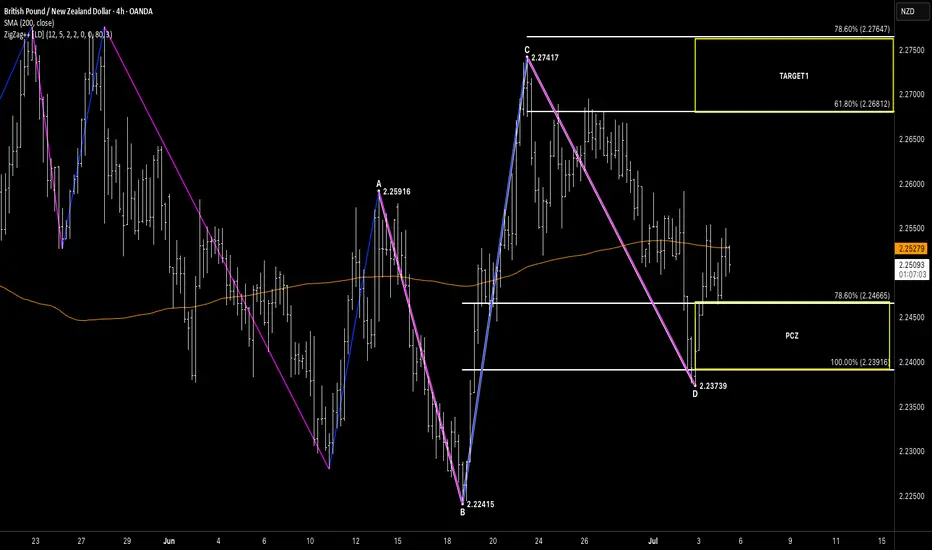
Hope you’ve enjoyed your trading week and snagged some pips! As we wrap up Friday, let’s spotlight GBP/NZD (4H)—a textbook Bullish AB=CD built on perfect price symmetry.
🧠 Setup Breakdown:
AB: 2.25916 → 2.22415 = 351 pips
CD: 2.27417 → 2.23739 = 351 pips
That exact price equality between AB and CD gives us a high-probability reversal edge.
Potential Completion Zone (PCZ):
100% AB extension: 2.23916
78.6% CD retracement: 2.24665
Price dipped into the zone, printed a clean wick at D = 2.23739, and reversed—price symmetry in action.
🎯 Targets in Sight:
TP1 Zone: 2.26812–2.27647 (61.8%–78.6% CD extension)
TP2 Zone: 2.30063–2.31784 (127.2%–161.8% CD extension)
Blueprint: Pattern → Price Symmetry → PCZ → Trigger → Measured Targets. Risk is defined below 2.23739 (the D-point).
💡 What’s Next?
Entry: On a clean bounce back above 2.24665 (top of PCZ).
Stop: Below 2.23739 to respect our symmetry low.
Scale: Take half at TP1; let the rest run to TP2.
If price breaks below 2.23739, we’ll exit and hunt for the next symmetry setup.
Finish the week strong—stay disciplined, trade the structure, and let price symmetry lead the way!
📊 Trade patterns like the pros.
📈 Let structure, not emotion, drive your decisions.
— Your Friendly Harmonic Trading Guide
GN forecastexpecting a bearish move after bearish shift in h1 and h4
this is a bit tricky since there is no clear bearish confirmation in the htf
comment below.

GBPNZD: Potential Reversal From The Resistance Zone-updateGBPNZD: Potential Reversal From The Resistance Zone-update
Based on our previous analysis, GBPNZD has retested 2.7000 and currently appears poised for a bearish movement.
GBPNZD tested an area that was also tested earlier at the beginning of March 2025
From the chart, we can see that this zone has stopped the price several times on the past.
The chances are that GBPNZD may start a bearish wave from the same zone again despite that the market has frozen for all instruments lately.
The Geopolitical situation looks more stable, which can help all currencies regain direction.
NZD is already oversold too much so it can take advantage of this moment.
Key target areas: 2.2500; 2.2380 and 2.2280
You may find more details in the chart!
Thank you and Good Luck!
PS: Please support with a like or comment if you find this analysis useful for your trading day
Disclosure: I am part of Trade Nation's Influencer program and receive a monthly fee for using their TradingView charts in my analysis.

GBPNZD TRADE IDEA UPDATE We've been tapped into the trade on GBPNZD
We should be making our movement to the upside anytime soon.
The market might possibly slow down based on the holidays tomorrow (July 4th)

GBPNZD – Retest & Drop in PlayPrice broke structure and the trendline, pulled back into the previous support-now-turned-resistance, and is reacting from the supply zone.
I'm still holding this short — shared the setup 9 hours ago. If you’re in it too, keep locking in profits as we ride it down.
Targeting the swing low area around 2.165.
Let’s see how it plays out.

GBPNZD Local Short!
HI,Traders !
#GBPNZD made a retest of
The horizontal resistance
Of 2.27442 from where we
Are already seeing a bearish
Pullback so we will be
Expecting a further local
Move down !
Comment and subscribe to help us grow !

GBP/NZD BEST PLACE TO BUY FROM|LONG
Hello, Friends!
Bullish trend on GBP/NZD, defined by the green colour of the last week candle combined with the fact the pair is oversold based on the BB lower band proximity, makes me expect a bullish rebound from the support line below and a retest of the local target above at 2.267.
Disclosure: I am part of Trade Nation's Influencer program and receive a monthly fee for using their TradingView charts in my analysis.
✅LIKE AND COMMENT MY IDEAS✅

Atlas - Top Of The Week Swing Trade Ideas - June 30th 2025Atlas - Top Of The Week Swing Trade Ideas - June 30th 2025
.
By: Noble.Mike.Jamison

GBP/NZD💰Symbol: { GBP/NZD }
🟩Price: { 2.26024 }
🟥Stop: { 2.25646 }
1️⃣profit: { 2.26387 }
2️⃣profit: { 2.26786 }
3️⃣profit: { 2.27323 }
📊Check your chart before entering.
🚨Check before use to make sure there is no important news.🚨

GBPNZD TRADE IDEA We seem to be in for another trade to the upside on gbpnzd.
Let's see how it unfolds and how the market plays out.
We just wait for a pullback to our Fibonacci level for a continuation to the upside
We may or may not drop the update on the progress of this trade.
GBPNZD reached 0.5 Fib and resistance levelGBPNZD has reached the 0.5 Fib and a trendline that may act as resistance which was a support earlier. The price has already rejected from this Area and may again reject from here.

GBPNZD Short Idea
GBPNZD is showing signs of a potential bearish reversal after a strong rally. Price has reached a key resistance level, and momentum is weakening. I’m looking for confirmation with a lower high or bearish candlestick pattern before entering short.

GBP/NZD Potential Bullish Opportunity🔎 Weekly Overview:
Price has respected a key weekly support zone for two consecutive weeks, forming a bullish pin bar followed by a solid bullish candle this week. This shows strong buyer interest from a higher timeframe level.
📉 Daily Chart Explanation:
Daily structure has shifted to the upside. Price is now trading above both EMAs, signaling momentum strength. The internal bullish structure is building up with higher highs and higher lows.
⏱ 4H Chart Explanation:
4-hour chart confirms the bullish narrative with a clean structure of higher highs and higher lows. Price has also broken above previous resistance levels, turning them into support.
🧭 Plan:
Bias: Bullish
Entry: Look for a pullback to recent 4H support or dynamic support near 14EMA/50EMA
Targets:
Recent 4H swing high
Next daily resistance zone
Invalidation: Below the most recent 4H higher low or if price closes back below EMAs with strong bearish momentum
📚 Educational Note:
Rejection pin bars at strong support levels followed by bullish continuation candles are high-probability reversal signals on weekly charts. When supported by bullish structure on lower timeframes, it builds a confluence that swing traders can capitalize on.

GBPNZD BUY TRADE PLAN🔥 Pair + Date: GBP/NZD – 28 June 2025
📋 Plan Overview
Parameter Details
Type Breakout Stop Order (Conditional Plan)
Direction Buy Stop
Status Conditional – Awaiting break of 2.2670 + confirmation
R:R 3:1
Confidence ⭐⭐⭐⭐ (90%) upon confirmation
📈 Market Bias
GBP/NZD is compressing within a H4 range with clear supply lid near 2.2670. Breakout above this level aligns with bullish D1/H4 structure and GBP macro resilience.
🔰 Confidence Factors
HTF bias alignment (D1/H4 bullish structure)
Clear range boundary breakout setup
Confirmation required: H1 close + volume spike + no rejection wick
Session filter: London/NY required
📍 Entry Zone (Trigger)
Buy Stop: 2.2673 (2.2670 + 3 pip buffer)
❗ Stop Loss Reasoning
SL: 2.2620
Placed below last breakout compression swing low, weighted by ATR volatility to guard against false breaks.
🎯 Take Profit Targets
TP Price R:R Description
TP1 2.2720 1.2:1 First liquidity shelf
TP2 2.2780 3:1 H4 supply cluster
TP3 2.2820 4.5:1 D1 swing high supply zone
🧠 Management Strategy
SL to breakeven at TP1
50% partial at TP1
30% partial at TP2
Trail 20% for TP3
Full exit on H1 BOS against breakout
⚠ Entry Confirmation Conditions (Mandatory)
H1 body close above 2.2670
H1 volume spike
No immediate rejection wick on break
Session: London/NY active
⏳ Validity
H1 setup: 12–18h post-break confirmation
❌ Invalidation
Price closes back under 2.2670 after break
H1 BOS against breakout
🌐 Macro Snapshot
GBP sentiment: +6 (risk-on tone, GBP stable)
NZD: slight risk-on fade
DXY: neutral sideways
No immediate red flag data
📋 Final Trade Summary
👉 Buy Stop 2.2673 | SL 2.2625 | TP1 2.2720 | TP2 2.2780 | TP3 2.2820
👉 R:R minimum: 3:1 at TP2
👉 Status: Conditional – Awaiting break + confirm

Descending channel and second-step trapn the descending channel that has formed, the candles indicate a downward move
OANDA:GBPNZD

Potential GBP/NZD long trade setupOkay, let's delve into each of those aspects for this potential GBP/NZD long trade setup:
Probability of This Setup Playing Out
While bullish divergence within a descending wedge can be a strong indication of a potential reversal, it's crucial to remember that no trading setup has a 100% success rate. Here's a breakdown of factors that could influence the probability:
Strength of the Divergence: The clearer and more pronounced the bullish divergence, the higher the potential probability. In your chart, the divergence looks reasonably clear, with the MACD making higher lows while the price makes lower lows.
Breakout Confirmation: The probability increases significantly upon a confirmed breakout above the upper trendline of the descending wedge. A strong bullish candle closing above this line, ideally with increasing volume, would add confidence.
Market Context: Consider the broader market environment. Are there any significant fundamental events (e.g., central bank announcements, economic data releases) related to either the British Pound or the New Zealand Dollar that could disrupt this technical pattern? Strong unexpected news could invalidate the setup.
Timeframe Congruence: While you're looking at the 4-hour chart, checking higher timeframes (daily, weekly) can provide context on the overall trend. If the longer-term trend aligns with your bullish bias, it can increase the probability of success.
Risk Sentiment: Overall market risk sentiment can also play a role. GBP/NZD can be sensitive to risk appetite.
In summary: The setup has a decent probability due to the bullish divergence and the potential for a wedge breakout, but it's essential to wait for confirmation and be aware of the broader market context.
Potential Entry Points
There are a few potential entry points you could consider, each with its own risk and reward profile:
Aggressive Entry: Entering immediately upon a strong bullish candle breaking and closing above the upper trendline of the descending wedge. This offers the potential for the best entry price but also carries a higher risk of a false breakout.
Conservative Entry: Waiting for a breakout and then a successful retest of the broken upper trendline as support before entering. This can offer a lower-risk entry as it confirms that the previous resistance has now become support. However, the price might not always retest.
Entry on Confirmation Signals: Looking for additional bullish confirmation signals on lower timeframes (e.g., 1-hour chart) after the initial breakout. This could include bullish candlestick patterns or further positive momentum on indicators.
Recommendation: For a balance of potential reward and risk management, waiting for a confirmed breakout followed by potential confirmation on a lower timeframe might be a prudent approach.
Risk Management Strategies
Effective risk management is paramount for any trade. Here are some strategies you could employ:
Stop-Loss Placement: already marked a potential stop-loss level below the recent swing low within the wedge. This is a logical placement as a break below this level could invalidate the bullish setup. Ensure your stop-loss is at a level that, if hit, would indicate the analysis was likely incorrect.
Position Sizing: Only risk a small percentage of your trading capital on this trade (e.g., 1-2%). This will protect you from significant losses even if the trade goes against you. Calculate your position size based on the distance between your entry point and your stop-loss.
Reward-to-Risk Ratio: Aim for a favorable reward-to-risk ratio. Your target levels (TRG 1, TRG 2, TRG 3) allow you to visualize potential profits. Ensure that the potential profit outweighs the potential loss before taking the trade. For example, if your stop-loss represents 20 pips of risk, aim for at least 40-60 pips of potential profit at your initial target (1:2 or 1:3 reward-to-risk).
Trailing Stop-Loss: Once the trade moves into profit, consider using a trailing stop-loss to lock in gains and protect against a sudden reversal.
Confirmation Signals You Might Look For
Beyond the initial breakout, here are some additional signals that could strengthen your bullish conviction:
Increased Volume: Higher trading volume during the breakout suggests strong buying pressure and increases the likelihood of the move being genuine.
Bullish Candlestick Patterns: Formation of bullish candlestick patterns (e.g., bullish engulfing, morning star) after the breakout or during a potential retest can signal further buying interest.
Moving Average Crossovers: If you use moving averages, look for bullish crossovers (e.g., the shorter-term moving average crossing above the longer-term moving average) after the breakout.
MACD Crossover Above Zero: The MACD line crossing above the signal line and then moving above the zero line would indicate increasing bullish momentum.
RSI Above 50: The Relative Strength Index (RSI) moving above the 50 level can confirm increasing bullish strength.
How Fundamentals Might Impact This Technical Analysis
While your analysis is primarily technical, it's crucial to be aware of how fundamental factors could influence GBP/NZD:
Central Bank Policies: Monetary policy decisions and statements from the Bank of England (BoE) and the Reserve Bank of New Zealand (RBNZ) are major drivers for these currencies. Any unexpected hawkish or dovish signals could significantly impact the exchange rate.
Economic Data: Key economic data releases from the UK (e.g., inflation, employment, GDP) and New Zealand (e.g., inflation, employment, trade balance) can lead to volatility and potentially override technical patterns.
Global Risk Sentiment: As mentioned earlier, GBP/NZD can be influenced by global risk appetite. During times of risk aversion, safe-haven currencies might strengthen, potentially impacting this pair.
Geopolitical Events: Unexpected geopolitical events can also introduce volatility and affect currency valuations.
Recommendation: Before taking the trade, it's wise to check the economic calendar for any high-impact news releases scheduled for the British Pound and the New Zealand Dollar in the coming days. Be prepared for potential volatility around these events.
Let me know if you have any more questions or would like to explore any of these points in more detail!
i would love to hear back from you your thoughts on this pair

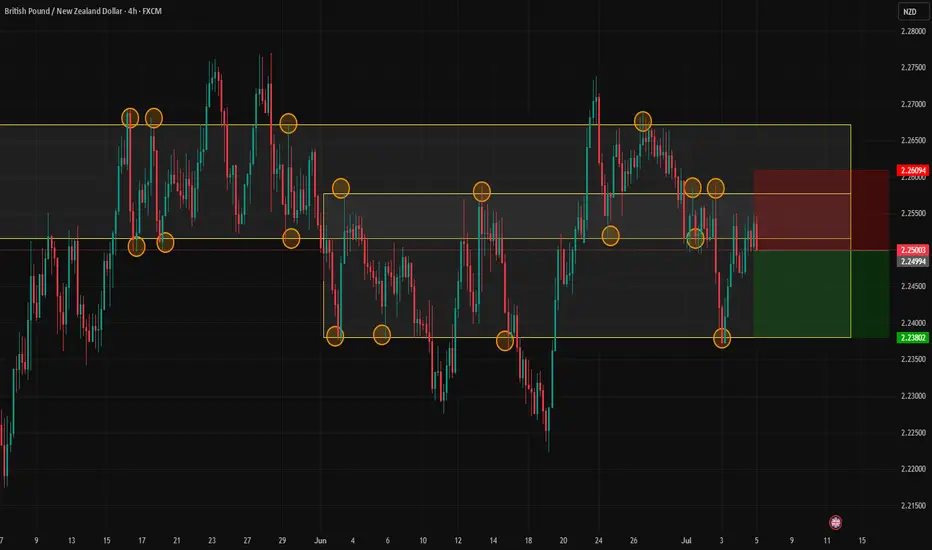
Old Roof, New Floor: GBPNZD Eyes 2.2730Price just flipped 2.2580 from resistance to support. As long as that floor holds, I’m looking for a push toward 2.2730. Invalidation below 2.2500
⚠️ Heads-up: BoE Governor Bailey speaks tomorrow (Jun 24). A dovish tone could knock GBP lower and spoil the setup.

GBPNZD BREAK & RETEST OF KEY LEVEL.(DAILY) - Price is in an uptrend.
(DAILY) - Price hit Key Resistance level at (2.27722 - 2.27208) was rejected and sold off to the previous broken resistance now turned support at (2.25925 - 2.25197).
(H4) - Price formed Double bottom higher low which is a bullish pattern at (2.25925 - 2.25197).
(H4)- 50 EMA touching our Key level at (2.25925 - 2.25197) and acting as support.
Stop Loss at new higher low (2.25497)
Target at 2.27722.
