#GBPNZD:+1000 PIPS Two Take Profit Swing Buy Analysis The price is currently consolidating, indicating no clear move. We’re looking for a safe entry point here. There are two potential targets for setting your take profit. We anticipate a strong price reversal on this pair and significant volume in the coming weeks.
Good luck! Show us some support by liking and commenting on the ideas.
Team Setupsfx_
NZDGBP trade ideas

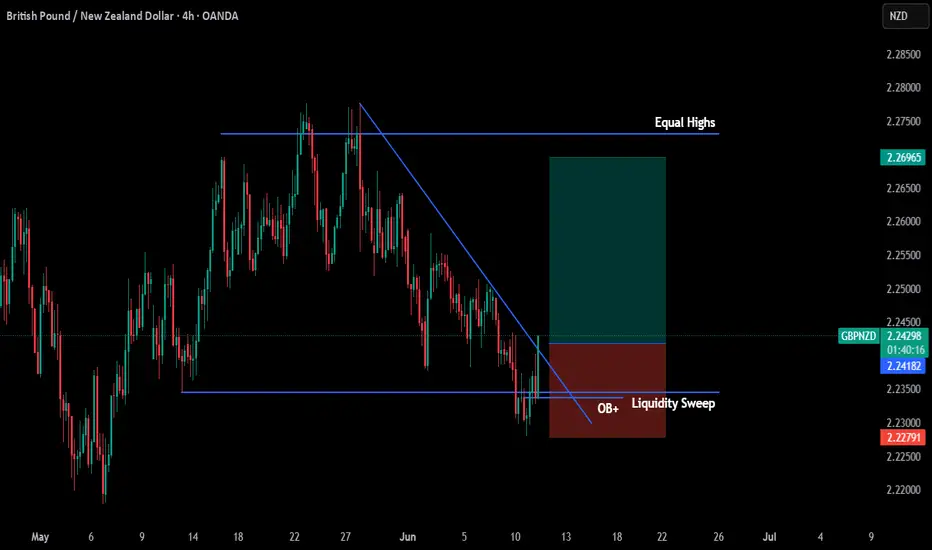
GBP/NZD | Potential Upward Movement💡 Buy Market Order @ 2.24182
🎯 Target Profit 2.26965
🛑 Stop Loss 2.22791
❌ Do not risk more than 1% of your account on each trade
Description:
GBP/NZD has reacted to a strong demand zone and the market has swept swing lows under the 2.2343 mark. Now the price is reacting to the bullish order block and we expect a move higher all the way higher toward the equal highs at 2.26842 level.
-------------------------------------------------------------------------------------
Please press “Like” if you appreciate the trading idea 👍
“Follow” for more trading ideas in the future 👀
“Comment” below to share your thoughts with us and other traders 👥
-------------------------------------------------------------------------------------
Risk Disclaimer: All trading ideas published by “PriceActionDesk” are for educational purposes only. These posts can help you to enhance your trading skills, but please do your own research before opening any trading position. ⚠️
-------------------------------------------------------------------------------------
🙂 Good Luck!
gbpnzd buy signal. Don't forget about stop-loss.
Write in the comments all your questions and instruments analysis of which you want to see.
Friends, push the like button, write a comment, and share with your mates - that would be the best THANK YOU.
P.S. I personally will open entry if the price will show it according to my strategy.
Always make your analysis before a trade

GBPNZD buying???Long time coming with this one, pretty confident in my entries.
Not much to say, liquidity grab on H4 and daily, overall trend bullish, anticipating buys bullish movementsnon this pair.
Good luck traders!....

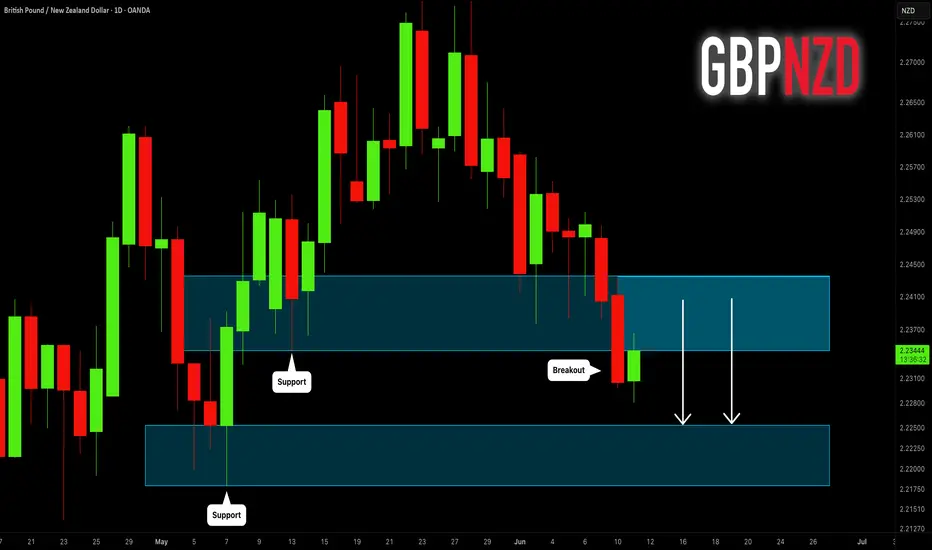
GBPNZD: Important Breakout 🇬🇧🇳🇿
GBPNZD broke and closed below a key daily support cluster.
The broken structure turned into a strong resistance.
I will expect a bearish movement from that at least to 2.2255 support.
❤️Please, support my work with like, thank you!❤️
Possible bullish outlook , Structurally, gn is in a bullish market environment until this Major high is taken out ,
Algorithmically , it has shown tht we are in a bullish environment by a structure break , and currently price Is on it way to fetch the bullish banks into the bullish market environment, I would be looking at this level for a possible bullish rentry for the banks

GBPNZD: Breakout & Bearish Continuation📉GBPNZD pair formed a distinct descending triangle pattern on the 4-hour time frame.
Breaking below its neckline is a significant bearish indicator, suggesting a strong likelihood of a further decline.
The next support level is at 2.2200.

GBP/NZD Giving Amazing Bearish P.A , Be Ready For Extra 250 PipsHere is my opinion on GBP/NZD , this pair is very bearish and now we have a very good breakout for second support and we have a very good closure below it so i see that we have a good chance to sell it when the price go back to retest the broken support if we have a good touch and bearish price action , we can targeting 200 pips .

GBPNZD Is Going Down! Sell!
Please, check our technical outlook for GBPNZD.
Time Frame: 9h
Current Trend: Bearish
Sentiment: Overbought (based on 7-period RSI)
Forecast: Bearish
The market is approaching a key horizontal level 2.249.
Considering the today's price action, probabilities will be high to see a movement to 2.237.
P.S
Please, note that an oversold/overbought condition can last for a long time, and therefore being oversold/overbought doesn't mean a price rally will come soon, or at all.
Disclosure: I am part of Trade Nation's Influencer program and receive a monthly fee for using their TradingView charts in my analysis.
Like and subscribe and comment my ideas if you enjoy them!

gbpnzd buy signal. Don't forget about stop-loss.
Write in the comments all your questions and instruments analysis of which you want to see.
Friends, push the like button, write a comment, and share with your mates - that would be the best THANK YOU.
P.S. I personally will open entry if the price will show it according to my strategy.
Always make your analysis before a trade

GBP_NZD GROWTH AHEAD|LONG|
✅GBP_NZD went down to retest
A horizontal support of 2.2346
Which makes me locally bullish biased
And I think that a move up
From the level is to be expected
Towards the target above 2.2449
LONG🚀
✅Like and subscribe to never miss a new idea!✅
Disclosure: I am part of Trade Nation's Influencer program and receive a monthly fee for using their TradingView charts in my analysis.

GBPNZD Ready to Flip? Key Reversal Zone in Play🔹 1. Price Action and Technical Structure
Price is currently at 2.2405, declining from the recent high in the 2.26–2.28 area.
The pair completed a descending channel with potential for reversal. A bullish reaction is taking place from the 2.2280–2.2170 demand zone, supported by previous volume spikes.
The RSI is falling, nearing oversold territory but not yet at extreme levels.
Possible technical scenarios:
Bullish: Recovery toward 2.2560–2.2600, with a potential breakout above recent highs.
Bearish: A break below 2.2170 could trigger further downside toward 2.2000 and 2.1800.
🔹 2. Seasonality (June)
NZD
June tends to be slightly positive for NZD (average: +0.0011 over 20 years), with consistent monthly patterns.
GBP
June is historically neutral to negative for GBP (average: +0.0015 over 20 years, but negative over 5 and 2 years).
➡️ This implies a seasonal edge for NZD over GBP.
🔹 3. Retail Sentiment
60% of retail traders are long on GBPNZD.
40% are short, but long positions average 2.1874, currently in profit.
➡️ This presents a mild contrarian bearish pressure, due to crowding on the long side.
🔹 4. Commitment of Traders (COT) – Institutional Positioning
GBP (as of 2025-06-03)
Commercials Net Long: +74.5K
Non-Commercials Net Short: -11.3K
Weekly changes: +30.3K longs vs. +32.6K shorts
➡️ Moderate balance, but growing speculative short interest.
NZD (as of 2025-06-03)
Non-Commercials Net Short: -23.6K
Strong weekly increase in commercial longs (+6.4K) and total long flows
➡️ NZD is seeing renewed interest from commercial players — a potential bullish signal.
🔹 5. Trading Outlook
📌 Current Bias: Neutral with short-term bearish tilt, but medium-term bullish reversal risk rising.
➤ Potential setups:
Conservative Long Entry: On bullish confirmation at 2.2170 (double bottom or bullish engulfing), target 2.2560–2.2600
Aggressive Short Entry: On pullback to 2.2490–2.2560, with stop above 2.2620, target 2.2280–2.2170
🎯 Seasonal and institutional factors favor NZD strength, but technical structure calls for caution and confirmation.

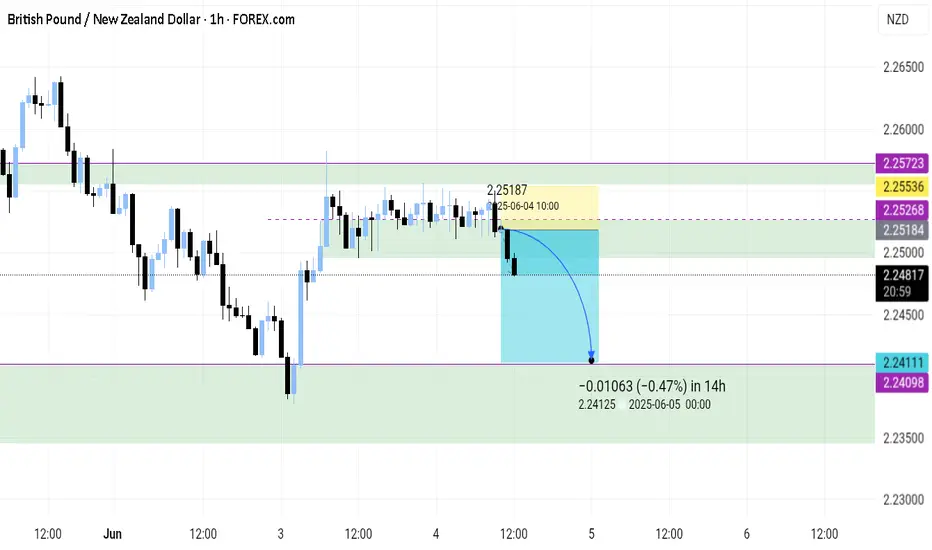
GBPNZD: Classic Pullback Trade 🇬🇧🇳🇿
GBPNZD may pull back from the underlined horizontal support.
As a confirmation, I see a rejection from that first,
and a formation of a bullish imbalance candle on 1H time frame then.
Goal - 2.244
❤️Please, support my work with like, thank you!❤️

GBP/NZDPrice has already started it's distribution faze.
I look to enter the market with a small position on market open targeting the major high.
SolarFX

GBP/NZD..SELLThe sellers are stepping in this week on this pair we have a break of support that turned into resistance to continue the down trend.

GBPNZD SHORTMarket structure bearish o HTFs 3
Entry at Daily AOi
Weekly Rejection At AOi
Weekly Previous Structure Point
Daily Rejection AOi
Daily Previous Structure Point
Around Psychologiical Level 2.26000
H4 EMA retest
H4 Candlestick rejection
Rejection from Previous structure
Levels 5.14
Entry 110%
REMEMBER : Trading is a Game Of Probability
: Manage Your Risk
: Be Patient
: Every Moment Is Unique
: Rinse, Wash, Repeat!
: Christ is King.

gbpnzd sellprice is in a 1hr supply at the moment and trend is bearish on 1hr 4hr tf. price is visiting the 1hr zone for the first time on 15m tf. it will form a double top if it closes fueling sell momentum. since its been in a steady uptrend it may look to retrace if it wants to go up. im looking to enter once price trade below the leg of the swing entering the 1hr zone.

GBP/NZD LONG FROM SUPPORT
GBP/NZD SIGNAL
Trade Direction: long
Entry Level: 2.245
Target Level: 2.268
Stop Loss: 2.229
RISK PROFILE
Risk level: medium
Suggested risk: 1%
Timeframe: 12h
Disclosure: I am part of Trade Nation's Influencer program and receive a monthly fee for using their TradingView charts in my analysis.
✅LIKE AND COMMENT MY IDEAS✅

GBP/NZD - Triangle Breakout (05.06.2025)The GBP/NZD Pair on the M30 timeframe presents a Potential Selling Opportunity due to a recent Formation of a Triangle Breakout Pattern. This suggests a shift in momentum towards the downside in the coming hours.
Possible Short Trade:
Entry: Consider Entering A Short Position around Trendline Of The Pattern.
Target Levels:
1st Support – 2.2345
2nd Support – 2.2285
🎁 Please hit the like button and
🎁 Leave a comment to support for My Post !
Your likes and comments are incredibly motivating and will encourage me to share more analysis with you.
Best Regards, KABHI_TA_TRADING
Thank you.
Disclosure: I am part of Trade Nation's Influencer program and receive a monthly fee for using their TradingView charts in my analysis.

GBPZND MARKET ANALYSIS AND PRICE PREDICTION GBPNZD , has finished consolidating at the Institutional renegotiation zone, decision has been taken in favor of the Bull. Price has already swept the Sell Side Liquidity and upward movement is certain. Market is trading downward to mitigate an order block and fill up the imbalance, then The Bull will have a perfect entry at 75% discount price.
Entry, stop loss and take profit are clearly stated on the chat.
GOOD LUCK GUYS!
DISCLAIMER
This analysis may fail due to market uncertainties, take full responsibility of your capital and manage your own risk.

GBPNZD SHORT TRADE3 Levels have been issued and we are coming off the RESET Peak on H1. I will be expecting to see 3 more levels being issued to the downside.

GBPNZD 03/06/2025Weekly:
-Inverse H&S pattern.
-Liquidity sweep.
Daily:
-Bullish M pattern.
-Inverse H6S pattern.
4H:
-Inverse H&S pattern.
-Bullish M pattern.
-IC.
