NZDJPY - bulls are exhausted! Hello TradingView Family / Fellow Traders. This is Richard, also known as theSignalyst.
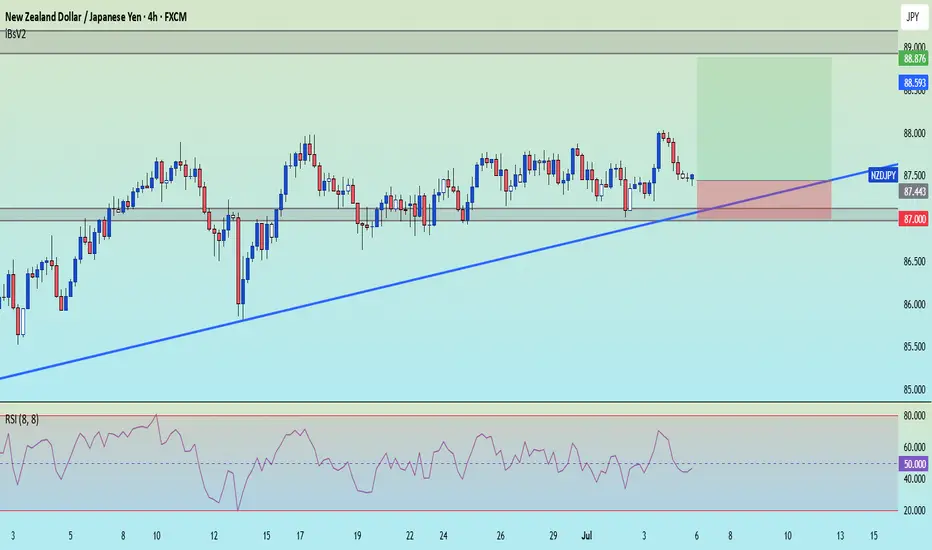
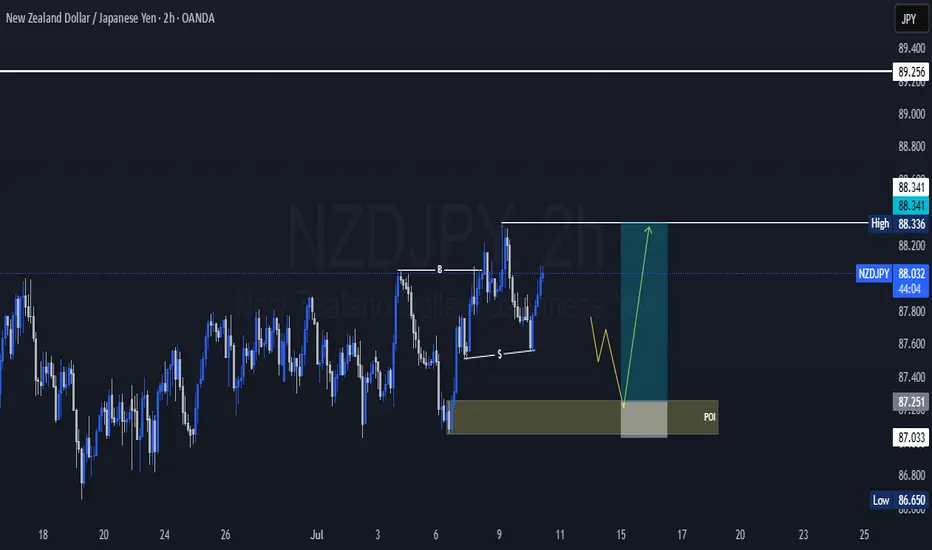
📈NZDJPY has been overall bullish trading within the rising flat channel marked in blue and it is currently retesting the upper bound of it.
Moreover, the green zone is a strong structure.
🏹 Thus, the highlighted red circle is a strong area to look for sell setups as it is the intersection of the upper blue trendline and green structure.
📚 As per my trading style:
As #NZDJPY is hovering around the red circle zone, I will be looking for bearish reversal setups (like a double top pattern, trendline break , and so on...)
📚 Always follow your trading plan regarding entry, risk management, and trade management.
Good luck!
All Strategies Are Good; If Managed Properly!
~Rich
Disclosure: I am part of Trade Nation's Influencer program and receive a monthly fee for using their TradingView charts in my analysis.
NZDJPY trade ideas

NZDJPY SELLDetailed NZD JPY forecast as well as a New Zealand Dollar Japanese Yen technical analysis through moving averages, buy/sell signals, and common chart
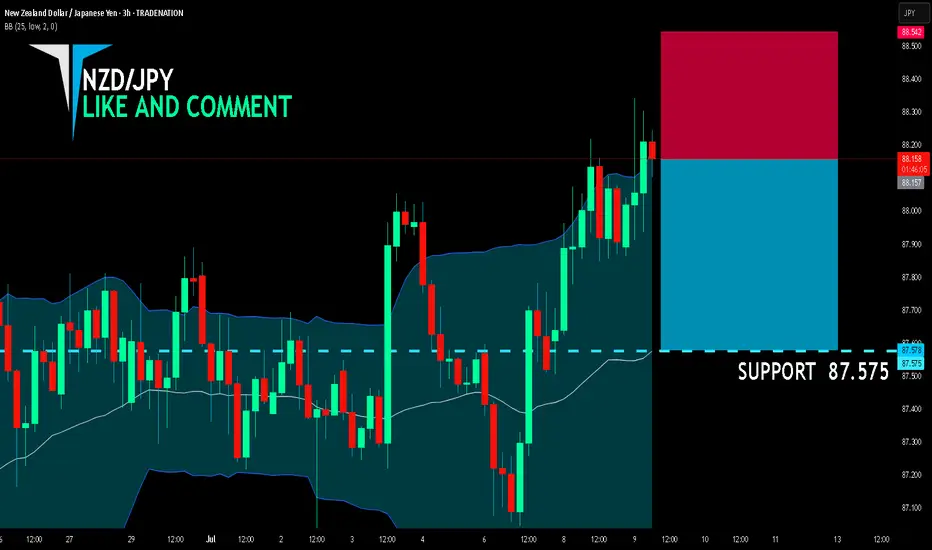
NZD/JPY BEARS ARE STRONG HERE|SHORT
NZD/JPY SIGNAL
Trade Direction: short
Entry Level: 88.157
Target Level: 87.575
Stop Loss: 88.542
RISK PROFILE
Risk level: medium
Suggested risk: 1%
Timeframe: 3h
Disclosure: I am part of Trade Nation's Influencer program and receive a monthly fee for using their TradingView charts in my analysis.
✅LIKE AND COMMENT MY IDEAS✅
NZDJPY to find buyers at previous support?NZDJPY - 24h expiry
The primary trend remains bullish.
Short term RSI is moving lower.
Preferred trade is to buy on dips.
Risk/Reward would be poor to call a buy from current levels.
Bespoke support is located at 87.50.
We look to Buy at 87.50 (stop at 87.30)
Our profit targets will be 88.30 and 88.50
Resistance: 88.00 / 88.30 / 88.50
Support: 87.50 / 87.20 / 87.00
Risk Disclaimer
The trade ideas beyond this page are for informational purposes only and do not constitute investment advice or a solicitation to trade. This information is provided by Signal Centre, a third-party unaffiliated with OANDA, and is intended for general circulation only. OANDA does not guarantee the accuracy of this information and assumes no responsibilities for the information provided by the third party. The information does not take into account the specific investment objectives, financial situation, or particular needs of any particular person. You should take into account your specific investment objectives, financial situation, and particular needs before making a commitment to trade, including seeking advice from an independent financial adviser regarding the suitability of the investment, under a separate engagement, as you deem fit.
You accept that you assume all risks in independently viewing the contents and selecting a chosen strategy.
Where the research is distributed in Singapore to a person who is not an Accredited Investor, Expert Investor or an Institutional Investor, Oanda Asia Pacific Pte Ltd (“OAP“) accepts legal responsibility for the contents of the report to such persons only to the extent required by law. Singapore customers should contact OAP at 6579 8289 for matters arising from, or in connection with, the information/research distributed.

NZDJPY Potential UpsidesHey Traders, in the coming week we are monitoring NZDJPY for a buying opportunity around 87.200 zone, NZDJPY is trading in an uptrend and currently is in a correction phase in which it is approaching the trend at 87.200 support and resistance area.
Trade safe, Joe.
NZDJPY Strong Breakout!
HI,Traders !
NZDJPY is trading in an
Uptrend and the pair has
Made a bullish breakout of
The key horizontal level
Of 87.394 and the breakout
Is confirmed so we are
Bullish biased and we
Will be expecting a further
Bullish move up !
Comment and subscribe to help us grow !

NZDJPY H4 LongNZDJPY finish the downtrend correction and ready to go long. price is above EMA 200 .
in H4 is the uptrend started and price above strong Support/Resistant area.
Buy NZDJPY Buy Opportunities on NZDJPY
ENTRY: 87.100
STOPLOSS: 86.900
TAKE PROFIT: 88.00
COMMENT YOUR OPINION
For fund management contact me on X @shajudeakinoba1

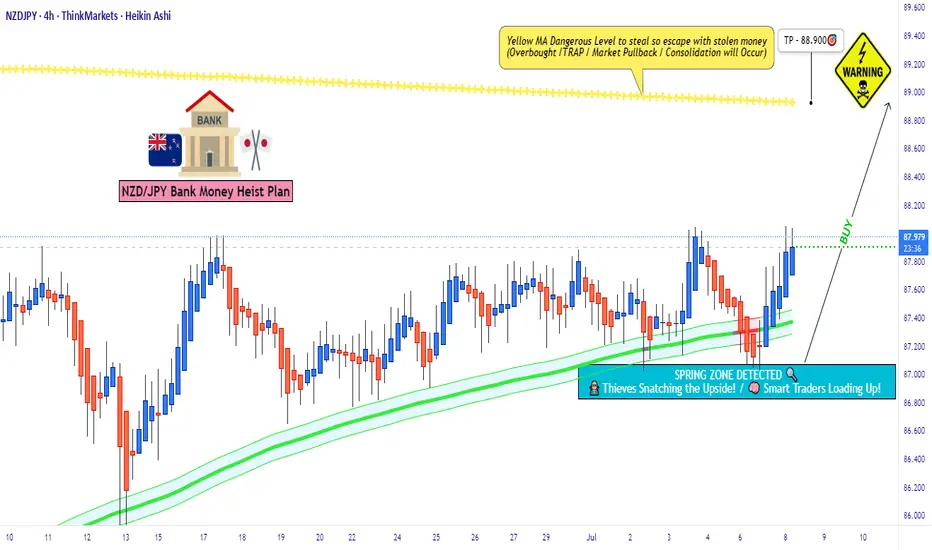
"Trap or Opportunity? NZD/JPY Smart Pullback Play?"💼🎯 NZD/JPY – The Kiwi Vault Breakout | Thief Trading Style Forex Blueprint 🔓📈
🌟Hola! Hello! Ola! Bonjour! Hallo! Marhaba, Global Market Raiders!🌍✨
Welcome to the Thief Trading Style – where smart traders strategize, strike, and secure the bag. This is not your regular trade idea... this is a market infiltration plan – a tactical move on the NZD/JPY pair, aka the Kiwi vs Yen Battle Zone.
🎯 Plan Overview – Operation: Kiwi Vault Breakout
Using a mix of technical heatmaps, smart money concepts, and macro insight, this chart outlines a bold plan for Long Position scalpers and swing tacticians.
💹 The current trend shows signs of bullish momentum, with price eyeing the upper yellow zone – a known resistance pocket where liquidity pools and trap setups often play out.
📈 Entry Strategy – The Gate Is Open
Buy Limit zones:
☑️ Watch the 15/30 min timeframe for pullbacks to nearest swing low/high.
☑️ Ideal for scalpers & swing traders aiming for precise entries.
🧠 “Enter like a shadow, exit like thunder.”
🛑 Stop Loss – Secure Your Capital
Place SL at:
☑️ Recent swing low/high (Based on 4H structure – approx. 87.200)
☑️ Adjust according to your lot size, capital exposure, and position count
Remember, SL is not fear — it's discipline.
🎯 Target – Precision Exit
🎯 TP Zone: 88.900
⚠️ Optional: Exit earlier based on reaction to key levels, or trail your stop to lock gains.
💡 "Profit isn't greed, it's your reward for precision."
⚡Trader Roles – Choose Your Mode
👀 Scalpers:
Only trade the long bias. No short-circuiting the plan.
Use trailing stops to guard gains and surf the momentum waves.
📈 Swing Traders:
You’re in for a full ride — ride the wave till the next institutional block.
Stay patient, and let price develop before jumping in.
🔍 Analysis Backdrop – What’s Fueling the Move?
The bullish push is backed by:
🔸 Positive fundamental & macro signals
🔸 Institutional positioning (check COT Reports)
🔸 Intermarket correlation strength
🔸 Market sentiment score
📊 Want full breakdowns? Dive into COT, Macro Reports, Quant Flow & more → 🔗🔗🔗 Klick
📰 Risk Reminder – News Volatility Warning
🚨 Avoid new entries during major data releases
🔒 Protect open positions with trailing SLs
⚙️ Manage risk – trading is about probability, not certainty
💬 Final Words – Boost the Blueprint
💥Hit “Like” if you vibe with this strategy and support the community of tactical traders.
This plan is designed to bring clarity, structure, and a bit of swagger to your chart screen.
See you in the next setup – stay sharp, stay stealthy. 💼🧠💪
Disclaimer:
This idea is for educational purposes only and not investment advice. Please evaluate your own risk tolerance and market understanding before entering any trades.
NZDJPY Buyers In Panic! SELL!
My dear followers,
This is my opinion on the NZDJPY next move:
The asset is approaching an important pivot point 88.573
Bias - Bearish
Technical Indicators: Supper Trend generates a clear short signal while Pivot Point HL is currently determining the overall Bearish trend of the market.
Goal - 88.065
About Used Indicators:
For more efficient signals, super-trend is used in combination with other indicators like Pivot Points.
Disclosure: I am part of Trade Nation's Influencer program and receive a monthly fee for using their TradingView charts in my analysis.
———————————
WISH YOU ALL LUCK
selling opportunity from resistance level-ForexbdNZDJPY is at a price resistance level in the H-4 market, so it is expected that the market will go into a downtrend from this level.
You can share your opinion.
⭕️Risk Warning : Trading on financial markets carries risks!
©FXBD Official Team

NZDJPY Technical + Fundamental Short Alignment = Short SetupToday, I want to review the NZDJPY ( OANDA:NZDJPY ) pair short position from a fundamental and technical perspective . It seems to be in a good zone for a short position.
Do you agree with me?
----------------------------------------
First, let's look at the fundamentals of NZDJPY.
New Zealand (RBNZ):
The Reserve Bank of New Zealand cut the OCR by 25bps in May and hinted at further easing if inflation continues to cool. Recent CPI data has shown clear disinflation trends, increasing the likelihood of more rate cuts in the second half of 2025. Consumer confidence is also declining, and retail sales have been weaker than expected.
Japan (BoJ):
The Bank of Japan is under growing pressure to tighten monetary policy. Inflation remains above 2%, and market expectations for a rate hike later this year are building. Any shift from ultra-loose policy supports JPY strength, especially against weaker yielders like NZD.
Macro Summary:
Diverging monetary policies: RBNZ easing, BoJ possibly tightening.
NZD weakened by soft data, JPY strengthened by policy expectations.
Risk sentiment is currently neutral-to-negative, favoring safe-haven JPY.
Conclusion:
Short NZDJPY is fundamentally justified. The pair aligns with macro forces: NZD is pressured by rate cuts and weak growth, while JPY is poised to strengthen with upcoming policy shifts.
----------------------------------------
Now let's take a look at the NZDJPY chart on the 4-hour time frame .
NZDJPY is currently trading near the Potential Reversal Zone(PRZ) .
In terms of classic technical analysis , it appears that NZDJPY has successfully formed a Rising Wedge Pattern .
Also, we can see the Regular Divergence(RD-) between Consecutive Peaks.
Based on the above explanation , I expect NZDJPY to drop to at least 87.159 JPY if the lower line of the Rising Wedge Pattern and the Support zone(86.50 JPY-87.00 JPY) are broken, the second target could be 86.043 JPY .
Note: Stop Loss(SL): 88.378 JPY
Please respect each other's ideas and express them politely if you agree or disagree.
New Zealand Dollar/ Japanese Yen Analyze (NZDJPY), 4-hour time frame.
Be sure to follow the updated ideas.
Do not forget to put a Stop loss for your positions (For every position you want to open).
Please follow your strategy and updates; this is just my Idea, and I will gladly see your ideas in this post.
Please do not forget the ✅' like '✅ button 🙏😊 & Share it with your friends; thanks, and Trade safe.

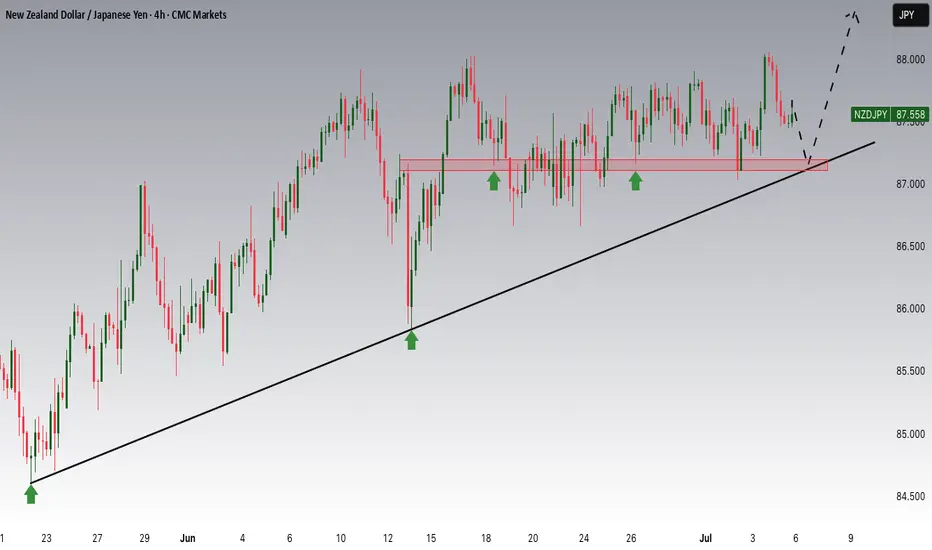
NZDJPY still bullish expected
OANDA:NZDJPY trend based analysis, bullish structure visible, price few time bounc on trend line, but its not make to much it makes soonand reverses, currently price on good zone and from here expecting new bullish.
SUP zone: 87.350
RES zone: 88.450, 88.850

NZD_JPY WAIT FOR BREAKOUT|LONG|
✅NZD_JPY is trading in an
Uptrend and the pair has formed
A bullish triangle pattern
And we are bullish biased
So IF we see a bullish breakout
It will be our signal that
A bullish continuation is
Likely and we will be
Able to enter a long trade
LONG🚀
✅Like and subscribe to never miss a new idea!✅
Disclosure: I am part of Trade Nation's Influencer program and receive a monthly fee for using their TradingView charts in my analysis.

NZDJPY Potential UpsidesHey Traders, in today's trading session we are monitoring NZDJPY for a buying opportunity around 87.250 zone, NZDJPY is trading in an uptrend and currently is in a correction phase in which it is approaching the trend at 87.250 support and resistance area.
Trade safe, Joe.

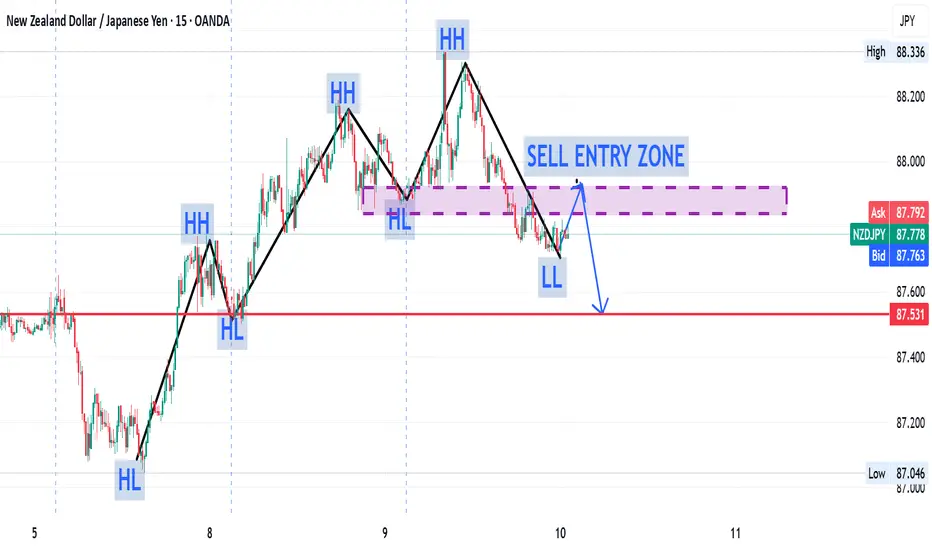
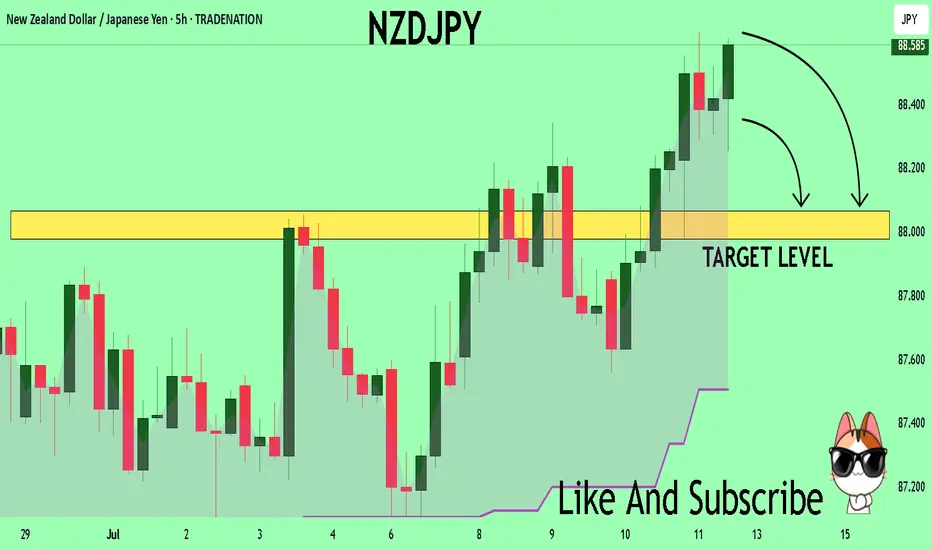
NZDJPY to find sellers at market price?NZDJPY - 24h expiry
Trading has been mixed and volatile.
Price action looks to be forming a top.
We look for a temporary move higher.
Preferred trade is to sell into rallies.
Bespoke resistance is located at 87.80.
We look to Sell at 87.80 (stop at 88.00)
Our profit targets will be 87.00 and 86.85
Resistance: 87.80 / 88.00 / 88.25
Support: 87.20 / 87.00 / 86.75
Risk Disclaimer
The trade ideas beyond this page are for informational purposes only and do not constitute investment advice or a solicitation to trade. This information is provided by Signal Centre, a third-party unaffiliated with OANDA, and is intended for general circulation only. OANDA does not guarantee the accuracy of this information and assumes no responsibilities for the information provided by the third party. The information does not take into account the specific investment objectives, financial situation, or particular needs of any particular person. You should take into account your specific investment objectives, financial situation, and particular needs before making a commitment to trade, including seeking advice from an independent financial adviser regarding the suitability of the investment, under a separate engagement, as you deem fit.
You accept that you assume all risks in independently viewing the contents and selecting a chosen strategy.
Where the research is distributed in Singapore to a person who is not an Accredited Investor, Expert Investor or an Institutional Investor, Oanda Asia Pacific Pte Ltd (“OAP“) accepts legal responsibility for the contents of the report to such persons only to the extent required by law. Singapore customers should contact OAP at 6579 8289 for matters arising from, or in connection with, the information/research distributed.

Nzd/JpY Sell 2 Buy.Since well now the supply area is mitigated and about to drop to demand area which is resting at the flipped zone created as strong buy zone for buyers .
I will see how it goes ..
HappY Trading

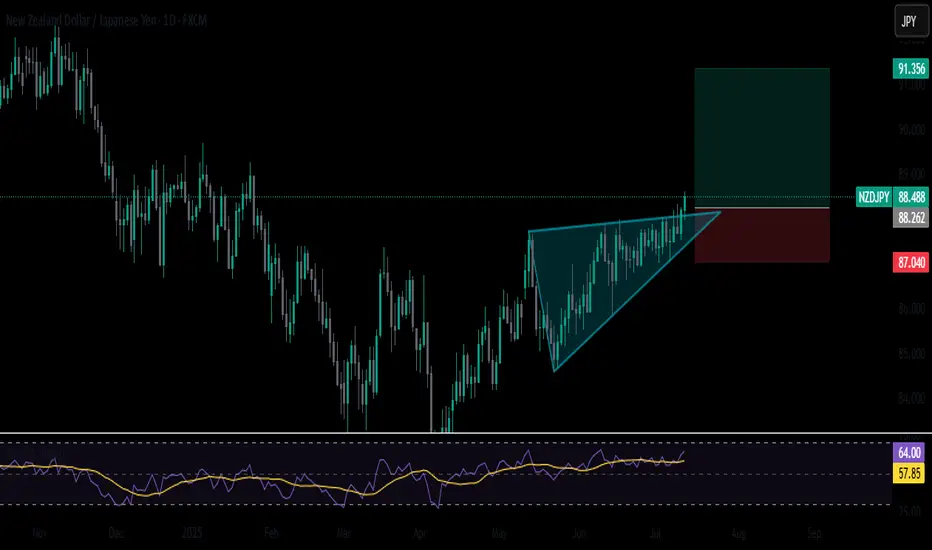
NZDJPY Breakout: Bulls take charge above key resistanceNZDJPY has broken out of a textbook ascending triangle on the daily time frame, signaling strong bullish momentum. Price is pushing higher with a solid structure and supportive RSI levels, leaving room for continuation. A breakout retest can offer a high-probability entry.
NZDJPY Bullish IdeaWaiting for an confirmation on our POI, to go longer.
NB: Trade should be executed only after confirmation of all of our criteria.
NZDJPY Long Setup: Institutional Flow Signals Upside to 89.690🗓 Seasonal Outlook
- JPY Seasonal Weakness: Historical trends show July and August tend to be bearish months for the Japanese Yen, reinforcing weakness across JPY pairs.
- NZD Seasonal Strength: July typically supports bullish momentum for NZD, while August may present challenges. However, strength in NZD versus relative JPY softness suggests continued upside potential into early August.
💼 Institutional Positioning (COT Analysis)
- JPY: Commercial traders remain net short, suggesting expectations of further depreciation.
- NZD: Also shows commercial net shorts, yet the price structure aligns more with bullish continuation, hinting at speculative flow favoring NZD upside.
🧠 Technical Analysis
- Liquidity Dynamics:
- Price has cleared multiple buy-side liquidity levels near prior swing highs.
- Sell-side zones continue to hold, indicating strong bullish intent and failed bearish follow-through.
- Market Structure:
- Higher lows and sustained bullish reactions post-liquidity sweeps reinforce an upward trajectory.
- Current structure suggests accumulation and breakout patterns toward the proposed target.
🎯 Target Projection: 89.690

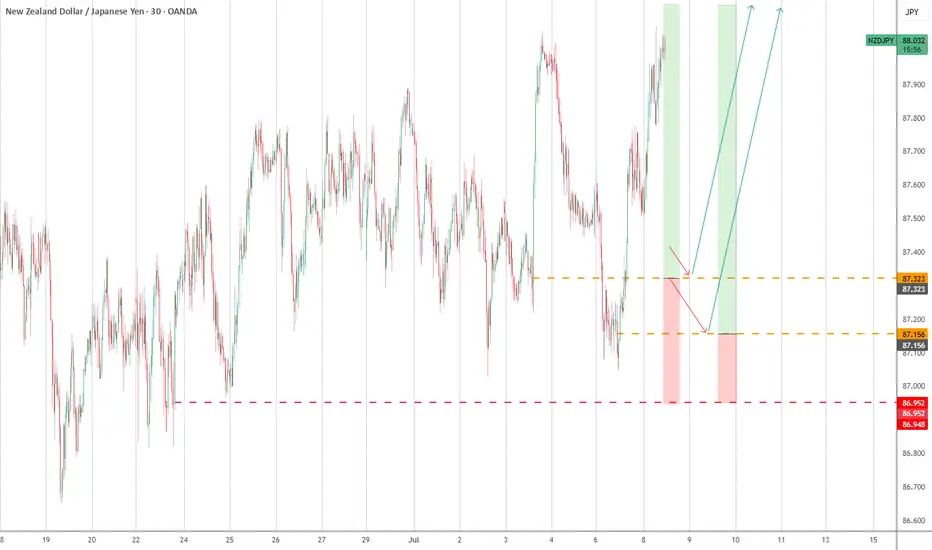
Lower time frame opportunity on nzdjpymeanwhile, while we wait for a pullback to the higher timeframe fib level for a vuy trade, we seem to be have a setup for a sell trade. to follow the market down towards our higher timeframe fib level.
if all turns out right, we can sell into our higher time frame fib level and then buy upward
lets see how the market unfolds

NZDJPY TRADE IDEANzdjpy also seems to be in an upward motion. lets see how it plays out, as we await a pullback to our fib level to the the trade to the upside.
its now a waiting game.
Trade can be taken and managed properly using the parameters shown in the image above.
please, this is no financial advice

nzdjpy📈 The trend is clearly bullish, with the week starting strong and Friday closing above the 22-period daily moving average.
Now it’s just a matter of waiting for a correction to enter at a more interesting price zone. Personally, I believe the price has a high probability of visiting the two marked areas — roughly a 75% and 60% chance, respectively.
If you're looking to manage a tighter stop-loss and aim for a risk-to-reward ratio around 1:5, this setup could be for you. 🔍
⚠️ Always remember: risk no more than 0.5% of your account per trade.
#NZDJPY #SwingTrade #Forex #RiskManagement #TradingView