NZDJPY: Bullish Outlook - Breakout From Contracting TriangleNZDJPY: Bullish Outlook - Breakout From Contracting Triangle
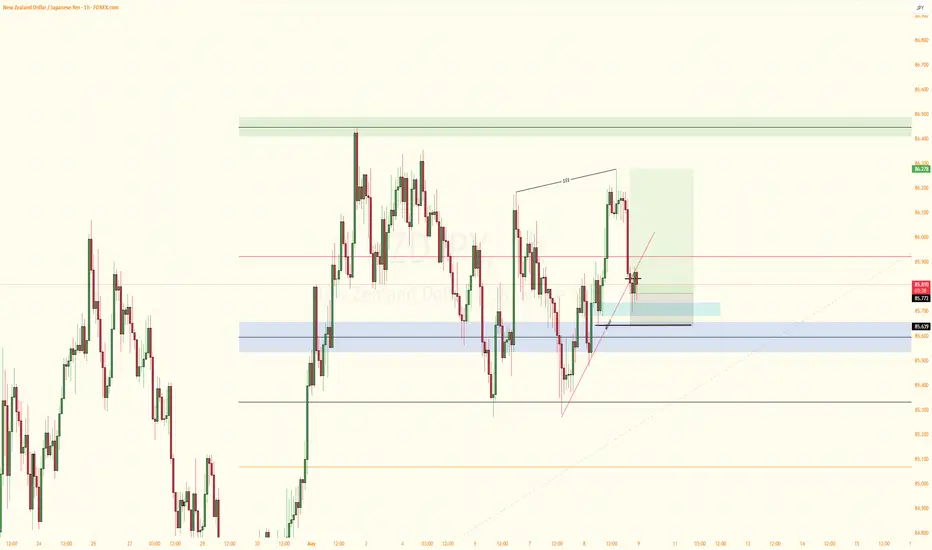
NZD/JPY has broken out of a strong contracting triangle pattern, signaling potential upward movement.
However, the price may take a short pause, possibly declining slightly for a brief correction before continuing its rise.
This move was triggered by a recent US-China tariff agreement, which is still fresh, meaning the market hasn't fully reacted. NZD/JPY could see further gains as the market absorbs the news.
Key levels to watch:
87.50 – A major technical zone
88.50 – Another key level near a larger structure
You may find more details in the chart!
Thank you and Good Luck!
❤️PS: Please support with a like or comment if you find this analysis useful for your trading day❤️
Disclosure: I am part of Trade Nation's Influencer program and receive a monthly fee for using their TradingView charts in my analysis.
NZDJPY trade ideas

NZDJPYLooking forward to go bearish nzdjpy
Price has been rejecting the area for sometime and price action is showing price willing to go down

NZDJPY to find sellers at current resistance?NZDJPY - 24h expiry
The primary trend remains bearish.
The rally has posted a correction count on the daily chart.
Price action looks to be forming a top.
Preferred trade is to sell into rallies.
Bespoke resistance is located at 85.95.
We look to Sell at 85.95 (stop at 86.20)
Our profit targets will be 85.05 and 84.85
Resistance: 86.10 / 86.40 / 86.70
Support: 85.30 / 85.00 / 84.80
Risk Disclaimer
The trade ideas beyond this page are for informational purposes only and do not constitute investment advice or a solicitation to trade. This information is provided by Signal Centre, a third-party unaffiliated with OANDA, and is intended for general circulation only. OANDA does not guarantee the accuracy of this information and assumes no responsibilities for the information provided by the third party. The information does not take into account the specific investment objectives, financial situation, or particular needs of any particular person. You should take into account your specific investment objectives, financial situation, and particular needs before making a commitment to trade, including seeking advice from an independent financial adviser regarding the suitability of the investment, under a separate engagement, as you deem fit.
You accept that you assume all risks in independently viewing the contents and selecting a chosen strategy.
Where the research is distributed in Singapore to a person who is not an Accredited Investor, Expert Investor or an Institutional Investor, Oanda Asia Pacific Pte Ltd (“OAP“) accepts legal responsibility for the contents of the report to such persons only to the extent required by law. Singapore customers should contact OAP at 6579 8289 for matters arising from, or in connection with, the information/research distributed.

Bearish drop?NZD/JPY is reacting off the pivot and could drop to the 1st support.
Pivot: 86.11
1st Support: 84.18
1st Resistance: 86.84
Risk Warning:
Trading Forex and CFDs carries a high level of risk to your capital and you should only trade with money you can afford to lose. Trading Forex and CFDs may not be suitable for all investors, so please ensure that you fully understand the risks involved and seek independent advice if necessary.
Disclaimer:
The above opinions given constitute general market commentary, and do not constitute the opinion or advice of IC Markets or any form of personal or investment advice.
Any opinions, news, research, analyses, prices, other information, or links to third-party sites contained on this website are provided on an "as-is" basis, are intended only to be informative, is not an advice nor a recommendation, nor research, or a record of our trading prices, or an offer of, or solicitation for a transaction in any financial instrument and thus should not be treated as such. The information provided does not involve any specific investment objectives, financial situation and needs of any specific person who may receive it. Please be aware, that past performance is not a reliable indicator of future performance and/or results. Past Performance or Forward-looking scenarios based upon the reasonable beliefs of the third-party provider are not a guarantee of future performance. Actual results may differ materially from those anticipated in forward-looking or past performance statements. IC Markets makes no representation or warranty and assumes no liability as to the accuracy or completeness of the information provided, nor any loss arising from any investment based on a recommendation, forecast or any information supplied by any third-party.

NZDJPY Expected Growth! BUY!
My dear friends,
Please, find my technical outlook for NZDJPY below:
The price is coiling around a solid key level - 85.539
Bias - Bullish
Technical Indicators: Pivot Points Low anticipates a potential price reversal.
Super trend shows a clear buy, giving a perfect indicators' convergence.
Goal - 85.760
About Used Indicators:
The pivot point itself is simply the average of the high, low and closing prices from the previous trading day.
Disclosure: I am part of Trade Nation's Influencer program and receive a monthly fee for using their TradingView charts in my analysis.
———————————
WISH YOU ALL LUCK

Current Analysis for NZDJPY This is my current analysis for NZDJPY. Overall bias is bullish, while price is gaining support at a major exhaustion zone, the bearish candle stick that can be seen to the left is just an impulsive move due to the timing of it's occurence.
NZD-JPY Free Signal! Sell!
Hello,Traders!
NZD-JPY gapped up on
The week's open and went
Further up, following other
Yen pairs, however, the upward
Move here was way less powerful
Than on the others and after the
Retest of the horizontal resistance
Of 87.2570 we are seeing significant
Weakness so we are assuming a
Correction is coming which means
We can enter a short trade with
The Take Profit of 86.399 and
The Stop Loss of 87.436
Sell!
Comment and subscribe to help us grow!
Check out other forecasts below too!
Disclosure: I am part of Trade Nation's Influencer program and receive a monthly fee for using their TradingView charts in my analysis.

(Ultimate Re-Entry) NZD JPY #0016 Short Swing Trade- Its late at night, I am a bit tired to explain in detailed.
- I will write in the note tomorrow morning local time.

BEARISH TREND IN NZDJPYA bearish trend in the NZD JPY currency, taking my trade using RIB tool and booking my profit.

Bearish drop?NZD/JPY is reacting off the resistance level which is a pullback resistance and could potentially drop from this level to our take profit.
Entry: 86.13
Why we like it:
There is a pullback resistance level.
Stop loss: 87.27
Why we like it:
There is a pullback resistance level that lines up with the 78.6% Fibonacci projection.
Take profit: 85.10
Why we like it:
There is an overlap support level that aligns with the 61.8% Fibonacci retracement.
Enjoying your TradingView experience? Review us!
Please be advised that the information presented on TradingView is provided to Vantage (‘Vantage Global Limited’, ‘we’) by a third-party provider (‘Everest Fortune Group’). Please be reminded that you are solely responsible for the trading decisions on your account. There is a very high degree of risk involved in trading. Any information and/or content is intended entirely for research, educational and informational purposes only and does not constitute investment or consultation advice or investment strategy. The information is not tailored to the investment needs of any specific person and therefore does not involve a consideration of any of the investment objectives, financial situation or needs of any viewer that may receive it. Kindly also note that past performance is not a reliable indicator of future results. Actual results may differ materially from those anticipated in forward-looking or past performance statements. We assume no liability as to the accuracy or completeness of any of the information and/or content provided herein and the Company cannot be held responsible for any omission, mistake nor for any loss or damage including without limitation to any loss of profit which may arise from reliance on any information supplied by Everest Fortune Group.

NZDJPY BULLISH OR BEARISH DETAILED ANALYSIS ??NZDJPY has successfully completed a bullish breakout from the descending channel structure that has been forming since mid-2024. The price action respected the trend boundaries flawlessly, and the breakout above the upper trendline confirms a reversal from the previous downtrend. Now trading around 86.200, this pair is showing strong momentum, supported by both technical breakout validation and fresh bullish sentiment in the market.
The pair is now targeting a measured move towards 93.000 in the coming weeks. The breakout is supported by increasing risk appetite across markets, as investors shift from safe-haven currencies like the Japanese Yen toward riskier assets such as the New Zealand Dollar. The sharp rejection from the lower trendline and the steady climb through April and early May marks the beginning of a potential bullish cycle. Traders should watch for retests and bullish continuation patterns to ride this wave.
Fundamentally, the New Zealand economy is seeing upward momentum with recent improvements in dairy exports and a surprise drop in unemployment to 3.8%, beating expectations. On the other hand, Japan’s stagnant inflation data and dovish Bank of Japan stance have weakened the Yen further. The widening interest rate differential between the Reserve Bank of New Zealand and the Bank of Japan continues to favor the Kiwi. This macro backdrop aligns with the technical breakout, offering additional conviction to bullish traders.
With technicals and fundamentals now in alignment, NZDJPY offers a high-probability long setup. Breakout traders and trend followers should consider riding this move toward the 93.000 target, with trailing stops to lock in profits as momentum continues. Keep an eye on global risk sentiment, commodity prices, and upcoming economic data from New Zealand for confirmation along the way.

NZD_JPY WILL GO UP|LONG|
✅NZD_JPY keeps growing and
The pair made a bullish
Breakout of the falling
Resistance then made a
Local pullback so we are
Bullish biased and we will
Be expecting a further
Bullish continuation
And a move up
LONG🚀
✅Like and subscribe to never miss a new idea!✅
Disclosure: I am part of Trade Nation's Influencer program and receive a monthly fee for using their TradingView charts in my analysis.

NZDJPY 39-Year Trap – 5149 Pips Short Setup!This chart showcases a massive 39-year consolidation range in NZDJPY, spanning from 1986 to 2025, with no confirmed breakout or breakdown throughout this entire period. The pair remains range-bound, signaling long-term indecision.
Currently, we are preparing for short-side trades based on a key technical clue:
The latest monthly candle wicked above resistance, sweeping liquidity before closing lower — a classic liquidity grab or false breakout setup, indicating a potential reversal within the range.
Trade Plan:
Entry 1: 89.364
Entry 2 (Add more lots if price rises): 93.351
Stop Loss for both entries: 95.967
Our targets remain:
Take Profit 1: 70.220
Take Profit 2: 42.516
This setup is aiming for a 5,149 pip move (~55% drop), aligned with the historical range-bound behavior.

NZDJPY: Short Signal with Entry/SL/TP
NZDJPY
- Classic bearish formation
- Our team expects fall
SUGGESTED TRADE:
Swing Trade
Sell NZDJPY
Entry Level - 85.689
Sl - 86.057
Tp - 85.033
Our Risk - 1%
Start protection of your profits from lower levels
Disclosure: I am part of Trade Nation's Influencer program and receive a monthly fee for using their TradingView charts in my analysis.
❤️ Please, support our work with like & comment! ❤️

NZDJPY What Next? BUY!
My dear subscribers,
NZDJPY looks like it will make a good move, and here are the details:
The market is trading on 84.472 pivot level.
Bias - Bullish
Technical Indicators: Both Super Trend & Pivot HL indicate a highly probable Bullish continuation.
Target - 84.990
About Used Indicators:
The average true range (ATR) plays an important role in 'Supertrend' as the indicator uses ATR to calculate its value. The ATR indicator signals the degree of price volatility.
Disclosure: I am part of Trade Nation's Influencer program and receive a monthly fee for using their TradingView charts in my analysis.
———————————
WISH YOU ALL LUCK

NZDJPY LONG
[ OANDA:NZDJPY ] is approaching the key resistance zone at AND . I'm watching closely for a valid reaction before considering any position.
** If the level breaks and price retests it successfully, I may consider a counter-directional setup.

NZDJPY DETAILED ANALYSIS TECHNICAL AND FUNDAMENTALS NZDJPY is currently trading near 85.80, forming a textbook falling wedge pattern on the daily chart. This structure typically signals a bullish reversal, and price action is nearing the apex, suggesting an imminent breakout. A confirmed breakout above the upper trendline could initiate a strong bullish wave, with a medium-term target set at 95.000.
Fundamentally, the New Zealand dollar is supported by expectations of stable monetary policy from the Reserve Bank of New Zealand, while the Japanese yen faces pressure due to the Bank of Japan's continued dovish stance. This divergence in monetary policies favors NZD strength against JPY, aligning with the bullish technical setup.
Technical indicators, including the Relative Strength Index (RSI) and Moving Average Convergence Divergence (MACD), are showing signs of bullish momentum. A decisive close above the wedge's resistance line would confirm the breakout, potentially attracting further buying interest and accelerating the move toward the 95.000 target.
In summary, NZDJPY is poised for a bullish breakout from the falling wedge pattern, supported by both technical and fundamental factors. Traders should monitor for a confirmed breakout and consider positioning accordingly to capitalize on the anticipated upward movement.

NZDJPY – Sell Limit Setup (Medium-Term Swing)Trade Summary
Type: Sell Limit
Entry: 85.29
Stop Loss: 86.97
Target: 79.82
Risk/Reward Ratio: ~3.4:1
Duration: Medium-Term Swing
Technical View
The broader trend remains bearish, with price consistently making lower highs.
NZDJPY rejected the downtrend resistance line, confirming continued seller control.
Yesterday’s sharp sell-off adds weight to the bearish view, and today’s mild bounce presents an opportunity to sell into strength.
Targeting a return to the reaction low at 79.82, last seen in early April.
Seasonal Insight
From April 29 – May 19, NZDJPY has declined in 57.14% of the past 36 years, with an average drop of 0.99%.
This seasonal tendency supports the short bias for the next few weeks.
Disclosure: I am part of Trade Nation's Influencer program and receive a monthly fee for using their TradingView charts in my analysis.

NZDJPY to find sellers at previous resistance?NZDJPY - 24h expiry
The primary trend remains bearish.
The rally is close to a correction count on the daily chart.
We look for a temporary move higher.
Preferred trade is to sell into rallies.
Bespoke resistance is located at 84.95.
We look to Sell at 84.95 (stop at 85.25)
Our profit targets will be 83.75 and 83.50
Resistance: 85.00 / 85.50 / 86.20
Support: 84.10 / 83.70 / 83.20
Risk Disclaimer
The trade ideas beyond this page are for informational purposes only and do not constitute investment advice or a solicitation to trade. This information is provided by Signal Centre, a third-party unaffiliated with OANDA, and is intended for general circulation only. OANDA does not guarantee the accuracy of this information and assumes no responsibilities for the information provided by the third party. The information does not take into account the specific investment objectives, financial situation, or particular needs of any particular person. You should take into account your specific investment objectives, financial situation, and particular needs before making a commitment to trade, including seeking advice from an independent financial adviser regarding the suitability of the investment, under a separate engagement, as you deem fit.
You accept that you assume all risks in independently viewing the contents and selecting a chosen strategy.
Where the research is distributed in Singapore to a person who is not an Accredited Investor, Expert Investor or an Institutional Investor, Oanda Asia Pacific Pte Ltd (“OAP“) accepts legal responsibility for the contents of the report to such persons only to the extent required by law. Singapore customers should contact OAP at 6579 8289 for matters arising from, or in connection with, the information/research distributed.

NZDJPY sell setup H1Hello! Friends,
Greetings. Please leave a Like if you like the idea.
Before start talking about technical Let's share your LOVE by giving me LIKES to support this work. Thanks in advance.

liquidity areasAOL/AOH price will look to sweep the marked liquidity areas before targeting either AOL/AOH

NZD/JPY For Bullishwait for pull-back near by entry point and then go long
general trend is up trend
have fun :)

NZDJPY price action trading n a weekly timeframe, the market revisited a previously tested zone. On the 1-hour chart, it broke out of this zone, and on the 15-minute chart, a backtest of the breakout level is currently occurring. Based on this setup, I’m planning to enter a trade.
Trade Plan:
Take Profit (TP): Targeting the last swing high.
Stop Loss (SL): Placing it below the last resistance level.
Risk-Reward Ratio (RR): Aiming for a minimum of 1:3.
This setup offers a high-probability trade with a favorable risk-reward ratio, capitalizing on the breakout and backtest confirmation.
