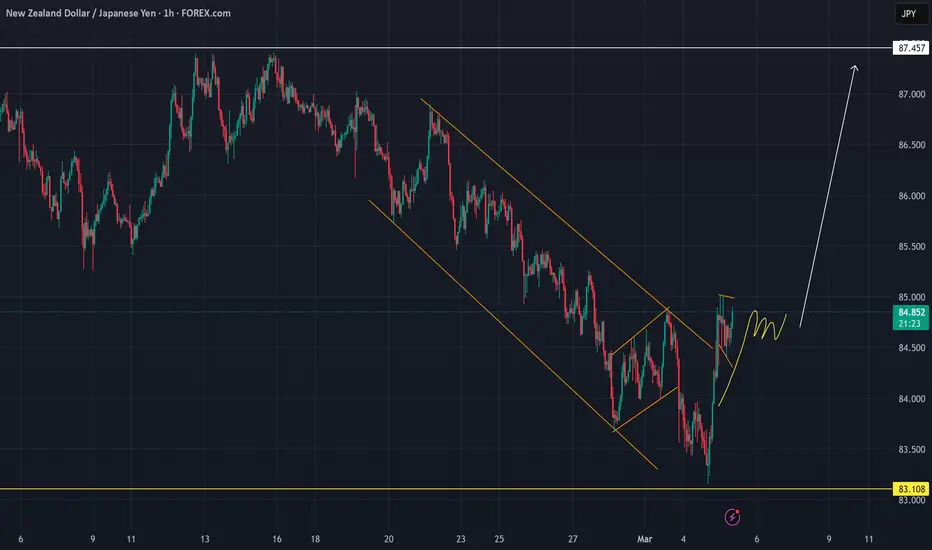
POTENTIAL LONG TRADE SET UP FOR NZDJPYAnalysis: Utilizing chart patterns, highs & lows, and impulses & corrections, the focus is on identifying a continuation corrective structure following a breakout.
The price has approached a previous swing low zone on the higher time frame (HTF) while moving within a descending structure on the MTF. The price has broken out of the MTF descending structure and we will now monitor for a continuation structure to identify a potential entry point for the trade.
Expectation: A upward move is expected.
⚠️ Reminder: Always conduct your own analysis and apply proper risk management, as forex trading involves no guarantees. This is a high-risk activity, and past performance is not indicative of future results. Trade responsibly!
NZDJPY trade ideas
Heading into resistance?NZD/JPY is rising towards the pivot and could reverse to the 1st support.
Pivot: 85.23
1st Support: 83.78
1st Resistance: 85.70
Risk Warning:
Trading Forex and CFDs carries a high level of risk to your capital and you should only trade with money you can afford to lose. Trading Forex and CFDs may not be suitable for all investors, so please ensure that you fully understand the risks involved and seek independent advice if necessary.
Disclaimer:
The above opinions given constitute general market commentary, and do not constitute the opinion or advice of IC Markets or any form of personal or investment advice.
Any opinions, news, research, analyses, prices, other information, or links to third-party sites contained on this website are provided on an "as-is" basis, are intended only to be informative, is not an advice nor a recommendation, nor research, or a record of our trading prices, or an offer of, or solicitation for a transaction in any financial instrument and thus should not be treated as such. The information provided does not involve any specific investment objectives, financial situation and needs of any specific person who may receive it. Please be aware, that past performance is not a reliable indicator of future performance and/or results. Past Performance or Forward-looking scenarios based upon the reasonable beliefs of the third-party provider are not a guarantee of future performance. Actual results may differ materially from those anticipated in forward-looking or past performance statements. IC Markets makes no representation or warranty and assumes no liability as to the accuracy or completeness of the information provided, nor any loss arising from any investment based on a recommendation, forecast or any information supplied by any third-party.

NZDJPY Wave Analysis – 4 March 2025
- NZDJPY reversed from long-term support level 83.15
- Likely to rise to resistance level 85.00
NZDJPY currency pair today reversed up exactly from the long-term support level 83.15 (which stopped the sharp downtrend at the start of August of 2024 as can be seen below), standing near the lower daily Bollinger Band.
The upward reversal from this support zone will form the daily Japanese candlesticks reversal pattern Hammer – if the pair closes today near the current levels.
Given the proximity of the strong support level 83.15 and the oversold daily Stochastic, NZDJPY currency pair can be expected to rise to the next resistance level 85.00, former support from the start of February.


eurchf bullish idea, NZDJPY updateeurchf is seemingly gaining more bullish strength and I'm anticipating a retest of a head and shoulders on the 15min

NZD/JPY - Bulls are gearing up to push the price upHi guys ,we are looking into NZD/JPY today, a great follow up hence the price reached a very crucial Support Area, analysis made on 3H time frame.
The NZD/JPY currency pair is showing signs of potential bullish momentum, indicating that a price increase may be on the horizon.
Key Technical Indicators Suggest Upside Potential:
Support Levels Holding Strong: The pair has approached a key support zone, historically acting as a strong demand area where buyers tend to step in. This suggests a possible price reversal to the upside.
Oversold Conditions: Recent downward movements have pushed NZD/JPY into oversold territory on the RSI (Relative Strength Index), which often signals an upcoming reversal as traders look to capitalize on discounted prices.
Bullish Divergence: A divergence between price action and momentum indicators, such as the MACD or RSI, suggests that selling pressure may be weakening and a bullish move could be imminent.
Trendline Retest and Potential Breakout: The price is currently testing an important trendline, and a successful breakout above this level could signal a strong rally toward recent resistance zones.
Fundamental Factors Favoring NZD Strength:
Improving Risk Sentiment: As global market sentiment shifts toward risk-on assets, the New Zealand dollar (NZD) tends to benefit due to its correlation with commodity prices and risk appetite.
Interest Rate Differentials: If New Zealand maintains relatively higher interest rates compared to Japan’s ultra-loose monetary policy, the carry trade appeal for NZD/JPY remains strong, supporting long-term upside potential.
Entry: 84.550
Target 1: 85.450
Target 2: 86.200
SL: would be below the support area 83.300

In A Perfect WorldSimple as it can be it has moved nicely lower. I am seeking for a retracement back to and above the 50.0 on the fib, hit the NWOG and then reject it seeking 83.000

USDJPY update , NZDJPY weekly outlookafternoon this week I'll be bullish on uj and NJ these pairs are giving great confirmation and can look for buying opportunities throughout the week.

Buy NZDJPYPrice on the 1 Hr timeframe broke through the trendline with 2 strong bullish candles. It also bought with momentum off a liquidity zone with a triple bottom pattern forming a upward trendline

NZDJPY: Long Trading Opportunity
NZDJPY
- Classic bullish pattern
- Our team expects retracement
SUGGESTED TRADE:
Swing Trade
Buy NZDJPY
Entry - 84.379
Stop - 83.749
Take - 85.684
Our Risk - 1%
Start protection of your profits from lower levels
❤️ Please, support our work with like & comment! ❤️

slight bull tilt already. nzdjpy friday quant zonesslight bull tilt
Check out our socials for some nice insights.
Let us know if there're any pair you like to see or if this is something you like.
Do ask if you have any question
Not as refined as our direct trade setups. More for advanced active traders.
information created and published doesn't constitute investment advice!
NOT financial advice

Nzdjpy I posted this trade few days ago and this is how the trade is going lol I gave update be4 on it

NZDJPY Will Explode! BUY!
My dear subscribers,
My technical analysis for NZDJPY is below:
The price is coiling around a solid key level - 84.820
Bias - Bullish
Technical Indicators: Pivot Points High anticipates a potential price reversal.
Super trend shows a clear buy, giving a perfect indicators' convergence.
Goal - 85.665
My Stop Loss - 84.404
About Used Indicators:
By the very nature of the supertrend indicator, it offers firm support and resistance levels for traders to enter and exit trades. Additionally, it also provides signals for setting stop losses
———————————
WISH YOU ALL LUCK

NZDJPY Short There is a trend moving downward
There is no deviation on the RSI
A pullback to 0.6 fib warrants an entry

Nzdjpy Just decided to post de progress of the trade am holding I gv this few days ago and is milking

NZDJPY Wave Analysis – 26 February 2025
- NZDJPY broke key support level 85.00
- Likely to fall support level 84.00
NZDJPY currency pair recently broke the key support level 85.00 (which stopped the previous minor impulse wave i at the start of February).
The breakout of the support level 85.00 accelerated the minor impulse wave iii of the C-wave which belongs to the extended ABC correction (2) from November.
Given the strong daily downtrend, NZDJPY currency pair can be expected to extend the losses toward the next support level 84.00, the target price for the completion of the active C-wave.

Bearish drop?NZD/JPY is rising towards the pivot and could drop to the 1st support.
Pivot: 86.09
1st Support: 85.23
1st Resistance: 86.65
Risk Warning:
Trading Forex and CFDs carries a high level of risk to your capital and you should only trade with money you can afford to lose. Trading Forex and CFDs may not be suitable for all investors, so please ensure that you fully understand the risks involved and seek independent advice if necessary.
Disclaimer:
The above opinions given constitute general market commentary, and do not constitute the opinion or advice of IC Markets or any form of personal or investment advice.
Any opinions, news, research, analyses, prices, other information, or links to third-party sites contained on this website are provided on an "as-is" basis, are intended only to be informative, is not an advice nor a recommendation, nor research, or a record of our trading prices, or an offer of, or solicitation for a transaction in any financial instrument and thus should not be treated as such. The information provided does not involve any specific investment objectives, financial situation and needs of any specific person who may receive it. Please be aware, that past performance is not a reliable indicator of future performance and/or results. Past Performance or Forward-looking scenarios based upon the reasonable beliefs of the third-party provider are not a guarantee of future performance. Actual results may differ materially from those anticipated in forward-looking or past performance statements. IC Markets makes no representation or warranty and assumes no liability as to the accuracy or completeness of the information provided, nor any loss arising from any investment based on a recommendation, forecast or any information supplied by any third-party.


NZD_JPY LONG FROM SUPPORT|
✅NZD_JPY is going up now
But a strong resistance level is ahead at 85.400
Thus I am expecting a pullback
And a move down towards the target at 86.000
SHORT🔥
✅Like and subscribe to never miss a new idea!✅

NZD/JPY BULLISH BIAS RIGHT NOW| LONG
Hello, Friends!
We are going long on the NZD/JPY with the target of 88.496 level, because the pair is oversold and will soon hit the support line below. We deduced the oversold condition from the price being near to the lower BB band. However, we should use low risk here because the 1W TF is red and gives us a counter-signal.
✅LIKE AND COMMENT MY IDEAS✅

Will Japanese Yen get stronger?NZD/JPY - Price is above the SMA 30 CLOSE for the last 19 days. 12.2.2025 - 17.2.2025 price reject the last demand zone and fall more than 2% in range. Now price is in the newest demand zone. We can expect price move between the demand zone before falling to the lowest price of 5.8.2024 at 83.032.


NZDJPY Will Explode! BUY!
My dear subscribers,
My technical analysis for NZDJPY is below:
The price is coiling around a solid key level - 86.054
Bias - Bullish
Technical Indicators: Pivot Points Low anticipates a potential price reversal.
Super trend shows a clear buy, giving a perfect indicators' convergence.
Goal - 86.587
About Used Indicators:
By the very nature of the supertrend indicator, it offers firm support and resistance levels for traders to enter and exit trades. Additionally, it also provides signals for setting stop losses
———————————
WISH YOU ALL LUCK
