23.07.25 Morning ForecastPairs on Watch -
FX:GBPUSD
CAPITALCOM:DE40
FX:NZDUSD
A short overview of the instruments I am looking at for today, multi-timeframe analysis down to what I will be looking at for an entry. Enjoy!
NZDUSD trade ideas

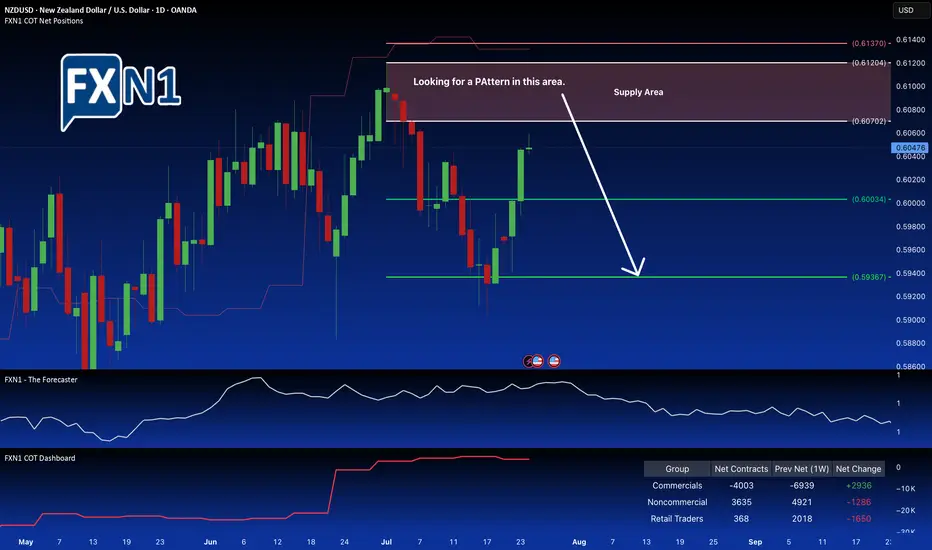
NZD/USD Weekly Bearish Trend Faces Critical Supply LevelThe NZD/USD pair is nearing a significant supply zone near 0.6070, where notable market activity is unfolding. Non-commercial traders are beginning to trim their holdings, signaling a potential shift in market sentiment. Conversely, commercial traders are at their lowest net positions since August 2024 and are starting to accumulate again, creating a divergence between these two groups.
This divergence, combined with the presence of a defined supply area and seasonal factors, suggests a possible reversal point in the current downtrend. On the weekly chart, the overall trend remains bearish, but the confluence of these technical and seasonal signals points toward a potential reversal pattern forming within the supply zone.
Traders may consider monitoring this area for signs of a reversal, potentially setting up for a short position if a clear pattern confirms the shift in momentum. Overall, the setup indicates a cautious opportunity for a bearish trade, provided the price action confirms the anticipated reversal.
✅ Please share your thoughts about NZD/USD in the comments section below and HIT LIKE if you appreciate my analysis. Don't forget to FOLLOW ME; you will help us a lot with this small contribution.
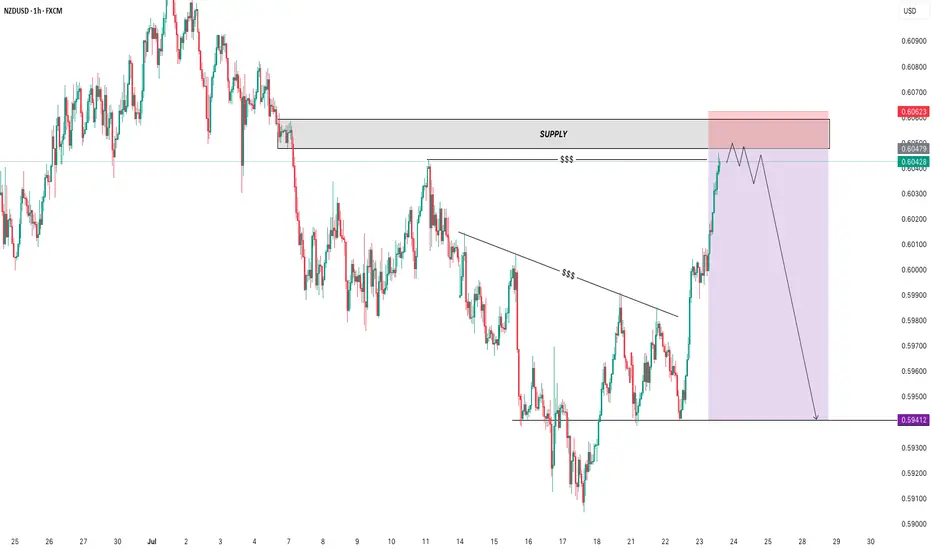
Lingrid | NZDUSD Potential Market Correction From ResistanceFX:NZDUSD has approached a key resistance zone at 0.6040 after completing an A-B-C upward move and forming a potential lower high. Price is testing both horizontal and trendline resistance, suggesting exhaustion within the broader upward move. A failure to hold above the 0.6040 area may trigger a reversal toward the 0.5991 support zone. The structure favors a bearish pullback if the breakout is rejected.
📉 Key Levels
Sell trigger: Rejection from 0.6045
Sell zone: 0.6035–0.6045
Target: 0.5991
Invalidation: Close above 0.6055
💡 Risks
Clean breakout above resistance zone
Strengthening NZD from risk sentiment shift
Holding above upward trendline support
If this idea resonates with you or you have your own opinion, traders, hit the comments. I’m excited to read your thoughts!

NZDUSD What Next? SELL!
My dear subscribers,
This is my opinion on the NZDUSD next move:
The instrument tests an important psychological level 0.6033
Bias - Bearish
Technical Indicators: Supper Trend gives a precise Bearish signal, while Pivot Point HL predicts price changes and potential reversals in the market.
Target - 0.5987
My Stop Loss - 0.6061
About Used Indicators:
On the subsequent day, trading above the pivot point is thought to indicate ongoing bullish sentiment, while trading below the pivot point indicates bearish sentiment.
Disclosure: I am part of Trade Nation's Influencer program and receive a monthly fee for using their TradingView charts in my analysis.
———————————
WISH YOU ALL LUCK

NZDUSD Potential UpsidesHey Traders, in today's trading session we are monitoring NZDUSD for a buying opportunity around 0.59800 zone, NZDUSD is trading in an uptrend and currently is in a correction phase in which it is approaching the trend at 0.59800 support and resistance area.
Trade safe, Joe.

SELL NZDUSD SELL NZDUSD , without negleting the power of barish movement in NZDUSD the market has managed to make a maium retst towards a POI with liquidty swap where i expect the market to tur into a very shapbearish movement
remember to manage ur trades , use proper risk management and good luck family
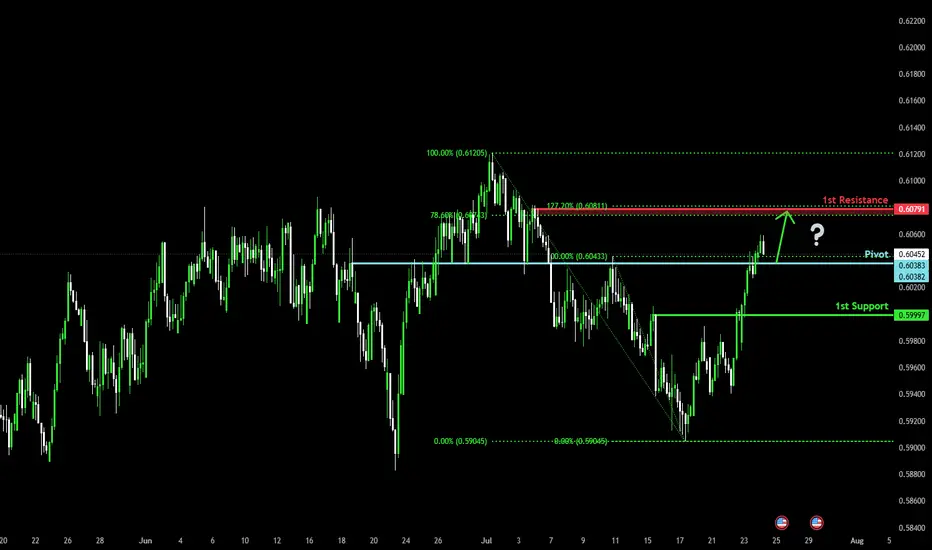
Bullish bounce for the Kiwi?The price is falling towards the pivot, which has been identified as an overlap support and could bounce to the 1st resistance, which acts as a pullback resistance.
Pivot: 0.6038
1st Support: 0.5999
1st Resistance: 0.6079
Risk Warning:
Trading Forex and CFDs carries a high level of risk to your capital and you should only trade with money you can afford to lose. Trading Forex and CFDs may not be suitable for all investors, so please ensure that you fully understand the risks involved and seek independent advice if necessary.
Disclaimer:
The above opinions given constitute general market commentary, and do not constitute the opinion or advice of IC Markets or any form of personal or investment advice.
Any opinions, news, research, analyses, prices, other information, or links to third-party sites contained on this website are provided on an "as-is" basis, are intended only to be informative, is not an advice nor a recommendation, nor research, or a record of our trading prices, or an offer of, or solicitation for a transaction in any financial instrument and thus should not be treated as such. The information provided does not involve any specific investment objectives, financial situation and needs of any specific person who may receive it. Please be aware, that past performance is not a reliable indicator of future performance and/or results. Past Performance or Forward-looking scenarios based upon the reasonable beliefs of the third-party provider are not a guarantee of future performance. Actual results may differ materially from those anticipated in forward-looking or past performance statements. IC Markets makes no representation or warranty and assumes no liability as to the accuracy or completeness of the information provided, nor any loss arising from any investment based on a recommendation, forecast or any information supplied by any third-party.
NZD/USD – A Bullish Opportunity You Shouldn't MissNZD/USD is showing a clear bullish structure across multiple timeframes:
Weekly: Overall trend remains bullish.
Daily: Structure flipped bullish on July 23, 2025, confirmed by a strong bullish engulfing candle.
4H: Also aligned bullish, adding further confluence.
We are now anticipating a retest near the previous Daily Higher Low (HL) — likely around a round psychological level. This zone may offer a textbook HL formation and a high-probability long setup.
📍 Potential Trade Plan
Entry: Around 0.6000
Take Profit: 0.6160
Stop Loss: 0.5960
⚠️ This is not financial advice. Please do your own research and analysis before entering any trade. I am not responsible for any potential losses.

NZDUSD: Time For Pullback 🇳🇿🇺🇸
I think that NZDUSD will retrace from the underlined resistance.
As a confirmation, I spotted a bearish imbalance candle on an hourly time frame
after its test.
There is a high chance to see a retracement.
Goal - 0.602
❤️Please, support my work with like, thank you!❤️

NZD/USD – 1H | Bearish Setup at Breakout of LL| AB=CD HarmonicsWe’re currently eyeing a bearish continuation on NZD/USD based on clear market structure and harmonic confirmation.
📉 Trend: Bearish
🔍 Divergence: Bearish
📐 Harmonics: AB=CD pattern
📊 Bias: Bearish
🧠 Technical Breakdown
✅ Price has broken the previous Higher Low , confirming a structural shift.
✅ A Lower High is about to form — Now we’re waiting for the breakout of the previous Lower Low to confirm trend continuation.
✅ We’ve placed a Sell Stop below that Lower L ow, targeting bearish continuation.
✅ The AB=CD harmonic pattern shows potential for extended downside — reversal zone still far.
📌 Trade Setup
🔹 Entry: Sell Stop @ 0.59965 (breakout of Lower Low)
🔹 Stop Loss: 0.60614
🔹 Take Profit: 0.59316
🔹 Risk/Reward: 1:1
🔹 Lot Size: 0.38
🔹 Risk: $200
🔹 Reward: $200
⚠️ Note: This is a pending setup. Trade only triggers on the breakout of the previous Lower Low, keeping the bearish structure intact.
#NZDUSD #ForexSetup #BearishBreakout #LowerLow #PriceAction #SmartMoney #ABCDPattern
#HarmonicTrading #ForexStrategy #SellSetup #TradingView #FXMarket #ForexSignals
#DayTrading #SwingTrading #ChartAnalysis #TradeSmart #ForexTrader #RiskManagement
#ForexEducation #BearishStructure #FibonacciTrading #MarketStructure #BreakoutTrade
#TradersOfInstagram #TradersOfTradingView #CryptoAndForex

NZDUSD Sell Stop SetupNZDUSD is in a clear downtrend, forming lower highs and lower lows. A sell stop is placed below the recent support to confirm bearish continuation.
Sell Stop: 0.59
Stop Loss (SL): 0.60
Take Profit 1 (TP1): 0.58
Take Profit 2 (TP2): 0.57
Waiting for price activation to validate the setup.

NZD/USD 1-Target 0.59900 2- Target 0.59328Monday's target no. 1, then target no. 2, meaning continued weakening of the NZD against the USD.
Tools:
- real volume (proper interpretation)
- Fibonacci expansion ABC
- Fibonacci retracement
- volume support and resistance levels
- oversold/overbought index
- candlestick patterns

NZDUSD Bearish towards .5925!1). Wave 5 drop needs a completion lower! 2). Risk is selling off! 3). Volume is falling! 4). Price appears to be heading towards lower market sentiment! 5). Trump is imposing more Tariffs, which is likely causing deeper corrections!

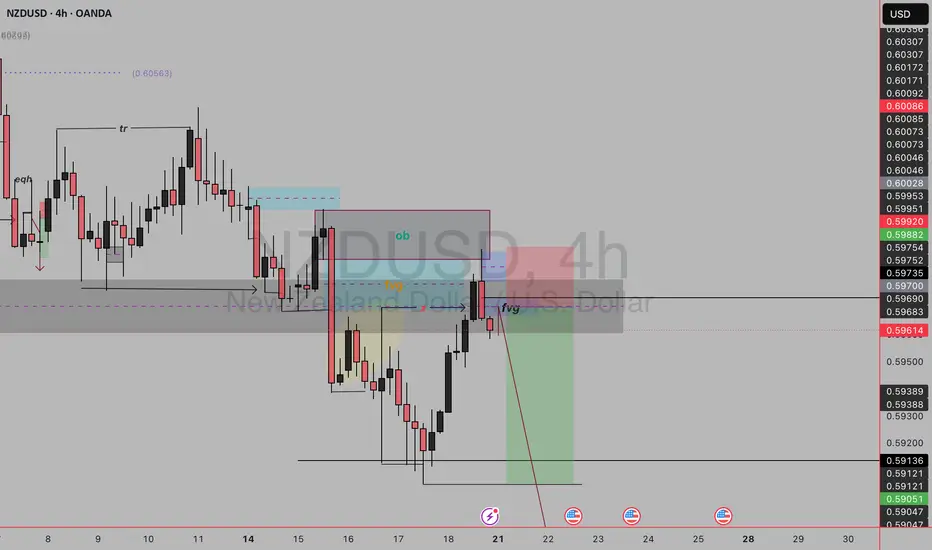
NZDUSD SELL SETUP✅Market Structure: Bearish.
Clear lower highs and lower lows.
Price retraced into a premium zone after the last strong sell-off.
✅Key Elements in the Setup
1.OB (Order Block) – Blue zone:
This is the last bullish candle before a strong bearish move.
Acts as a supply zone.
Price tapped into it before reacting.
2.FVG (Fair Value Gap) – Highlighted (yellow & blue):
Imbalance in price action (inefficient movement).
You marked this as confluence — price filled the FVG and rejected.
3.Liquidity Grab (EQH):
Equal highs were taken out — classic liquidity sweep.
This hints at a manipulation before the real move.
✅Entry Trigger:
Price pushed into the OB + FVG zone.
Rejection candle + break of structure on the lower timeframe.
You entered after that shift.
✅Trade Components
Entry: After price rejects OB + FVG area.
Stop Loss: Above OB and liquidity sweep (~0.60086).
Take Profit: Into previous low (~0.59047) or a bit lower for extended target.
Risk:Reward: Very healthy, above 1:4.
✅ Confluences Supporting the Sell
Premium pricing (above 50% of swing range).
Price filled FVG + tapped OB.
Liquidity above EQH taken.
Sharp rejection from that zone.
FVG left behind on the way down = price likely to seek lower inefficiencies.
NZDUSD SHORT SELLING # NZDUSD SHORT SELLING
Market IN monthly SIBI in Daily TF MSS , in Daily SIBI Going to LTF after Valid MSS with Run on Stop either Engage dose not Matter . entry with Tight SL and LONG Target Open
NZDUSD Faces Further Downside Amid Renewed Tariff ConcernsNZDUSD Faces Further Downside Amid Renewed Tariff Concerns
In July, NZDUSD created a false breakout after printing a new higher high.
Initially, the pair appeared set for further gains, but the U.S. dollar regained strength following stronger-than-expected Non-Farm Payrolls (NFP) data.
Today, market sentiment remains fragile as anticipation builds around President Trump's upcoming remarks on tariffs.
Our analysis suggests that the broader outlook remains unchanged—NZDUSD is still positioned for further downside.
You may find more details in the chart!
Thank you and Good Luck!
❤️PS: Please support with a like or comment if you find this analysis useful for your trading day❤️
Disclosure: I am part of Trade Nation's Influencer program and receive a monthly fee for using their TradingView charts in my analysis.

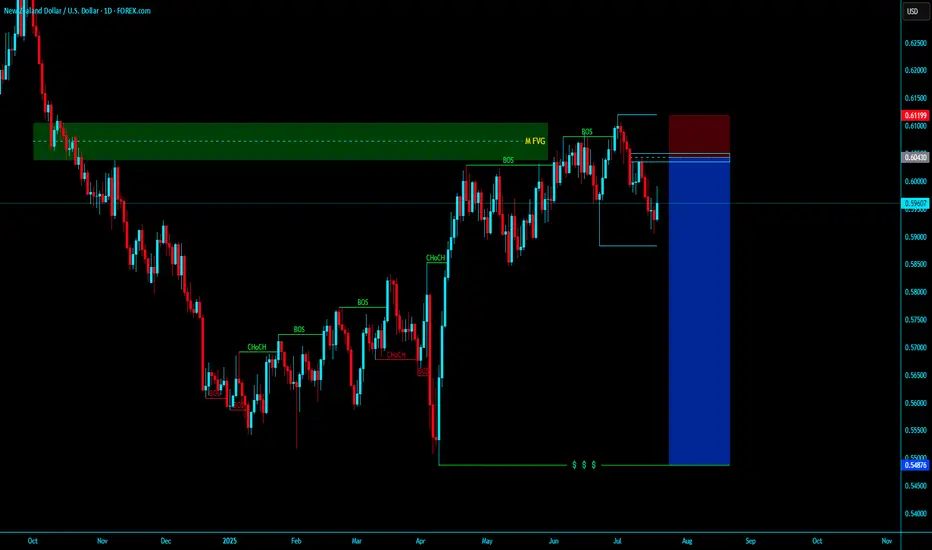
NZDUSD - Elliott Wave: High-Probability Reversal Zone Ahead!NZDUSD – Elliott Wave Roadmap
3Day Chart
Every move has been unfolding with precision — true to Elliott Wave Theory.
We're in the final leg of a massive A-B-C correction:
- Wave A and the complex Wave B (WXY) are complete.
- Wave C is now in play, targeting the highs of Wave A.
We’ve just seen a clean 5-wave advance (wave 1 leading diagonal).
Now expecting a classic ABC correction for wave 2, into our reversal zone (38.2–61.8% Fib).
🔍 Once price enters this zone, we’ll drop to lower timeframes and:
- Look for bullish confirmations (BOS, trendline break)
- Set entries with stops below corrective lows
- Targets: 0.63 (500 pips) and 0.65 (700 pips)
📌 Why is the buy zone so big?
It’s a higher timeframe zone. Once price enters, we zoom into lower timeframes for precise entries. The zone simply tells us when to focus, not where to blindly buy.
This is the Wave 3 generation point — and that’s where the real move begins.
Plan your trade. Watch for the setup. Execute with confidence.
Goodluck and as always, Trade Safe!
NZDUSD 12H Chart - Looking for this ABC correction for wave 2

Market Analysis: NZD/USD Climbs as Dollar WeakensMarket Analysis: NZD/USD Climbs as Dollar Weakens
NZD/USD is also rising and might aim for more gains above 0.6000.
Important Takeaways for NZD/USD Analysis Today
- NZD/USD is consolidating gains above the 0.5980 zone.
- There was a break above a major bearish trend line with resistance at 0.5980 on the hourly chart of NZD/USD.
NZD/USD Technical Analysis
On the hourly chart of NZD/USD at FXOpen, the pair started a steady increase from the 0.5910 zone. The New Zealand Dollar broke the 0.5940 resistance to start the recent increase against the US Dollar.
There was a break above a major bearish trend line with resistance at 0.5980. The pair settled above 0.5980 and the 50-hour simple moving average. It tested the 0.6010 zone and is currently consolidating gains.
The NZD/USD chart suggests that the RSI is stable above 60. On the upside, the pair might struggle near 0.6010. The next major resistance is near the 0.6020 level.
A clear move above the 0.6020 level might even push the pair toward the 0.6050 level. Any more gains might clear the path for a move toward the 0.6120 resistance zone in the coming days.
On the downside, immediate support is near the 0.5990 level. It is close to the 23.6% Fib retracement level of the upward move from the 0.5941 swing low to the 0.6008 high.
The first key support is near the 0.5975 level. It is close to the 50% Fib retracement level. The next major support is near the 0.5940 level. If there is a downside break below the 0.5940 support, the pair might slide toward 0.5910. Any more losses could lead NZD/USD in a bearish zone to 0.5850.
This article represents the opinion of the Companies operating under the FXOpen brand only. It is not to be construed as an offer, solicitation, or recommendation with respect to products and services provided by the Companies operating under the FXOpen brand, nor is it to be considered financial advice.

SELL NZDUSDIn todays session we are actively monitoring NZDUSD for selling opportunity. Our first entry in ASIA session is at 0.60478 we anticipate a short rally up to our second re-entry at 0.60750. Our stops are above 0.6100 and our targets are at 0.59540. Use your own risk management and entry criteria and best of luck.
New algo entry model is under testing.

NZDUSD Massive Bullish Breakout!
HI,Traders !
#NZDUSD is trading in a strong
Uptrend and the price just
Made a massive bullish
Breakout of the falling
Resistance line and the
Breakout is confirmed
So after a potential pullback
We will be expecting a
Further bullish continuation !
Comment and subscribe to help us grow !

NZDUSD TRADE SETUPWait for retest the entry level and bearish momentum then take a trade for Sell otherwise skip this setup

NZDUSD: Free Trading Signal
NZDUSD
- Classic bullish setup
- Our team expects bullish continuation
SUGGESTED TRADE:
Swing Trade
Long NZDUSD
Entry Point - 0.6013
Stop Loss - 0.6004
Take Profit - 0.6028
Our Risk - 1%
Start protection of your profits from lower levels
Disclosure: I am part of Trade Nation's Influencer program and receive a monthly fee for using their TradingView charts in my analysis.
❤️ Please, support our work with like & comment! ❤️

nzdusd long tradein my opinion this is a good trade with a good r/r
hope it will hit the target
consider this is my trade not your trade
i just like to share my trades with world
