NZD/USD..4h chart pattern..NZD/USD sell position. Here's a structured breakdown of my trade setup and some considerations:
---
🟡 Current Trade Details
Position: Short (Sell)
Entry: 0.60400
Resistance (Stop loss area): 0.60600
Targets:
🎯 TP1: 0.59600
🎯 TP2: 0.58950
🎯 TP3: 0.58450
---
📊 Trade Analysis
🔻 Bearish Bias Confirmation
Resistance at 0.60600 aligns as a stop loss area; any strong close above it may invalidate the short.
Gradual lower target zones suggest you're trading a trend continuation or bearish breakout setup.
🧮 Risk-to-Reward (R:R) Overview
Assuming a stop loss just above resistance (~0.60650):
Target Reward (pips) Risk (pips) R:R Ratio
0.59600 80 25 3.2:1
0.58950 145 25 5.8:1
0.58450 195 25 7.8:1
Great potential if trend continuation plays out.
---
🧠 Key Considerations
Short-term support near 0.5980–0.5960 could see some consolidation or bounce.
Market catalysts: Watch out for any economic events from NZ or US (e.g., Fed decisions, jobs data).
Momentum check: Is the current price action aligned with the broader downtrend (e.g., 4H/Daily chart)?
---
Would you like a technical chart analysis of NZD/USD or news insights to support your setup?
NZDUSD trade ideas

NZDUSD Potential UpsidesHey Traders, in today's trading we are monitoring NZDUSD for a buying opportunity around 0.59400 zone, NZDUSD is trading in an uptrend and currently is in a correction phase in which it is approaching the trend at 0.59400 support and resistance area.
Trade safe, Joe.

Lingrid | NZDUSD Uptrend Trend Continuation Trade FX:NZDUSD is trending within a clean upward channel, recently bouncing off the trendline near 0.60164. After consolidating in a narrow range, the pair is showing signs of upward continuation toward the 0.60890 resistance zone. A retest of the trendline followed by a bullish reaction could confirm the breakout move.
📈 Key Levels
Buy zone: 0.60160–0.60220
Buy trigger: breakout above 0.60400 with momentum
Target: 0.60890
Sell trigger: breakdown below 0.60100
💡 Risks
False breakout above 0.60400 may trap buyers
Close below trendline invalidates bullish structure
Range-bound price action may delay breakout follow-through
Traders, if you liked this idea or if you have your own opinion about it, write in the comments. I will be glad 👩💻

NZDUSD: Your Trading Plan For Today Explained 🇳🇿🇺🇸
NZDUSD is currently consolidating on a strong intraday/daily support.
To buy the pair with a confirmation, I suggest to focus on a double
bottom pattern on a 4H time frame.
Its neckline breakout and a 4H candle close above 0.6015
will provide a reliable bullish confirmation.
Goal will be 0.6035.
Alternatively, if the price sets a new lower low on a 4H,
this setup will become invalid.
❤️Please, support my work with like, thank you!❤️
I am part of Trade Nation's Influencer program and receive a monthly fee for using their TradingView charts in my analysis.

NZD/USD Trade IdeaThe NZD/USD pair appears to be forming an ascending triangle, a pattern that typically indicates increasing bullish momentum and buyer strength.
Should price break above the established resistance zone at 0.60300, I would wait for a confirmed retest of this area before considering a long position.
Potential take-profit targets are set at the next key resistance levels of 0.61215 and 0.63740, based on previous structure.

NZDUSD - Time to buyWhen the market opens and we have a clear longing opportunity to get long on NZDUSD
We have an inducement level to the left and already have a sign of strength to the upside.

NZDUSD SHORT!!!!!!!!!!!!!before going in this position, please check for being sure about your opinion about this Pair!!!

NZDUSD 4Hr. Wave 5 North Likely in progress towards .6075
1). Price has very likely completed wave C @ .5950! 2). Risk Assets are strong today on US$ weakness! 3). BANKS ARE BUYING! 4). Volume is increasing... 5). Trendline intersecting with target fib. level 72.8%. 6).US $ WEAKNESS AT THE MOMENT IS ALSO ADDING TO THE ANTICIPATED RISK ASSET UPWARD SCENARIO!

NZDUSDNZDUSD
Sell. Market execution. trade 1:2. riesgo 0.50%
We entered Sell because the market is respecting the sellers' zone.

nzdusd sell signal. Don't forget about stop-loss.
Write in the comments all your questions and instruments analysis of which you want to see.
Friends, push the like button, write a comment, and share with your mates - that would be the best THANK YOU.
P.S. I personally will open entry if the price will show it according to my strategy.
Always make your analysis before a trade

NZDUSD 2.06.2025NZDUSD
We see a horizontal level from above, which usually breaks through upwards.
In addition, ALL liquidity has been reached from below, and the remaining liquidity is above, and we are moving towards it.
Best regards EXACAVO
_____________________
Disclosure: I am part of Trade Nation's Influencer program and receive a monthly fee for using their TradingView charts in my analysis.

NZDUSD to find buyers around trend line support?NZDUSD - 24h expiry
Price action looks to be forming a bottom.
The primary trend remains bullish.
This is positive for sentiment and the uptrend has potential to return.
We look for a temporary move lower.
Further upside is expected although we prefer to buy into dips close to the 0.5975 level.
We look to Buy at 0.5975 (stop at 0.5940)
Our profit targets will be 0.6074 and 0.6220
Resistance: 0.6006 / 0.6080 / 0.6220
Support: 0.5955 / 0.5850 / 0.5775
Risk Disclaimer
The trade ideas beyond this page are for informational purposes only and do not constitute investment advice or a solicitation to trade. This information is provided by Signal Centre, a third-party unaffiliated with OANDA, and is intended for general circulation only. OANDA does not guarantee the accuracy of this information and assumes no responsibilities for the information provided by the third party. The information does not take into account the specific investment objectives, financial situation, or particular needs of any particular person. You should take into account your specific investment objectives, financial situation, and particular needs before making a commitment to trade, including seeking advice from an independent financial adviser regarding the suitability of the investment, under a separate engagement, as you deem fit.
You accept that you assume all risks in independently viewing the contents and selecting a chosen strategy.
Where the research is distributed in Singapore to a person who is not an Accredited Investor, Expert Investor or an Institutional Investor, Oanda Asia Pacific Pte Ltd (“OAP“) accepts legal responsibility for the contents of the report to such persons only to the extent required by law. Singapore customers should contact OAP at 6579 8289 for matters arising from, or in connection with, the information/research distributed.

Bullish bounce?NZD/USD is has bounced off the support level which is a pullback support and could rise from this level to our take profit.
Entry: 0.5931
Why we like it:
There is a pullback support level.
Stop loss: 0.5898
Why we like it:
There is a pullback support level.
Take profit: 0.6017
Why we like it:
There is a pullback resistance level.
Enjoying your TradingView experience? Review us!
Please be advised that the information presented on TradingView is provided to Vantage (‘Vantage Global Limited’, ‘we’) by a third-party provider (‘Everest Fortune Group’). Please be reminded that you are solely responsible for the trading decisions on your account. There is a very high degree of risk involved in trading. Any information and/or content is intended entirely for research, educational and informational purposes only and does not constitute investment or consultation advice or investment strategy. The information is not tailored to the investment needs of any specific person and therefore does not involve a consideration of any of the investment objectives, financial situation or needs of any viewer that may receive it. Kindly also note that past performance is not a reliable indicator of future results. Actual results may differ materially from those anticipated in forward-looking or past performance statements. We assume no liability as to the accuracy or completeness of any of the information and/or content provided herein and the Company cannot be held responsible for any omission, mistake nor for any loss or damage including without limitation to any loss of profit which may arise from reliance on any information supplied by Everest Fortune Group.

NZDUSD – Long Bias LiveNZDUSD – Long Bias Live
🟢 Entered long at market open
🎯 Target: 0.60305
⏳ Plan to hold ~3-5 days (usually much soon)
Price has been grinding lower into support near 0.5980–0.5990. After basing, I’m playing for a rally up to 0.60305 (red line). I’m already in this long—if you’d like to join, be prepared to hold through the next few sessions.
📝 Not financial advice—trade responsibly!
💡 All setups can be replayed on TradingView for confirmation.
#NZDUSD #Forex #SwingTrade #TradingView #MarketAnalysis

NZD/USD Buy Pullback Buy Setup
Entry Zone: 0.6000 – 0.6020
Retest of breakout + daily demand zone
Stop Loss: Below 0.5950 (ideally 0.5935 to avoid wickouts)
Target 1: 0.6150
Target 2: 0.6200
Target 3: (optional swing) 0.6500 if holding long-term
NZDUSD: Bearish Continuation & Short Trade
NZDUSD
- Classic bearish setup
- Our team expects bearish continuation
SUGGESTED TRADE:
Swing Trade
Short NZDUSD
Entry Point - 0.6018
Stop Loss - 0.6051
Take Profit - 0.5952
Our Risk - 1%
Start protection of your profits from lower levels
Disclosure: I am part of Trade Nation's Influencer program and receive a monthly fee for using their TradingView charts in my analysis.
❤️ Please, support our work with like & comment! ❤️

Bearish drop for Kiwi?The price is rising towards the resistance level which is a pullback resistance and could drop from this level to our take profit.
Entry: 0.6051
Why we like it:
There is a pullback resistance level.
Stop loss: 0.6078
Why we like it:
There is a pullback resistance level.
Take profit: 0.6007
Why we lik eit:
There is an overlap support level that aligns with the 78.6% Fibonacci retracement.
Enjoying your TradingView experience? Review us!
Please be advised that the information presented on TradingView is provided to Vantage (‘Vantage Global Limited’, ‘we’) by a third-party provider (‘Everest Fortune Group’). Please be reminded that you are solely responsible for the trading decisions on your account. There is a very high degree of risk involved in trading. Any information and/or content is intended entirely for research, educational and informational purposes only and does not constitute investment or consultation advice or investment strategy. The information is not tailored to the investment needs of any specific person and therefore does not involve a consideration of any of the investment objectives, financial situation or needs of any viewer that may receive it. Kindly also note that past performance is not a reliable indicator of future results. Actual results may differ materially from those anticipated in forward-looking or past performance statements. We assume no liability as to the accuracy or completeness of any of the information and/or content provided herein and the Company cannot be held responsible for any omission, mistake nor for any loss or damage including without limitation to any loss of profit which may arise from reliance on any information supplied by Everest Fortune Group.

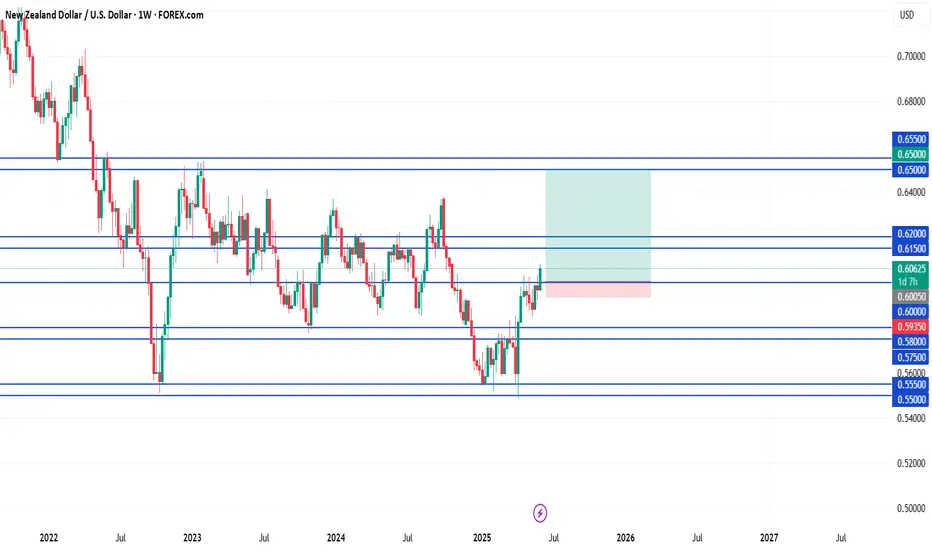
NZD/USD Registers Fresh Yearly HighNZD/USD breaks out of the range bound price action from earlier this week to register a fresh yearly high (0.6080).
Still need a close above 0.6070 (61.8% Fibonacci extension) to open up 0.6170 (50% Fibonacci extension), with the next area of interest coming in around 0.6230 (50% Fibonacci extension) to 0.6260 (38.2% Fibonacci extension).
At the same time, lack of momentum to close above 0.6070 (61.8% Fibonacci extension) may push NZD/USD back toward the weekly low (0.5961), with a break/close below the 0.5920 (61.8% Fibonacci extension) to 0.5930 (78.6% Fibonacci extension) region bringing the May low (0.5847) on the radar.
--- Written by David Song, Senior Strategist at FOREX.com

Kiwi H4 | Pullback support at 50% Fibonacci retracementThe Kiwi (NZD/USD) is falling towards a pullback support and could potentially bounce off this level to climb higher.
Buy entry is at 0.5987 which is a pullback support that aligns with the 50.0% Fibonacci retracement.
Stop loss is at 0.5915 which is a level that lies underneath a multi-swing-low support.
Take profit is at 0.6060 which is a resistance that aligns with the 127.2% Fibonacci extension.
High Risk Investment Warning
Trading Forex/CFDs on margin carries a high level of risk and may not be suitable for all investors. Leverage can work against you.
Stratos Markets Limited (tradu.com ):
CFDs are complex instruments and come with a high risk of losing money rapidly due to leverage. 63% of retail investor accounts lose money when trading CFDs with this provider. You should consider whether you understand how CFDs work and whether you can afford to take the high risk of losing your money.
Stratos Europe Ltd (tradu.com ):
CFDs are complex instruments and come with a high risk of losing money rapidly due to leverage. 63% of retail investor accounts lose money when trading CFDs with this provider. You should consider whether you understand how CFDs work and whether you can afford to take the high risk of losing your money.
Stratos Global LLC (tradu.com ):
Losses can exceed deposits.
Please be advised that the information presented on TradingView is provided to Tradu (‘Company’, ‘we’) by a third-party provider (‘TFA Global Pte Ltd’). Please be reminded that you are solely responsible for the trading decisions on your account. There is a very high degree of risk involved in trading. Any information and/or content is intended entirely for research, educational and informational purposes only and does not constitute investment or consultation advice or investment strategy. The information is not tailored to the investment needs of any specific person and therefore does not involve a consideration of any of the investment objectives, financial situation or needs of any viewer that may receive it. Kindly also note that past performance is not a reliable indicator of future results. Actual results may differ materially from those anticipated in forward-looking or past performance statements. We assume no liability as to the accuracy or completeness of any of the information and/or content provided herein and the Company cannot be held responsible for any omission, mistake nor for any loss or damage including without limitation to any loss of profit which may arise from reliance on any information supplied by TFA Global Pte Ltd.
The speaker(s) is neither an employee, agent nor representative of Tradu and is therefore acting independently. The opinions given are their own, constitute general market commentary, and do not constitute the opinion or advice of Tradu or any form of personal or investment advice. Tradu neither endorses nor guarantees offerings of third-party speakers, nor is Tradu responsible for the content, veracity or opinions of third-party speakers, presenters or participants.

NZD_USD RISKY SHORT FROM RESISTANCE|
✅NZD_USD has been growing recently
And the pair seems locally overbought
So as the pair is approaching a horizontal resistance of 0.6030
Price decline is to be expected
SHORT🔥
✅Like and subscribe to never miss a new idea!✅
Disclosure: I am part of Trade Nation's Influencer program and receive a monthly fee for using their TradingView charts in my analysis.

NZD/USD – Short-Term Bearish OutlookNZD/USD – Short-Term Bearish Outlook
Price action suggests a potential pullback in the short term.
If momentum holds, I’m eyeing a short position with a target at 0.59760.
💡 Clean setup, tight risk, and solid reward potential.
📉 Watching for confirmation to enter. Follow for more intraday setups!

NZDUSD: Move Up Ahead 🇳🇿🇺🇸
Thursday's and Friday's sessions were bullish on NZDUSD.
After a test of a rising trend line, the price formed
a double bottom pattern on a 4H time frame and violated its neckline.
I think that the pair may rise next week and reach at least 0.6 level.
❤️Please, support my work with like, thank you!❤️
I am part of Trade Nation's Influencer program and receive a monthly fee for using their TradingView charts in my analysis.

Bearish reversal off pullback resistance?The Kiwi (NZD/USD) is rising towards the pivot, which has been identified as a pullback resistance and could reverse to the 1st support, which is also a pullback support.
Pivot: 0.6024
1st Support: 0.5846
1st Resistance: 0.6131
Risk Warning:
Trading Forex and CFDs carries a high level of risk to your capital and you should only trade with money you can afford to lose. Trading Forex and CFDs may not be suitable for all investors, so please ensure that you fully understand the risks involved and seek independent advice if necessary.
Disclaimer:
The above opinions given constitute general market commentary, and do not constitute the opinion or advice of IC Markets or any form of personal or investment advice.
Any opinions, news, research, analyses, prices, other information, or links to third-party sites contained on this website are provided on an "as-is" basis, are intended only to be informative, is not an advice nor a recommendation, nor research, or a record of our trading prices, or an offer of, or solicitation for a transaction in any financial instrument and thus should not be treated as such. The information provided does not involve any specific investment objectives, financial situation and needs of any specific person who may receive it. Please be aware, that past performance is not a reliable indicator of future performance and/or results. Past Performance or Forward-looking scenarios based upon the reasonable beliefs of the third-party provider are not a guarantee of future performance. Actual results may differ materially from those anticipated in forward-looking or past performance statements. IC Markets makes no representation or warranty and assumes no liability as to the accuracy or completeness of the information provided, nor any loss arising from any investment based on a recommendation, forecast or any information supplied by any third-party.
