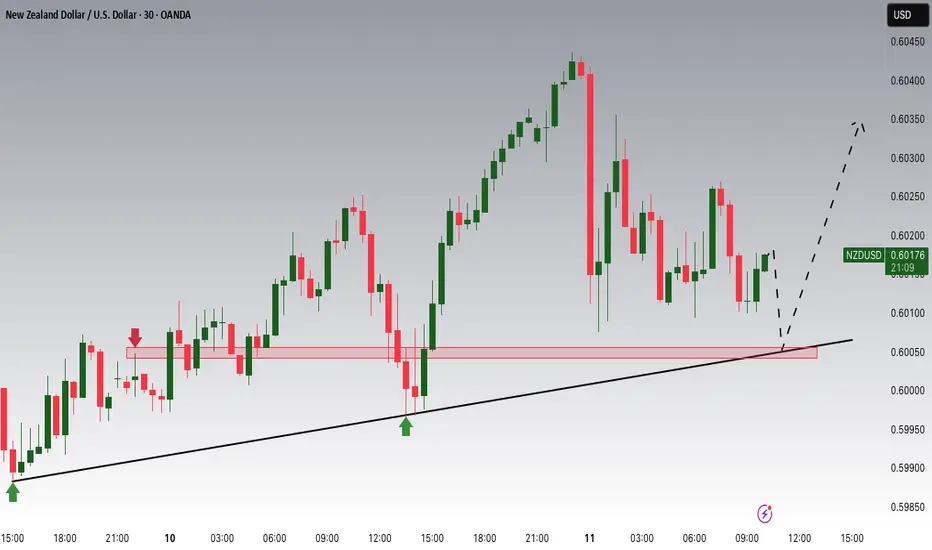
NZDUSD Potential UpsidesHey Traders, in today's trading session we are monitoring NZDUSD for a buying opportunity around 0.60000 zone, NZDUSD is trading in an uptrend and currently is in a correction phase in which it is approaching the trend at 0.60000 support and resistance area.
Trade safe, Joe.
NZDUSD trade ideas
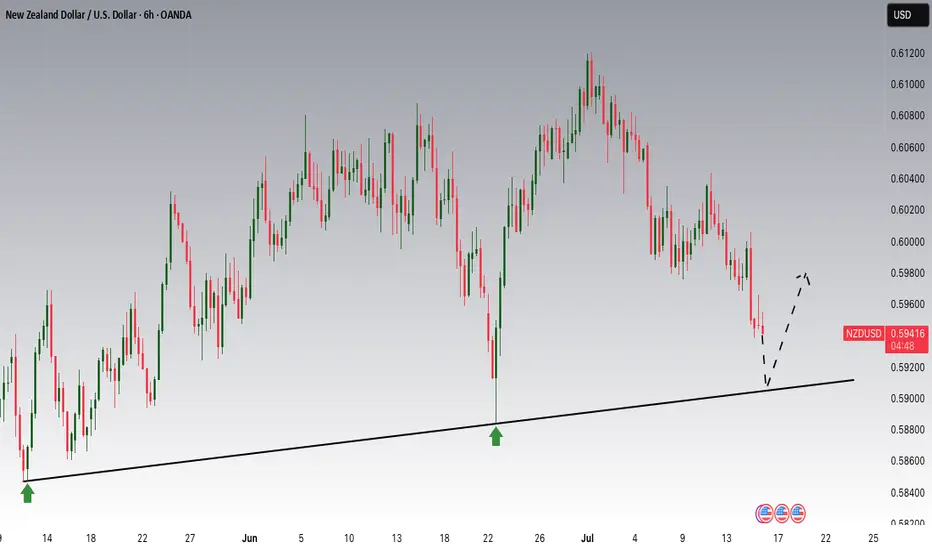
NZDUSD is Nearing an Important SupportHey Traders, in today's trading session we are monitoring NZDUSD for a buying opportunity around 0.59100 zone, NZDUSD is trading in an uptrend and currently is in a correction phase in which it is approaching the trend at 0.59100 support and resistance area.
Trade safe, Joe.
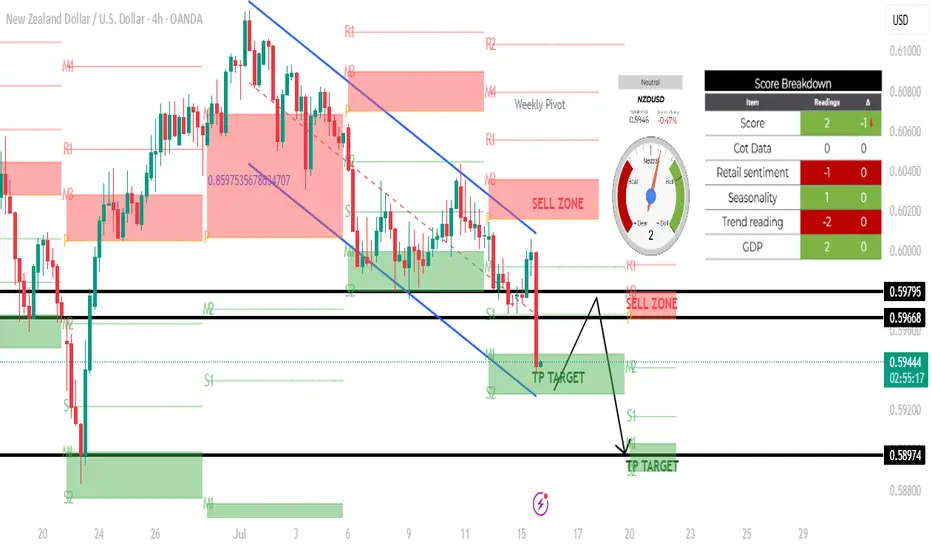
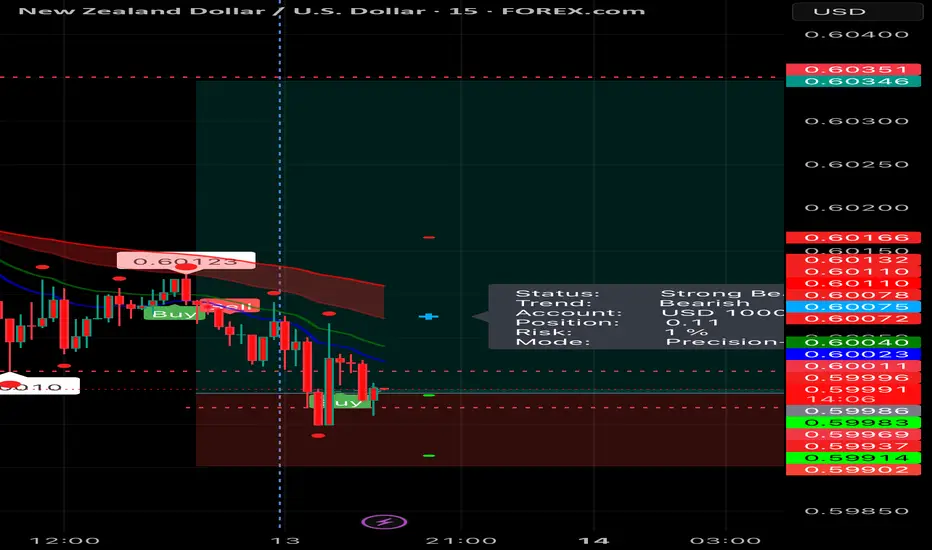
NZDUSD H4 SHORT SETUP: 15 JULY 2025Based on the 4-hour chart of NZD/USD, here's a technical analysis of the current setup:
\---
🕒 Timeframe: 4H
💱 Pair: NZD/USD
📉 Current Price: Around 0.59430
---
🔍 Chart Structure and Analysis:
🔻 Trend:
The market is in a clear downtrend, as indicated by the descending channel and the strong bearish candle that broke below the previous support zone.
Sellers are currently in control.
---
📍 Key Zones:
🔴 Sell Zones (Supply):
0.59668 – 0.59795: Marked as a supply/sell zone.
Price previously reacted here and dropped sharply. Expect selling pressure if price retests this zone.
---
🟢 Take Profit (TP) Targets / Demand Zones:
1. TP Target 1: Around 0.59430 – 0.59300 — Already hit; slight bounce seen.
2. TP Target 2: 0.58974 — This is the next key target/support zone, which aligns with a prior low.
---
🔁 Possible Scenarios:
✅ Scenario 1: Continuation Bearish
If price fails to break back above the 0.59668 resistance, it will likely:
Consolidate below,
Retest and reject again,
Then head lower toward 0.58974 (TP2).
⚠ Scenario 2: Short-Term Retracement
If there's a bounce (as seen by the current candle's wick), price may retest the sell zone at 0.59668–0.59795.
This could present another short entry opportunity with a target at 0.58974.
---
📊 Confluences:
Weekly Pivot + Structure Resistance near 0.59668: Strengthens the sell zone.
Strong Bearish Momentum Candle: Signals potential for continuation.
TP Zone overlaps with S2 level: Providing possible support/bounce area.
NZDUSD beating for a robust up move soon The coming weekdmight be a more volatile week for NZD, Stay put, I feel take out for long positions when you see the Opportunities.

NZDUSD Pullback in Play – Head & Shoulders Signals More DownsideNZDUSD ( OANDA:NZDUSD ) is currently trading near the Resistance zone($0.612-$0.605) and has also managed to break the Support zone($0.604-$0.602) . We consider the Support zone as the neckline of the Head and Shoulders Pattern .
In terms of classic technical analysis , NZDUSD has managed to form a Head and Shoulders Pattern .
I expect NZDUSD to decline towards the Support zone($0.5968-$0.5946) after completing the pullback .
Note: Stop Loss(SL): $0.6062
Please respect each other's ideas and express them politely if you agree or disagree.
New Zealand Dollar/ U.S. Dollar Analyze (NZDUSD), 1-hour time frame.
Be sure to follow the updated ideas.
Do not forget to put a Stop loss for your positions (For every position you want to open).
Please follow your strategy and updates; this is just my Idea, and I will gladly see your ideas in this post.
Please do not forget the ✅' like '✅ button 🙏😊 & Share it with your friends; thanks, and Trade safe.

NZD/USD H&S Reversal Pattern Clear,Short Setup To Get 150 Pips !Here is my opinion On NZD/USD On 4H T.F , If we checked the chart we will see that we have a very strong Historical res that forced the price many times to respect it and stay below it and now we have another good confirmation , we have a perfect reversal pattern and we have a clear closure below our neckline so the pattern already confirmed , i`m waiting the price to go up a little to retest my broken neckline and then we can enter a sell trade . only 1 case i will avoid this idea , if we have a daily closure agin above my res with clear closure .

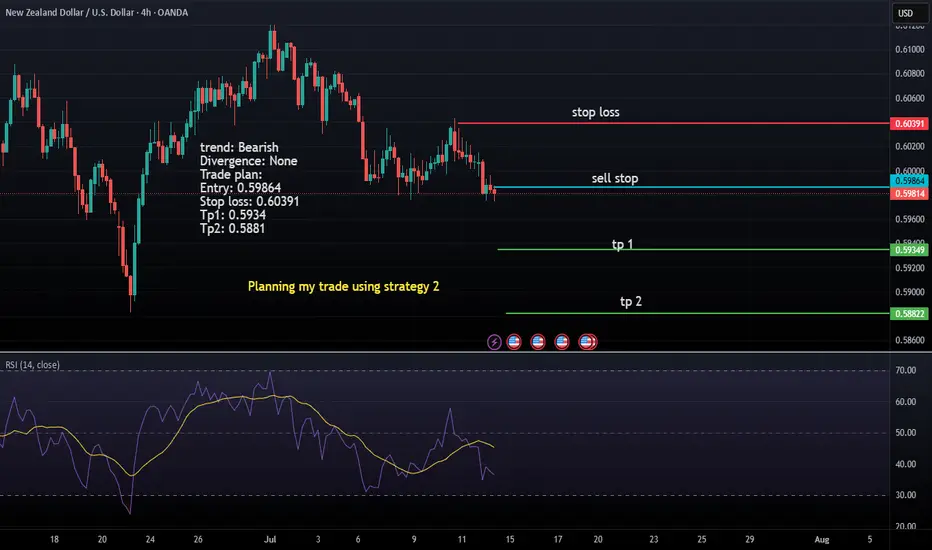
Bearish trend in NZDUSD pairA Bearish trend in the NZDUSD pair clear shows no divergence so I will short it and booking my tp 1 & tp 2
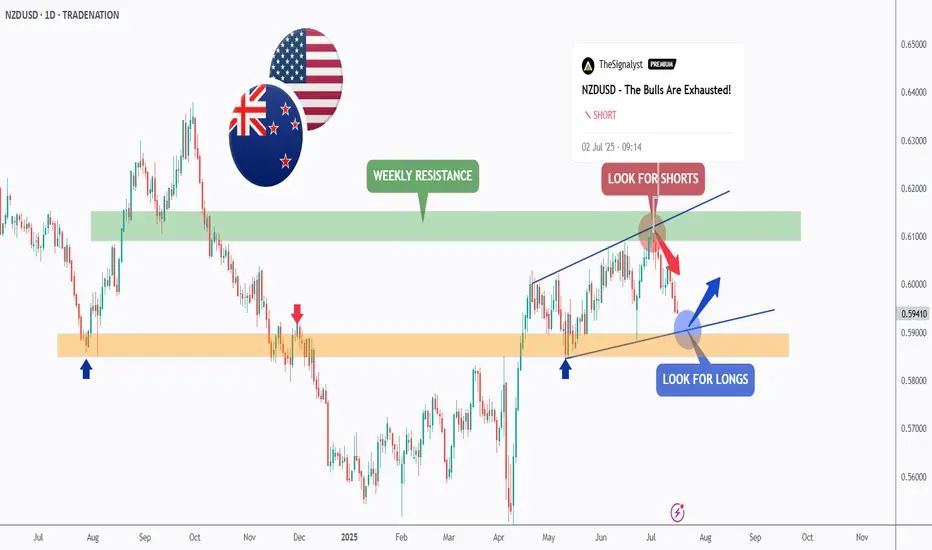
NZDUSD - It is Time!Hello TradingView Family / Fellow Traders. This is Richard, also known as theSignalyst.
As per our last NZDUSD analysis, attached on the chart, it rejected the upper bound of the blue wedge pattern and traded lower.
📈This week, NZDUSD is retesting the lower bound of the wedge.
Moreover, the orange zone is a strong weekly support.
🏹 Thus, the highlighted blue circle is a strong area to look for buy setups as it is the intersection of the lower blue trendline and orange support.
📚 As per my trading style:
As #NZDUSD approaches the blue circle zone, I will be looking for bullish reversal setups (like a double bottom pattern, trendline break , and so on...)
📚 Always follow your trading plan regarding entry, risk management, and trade management.
Good luck!
All Strategies Are Good; If Managed Properly!
~Rich
Disclosure: I am part of Trade Nation's Influencer program and receive a monthly fee for using their TradingView charts in my analysis.
NZDUSD BEARISH 16-7-2025trend : bearish
divergence : n/a
reversal : n/a
continuation : lhs & lls
harmonics : n/a
bias : bearish

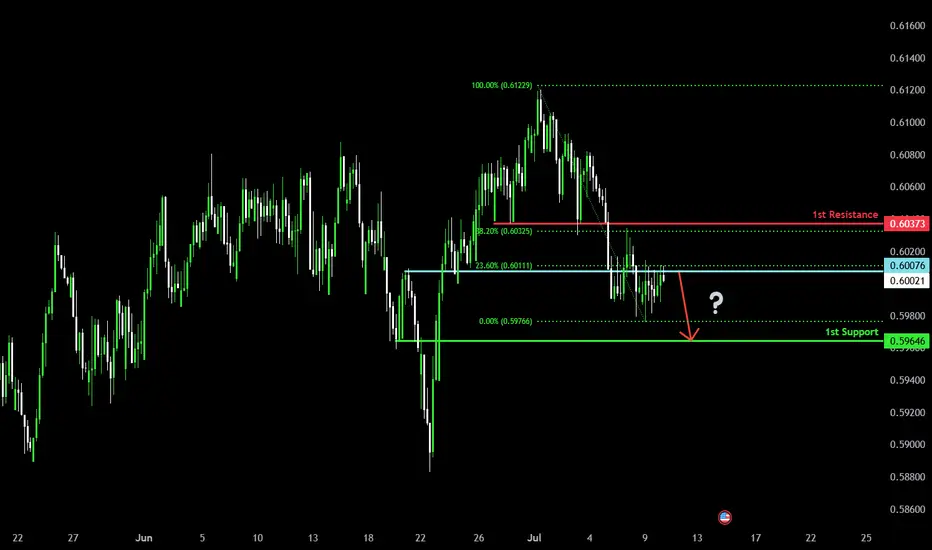
Bearish drop?The Kiwi (NZD/USD) is reacting off the pivot and could drop to the 1st support which is a pullback support.
Pivot: 0.6007
1st Support: 0.5946
1st Resistance: 0.6037
Risk Warning:
Trading Forex and CFDs carries a high level of risk to your capital and you should only trade with money you can afford to lose. Trading Forex and CFDs may not be suitable for all investors, so please ensure that you fully understand the risks involved and seek independent advice if necessary.
Disclaimer:
The above opinions given constitute general market commentary, and do not constitute the opinion or advice of IC Markets or any form of personal or investment advice.
Any opinions, news, research, analyses, prices, other information, or links to third-party sites contained on this website are provided on an "as-is" basis, are intended only to be informative, is not an advice nor a recommendation, nor research, or a record of our trading prices, or an offer of, or solicitation for a transaction in any financial instrument and thus should not be treated as such. The information provided does not involve any specific investment objectives, financial situation and needs of any specific person who may receive it. Please be aware, that past performance is not a reliable indicator of future performance and/or results. Past Performance or Forward-looking scenarios based upon the reasonable beliefs of the third-party provider are not a guarantee of future performance. Actual results may differ materially from those anticipated in forward-looking or past performance statements. IC Markets makes no representation or warranty and assumes no liability as to the accuracy or completeness of the information provided, nor any loss arising from any investment based on a recommendation, forecast or any information supplied by any third-party.
IS USD STRENGTH BACK? or IS IT JUST A PULLBACK?All the information you need to find a high probability trade are in front of you on the charts so build your trading decisions on 'the facts' of the chart NOT what you think or what you want to happen or even what you heard will happen. If you have enough facts telling you to trade in a certain direction and therefore enough confluence to take a trade, then this is how you will gain consistency in you trading and build confidence. Check out my trade idea!!
www.tradingview.com

Bearish reversal for the Kiwi?The price has rejected off the pivot, which acts as an overlap resistance that lines up with the 38.2% Fibonacci retracement and could drop to the 1st support.
Pivot: 0.6038
1st Support: 0.5938
1st Resistance: 0.6079
Risk Warning:
Trading Forex and CFDs carries a high level of risk to your capital and you should only trade with money you can afford to lose. Trading Forex and CFDs may not be suitable for all investors, so please ensure that you fully understand the risks involved and seek independent advice if necessary.
Disclaimer:
The above opinions given constitute general market commentary, and do not constitute the opinion or advice of IC Markets or any form of personal or investment advice.
Any opinions, news, research, analyses, prices, other information, or links to third-party sites contained on this website are provided on an "as-is" basis, are intended only to be informative, is not an advice nor a recommendation, nor research, or a record of our trading prices, or an offer of, or solicitation for a transaction in any financial instrument and thus should not be treated as such. The information provided does not involve any specific investment objectives, financial situation and needs of any specific person who may receive it. Please be aware, that past performance is not a reliable indicator of future performance and/or results. Past Performance or Forward-looking scenarios based upon the reasonable beliefs of the third-party provider are not a guarantee of future performance. Actual results may differ materially from those anticipated in forward-looking or past performance statements. IC Markets makes no representation or warranty and assumes no liability as to the accuracy or completeness of the information provided, nor any loss arising from any investment based on a recommendation, forecast or any information supplied by any third-party.

Market Analysis: NZD/USD SlipsMarket Analysis: NZD/USD Slips
NZD/USD is struggling and might decline below the 0.5980 level.
Important Takeaways for NZD/USD Analysis Today
- NZD/USD is consolidating above the 0.5980 support.
- There is a connecting bearish trend line forming with resistance at 0.6010 on the hourly chart of NZD/USD at FXOpen.
NZD/USD Technical Analysis
On the hourly chart of NZD/USD at FXOpen, the pair also followed AUD/USD. The New Zealand Dollar struggled above 0.6100 and started a fresh decline against the US Dollar.
There was a move below the 0.6050 and 0.6020 support levels. A low was formed at 0.5978 and the pair is now consolidating losses below the 50-hour simple moving average. The NZD/USD chart suggests that the RSI is back below 50 signalling a bearish bias.
On the upside, the pair is facing resistance near the 23.6% Fib retracement level of the downward move from the 0.6120 swing high to the 0.5978 low. There is also a connecting bearish trend line forming with resistance at 0.6010.
The next major resistance is near the 0.6065 level or the 61.8% Fib retracement level. A clear move above the 0.6065 level might even push the pair toward the 0.6120 level. Any more gains might clear the path for a move toward the 0.6150 resistance zone in the coming days.
On the downside, there is a support forming near the 0.5980 zone. If there is a downside break below 0.5980, the pair might slide toward 0.5940. Any more losses could lead NZD/USD in a bearish zone to 0.5910.
This article represents the opinion of the Companies operating under the FXOpen brand only. It is not to be construed as an offer, solicitation, or recommendation with respect to products and services provided by the Companies operating under the FXOpen brand, nor is it to be considered financial advice.

NZDUSD Potential LongsHere's how I'm watching NZDUSD for long trade setups. MSS+IND+RTO.
Stay reactive either ways

NZD/USD "KIWI HEIST" – BEARISH BANK ROBBERY!🦹♂️ NZD/USD "THE KIWI HEIST" – BEARISH BANK ROBBERY PLAN! 🚨💰
(Thief Trading Style – Short Entry Strategy for Maximum Loot!)
🎯 MASTER TRADING HEIST BLUEPRINT
🔥 Thief’s Technical & Fundamental Analysis Confirms:
NZD/USD is OVERBOUGHT + TREND REVERSAL!
Police (Bulls) set a TRAP near the Red Zone (Support) – Time to ESCAPE with profits before they catch us!
✔ Entry Point (Bearish Loot Grab):
*"The vault is UNLOCKED! Swipe SHORT anywhere – but for SAFER HEIST, use Sell Limit orders (15m/30m pullbacks). Pro Thieves use DCA/Layering for max gains!"*
✔ Stop Loss (Escape Route):
"SL at nearest 4H Swing High (0.60400). Adjust based on YOUR risk tolerance & loot size!"
✔ Target 🎯 (Profit Escape):
0.58900 (or exit earlier if cops (bulls) show up!)
⚠️ THIEF’S WARNING – NEWS & RISK MANAGEMENT
📢 High-Impact News = VOLATILITY TRAP!
Avoid new trades during news releases.
Trailing SL = Lock profits & evade market cops!
💥 SCALPERS & SWING THIEVES – QUICK NOTES:
Scalpers: Only quick LONG scalp plays (use Trailing SL!).
Swing Thieves: Hold for the BIG BEARISH LOOT! 🏦
📉 WHY NZD/USD IS BEARISH? (Thief’s Intel Report)
Overbought + Trend Reversal Signals!
Bulls (Police) losing strength at Resistance!
For FULL Intel (Fundamentals, COT Report, Sentiment, etc.) – Klickk 🔗!
🚀 BOOST THIS HEIST! (Like & Share for More Loot Plans!)
💖 "Hit 👍 BOOST to strengthen our THIEF SQUAD! More heists = More profits!"
📌 DISCLAIMER (Stay Safe, Thieves!):
This is NOT financial advice. Trade at your own risk & manage positions wisely!
🤑 NEXT HEIST COMING SOON… STAY TUNED! 🎭

NZD/USD showing a potential bullish setupNZDUSD 4H Trade Breakdown – Bullish Reversal in Play 🔥📈
This setup is a textbook example of a smart money reversal backed by structure, market psychology, and clear technicals.
1. Change of Character (CHoCH):
- The market was previously in a downtrend.
- Price broke above the last lower high, signaling a CHoCH – the first sign that buyers are gaining control.
- This is a key point where many smart traders start paying attention.
2. Trendline & Channel Respect:
- Price tapped perfectly off the ascending trendline, confirming the long-term bullish channel.
- This adds confluence (multiple confirmations) to the bullish bias.
3. Market Structure Shift:
- After the CHoCH, price formed a higher low and started pushing up.
- This shows a shift to bullish structure (higher highs and higher lows).
4. Projected Move:
- The blue arrow shows a likely path: a bullish break, possible pullback to retest the broken structure, then continuation up.
- Targeting above 0.61200, with potential for further highs.
Why this trade stands out:
✅ Structure break (CHoCH)
✅ Strong support off trendline

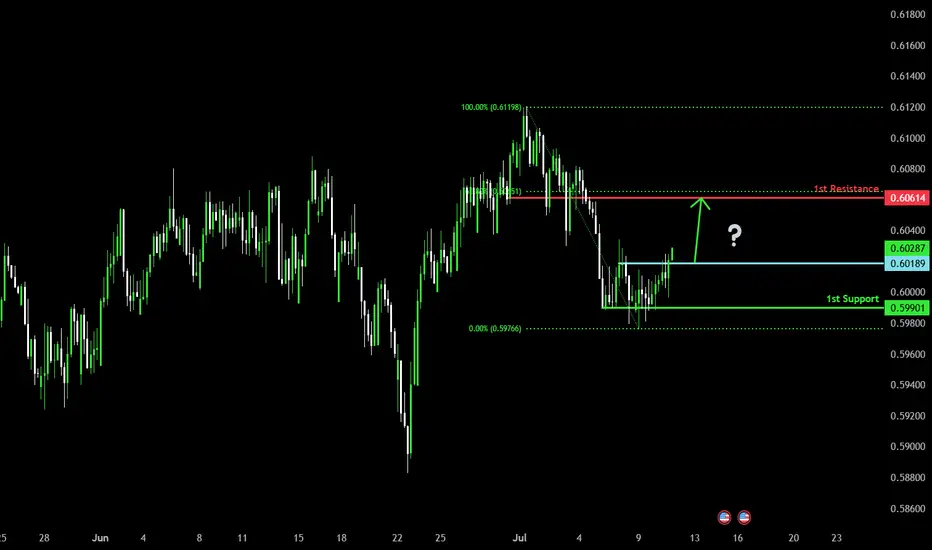
Potential bullish rise?The Kiwi (NZD/USD) is reacting off the pivot and could rise from this level to the 1st resistance.
Pivot: 0.6018
1st Support: 0.5990
1st Resistance: 0.6061
Risk Warning:
Trading Forex and CFDs carries a high level of risk to your capital and you should only trade with money you can afford to lose. Trading Forex and CFDs may not be suitable for all investors, so please ensure that you fully understand the risks involved and seek independent advice if necessary.
Disclaimer:
The above opinions given constitute general market commentary, and do not constitute the opinion or advice of IC Markets or any form of personal or investment advice.
Any opinions, news, research, analyses, prices, other information, or links to third-party sites contained on this website are provided on an "as-is" basis, are intended only to be informative, is not an advice nor a recommendation, nor research, or a record of our trading prices, or an offer of, or solicitation for a transaction in any financial instrument and thus should not be treated as such. The information provided does not involve any specific investment objectives, financial situation and needs of any specific person who may receive it. Please be aware, that past performance is not a reliable indicator of future performance and/or results. Past Performance or Forward-looking scenarios based upon the reasonable beliefs of the third-party provider are not a guarantee of future performance. Actual results may differ materially from those anticipated in forward-looking or past performance statements. IC Markets makes no representation or warranty and assumes no liability as to the accuracy or completeness of the information provided, nor any loss arising from any investment based on a recommendation, forecast or any information supplied by any third-party.
NZDUSD M15 I Bullish Bounce Off Based on the M15 chart analysis, the price is approaching our buy entry level at 0.6014, a pullback support.
Our take profit is set at 0.6053, a pullback resistance that aligns with the 100% Fib projection.
The stop loss is placed at 0.5975, a swing low support.
High Risk Investment Warning
Trading Forex/CFDs on margin carries a high level of risk and may not be suitable for all investors. Leverage can work against you.
Stratos Markets Limited (tradu.com ):
CFDs are complex instruments and come with a high risk of losing money rapidly due to leverage. 63% of retail investor accounts lose money when trading CFDs with this provider. You should consider whether you understand how CFDs work and whether you can afford to take the high risk of losing your money.
Stratos Europe Ltd (tradu.com ):
CFDs are complex instruments and come with a high risk of losing money rapidly due to leverage. 63% of retail investor accounts lose money when trading CFDs with this provider. You should consider whether you understand how CFDs work and whether you can afford to take the high risk of losing your money.
Stratos Global LLC (tradu.com ):
Losses can exceed deposits.
Please be advised that the information presented on TradingView is provided to Tradu (‘Company’, ‘we’) by a third-party provider (‘TFA Global Pte Ltd’). Please be reminded that you are solely responsible for the trading decisions on your account. There is a very high degree of risk involved in trading. Any information and/or content is intended entirely for research, educational and informational purposes only and does not constitute investment or consultation advice or investment strategy. The information is not tailored to the investment needs of any specific person and therefore does not involve a consideration of any of the investment objectives, financial situation or needs of any viewer that may receive it. Kindly also note that past performance is not a reliable indicator of future results. Actual results may differ materially from those anticipated in forward-looking or past performance statements. We assume no liability as to the accuracy or completeness of any of the information and/or content provided herein and the Company cannot be held responsible for any omission, mistake nor for any loss or damage including without limitation to any loss of profit which may arise from reliance on any information supplied by TFA Global Pte Ltd.
The speaker(s) is neither an employee, agent nor representative of Tradu and is therefore acting independently. The opinions given are their own, constitute general market commentary, and do not constitute the opinion or advice of Tradu or any form of personal or investment advice. Tradu neither endorses nor guarantees offerings of third-party speakers, nor is Tradu responsible for the content, veracity or opinions of third-party speakers, presenters or participants.

July 13, Forex Outlook : This Week’s Blueprint to Profit!Welcome back, traders!
In today’s video, we’ll be conducting a Forex Weekly Outlook, analyzing multiple currency pairs from a top-down perspective—starting from the higher timeframes and working our way down to the lower timeframes.
Currency Pairs:
EURUSD
USDCAD
AUDUSD
EURGBP
EURJPY
GBPCHF
USDCHF
NZDCHF
NZDUSD
EURNZD
Our focus will be on identifying high-probability price action scenarios using clear market structure, institutional order flow, and key confirmation levels. This detailed breakdown is designed to give you a strategic edge and help you navigate this week’s trading opportunities with confidence.
📊 What to Expect in This Video:
1. Higher timeframe trend analysis
2. Key zones of interest and potential setups
3. High-precision confirmations on lower timeframes
4. Institutional insight into where price is likely to go next
Stay tuned, take notes, and be sure to like, comment, and subscribe so you don’t miss future trading insights!
Have a great week ahead, God bless you!
The Architect 🏛️📉


NZDUSD is BullishPrice is in a strong downtrend, and respecting the descending trendline, however the matured bullish divergence with a double bottom reversal pattern hints the control of bulls. If the trendline and previous lower high are broken with good volume then we can expect a bullish reversal as per the Dow theory. Targets are mentioned on the chart.

