NZDUSD POSSIBLE TRADE SETUPPotential Trade Setup on NZDUSD
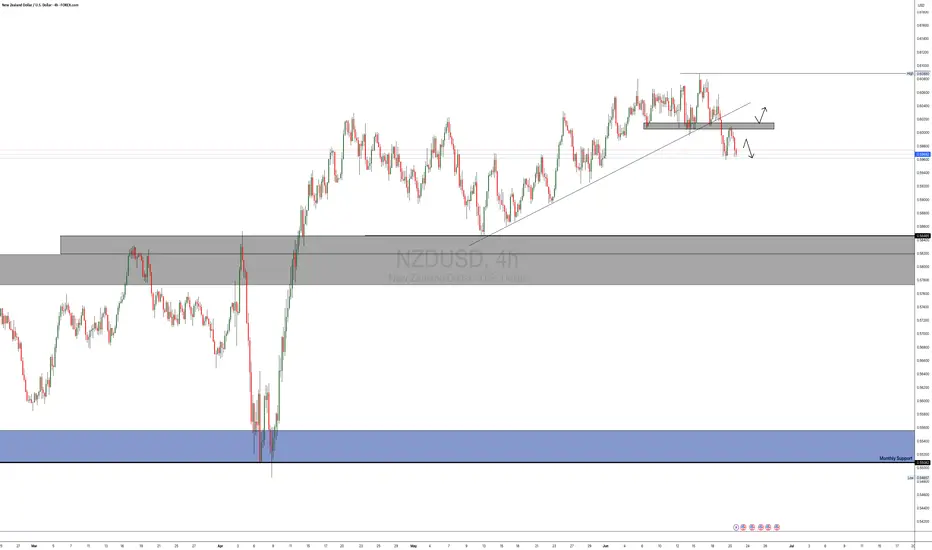
NZDUSD is on a strong 3-week rally correction that almost got broken to the downside last week and successfully retested on Friday
That said, I am still quite anticipating for a possible continuation of the bearish trajectory that started last week to continue towards the MAY low at 0.5880
Trading Plan:
1. SELL: is currently in play, and a further downside movement can be well followed through in the 4H chart.
2. BUY: if the resistance is broken and the retest is successful.
Targets:
1. Can be 1:2 for either entry.
NZDUSD trade ideas
Trade Idea: Buy NZD/USD (Short-Term)
**📈 Trade Idea: Buy NZD/USD (Short-Term)**
**Bias:** 🔼 Mildly Bullish
**Timeframe:** ⏳ Short-Term (few days to a week)
---
### **💡 Why Buy NZD/USD?**
**🇺🇸 U.S. Dollar (USD):**
* **U.S. growth slowing**
→ *📉 Losing steam — not great for the greenback.*
* **Inflation still above 2%**
→ *🔥 Still sticky, but not hot enough to force more hikes.*
* **Fed on pause, no hikes expected**
→ *🛑 Neutral stance = no strong push behind the dollar.*
* **Traders are heavily short USD**
→ *📊 Market leaning bearish — the flow favors downside.*
---
**🇳🇿 New Zealand Dollar (NZD):**
* **Moves with AUD; USD weakness helps**
→ *🧲 Riding the Aussie’s coattails and dollar softness.*
* **RBNZ cut to 3.25% but no surprises now**
→ *💤 Dovish tone is baked in — no fresh reason to sell.*
* **Inflation stable, no shock data**
→ *⚖️ Balanced outlook helps keep NZD supported.*
* **June 23 GDP is the next big test**
→ *📅 Eyes on the date, but no panic until then.*
* **Dairy & China demand still a drag**
→ *🐄📉 Known risks — not new, not spooking the market.*
---
### **🔍 Outlook:**
Not a breakout setup, but NZD/USD could **grind higher** if nothing major changes. USD weakness + quiet Kiwi = room to float up short-term.
---
**📌 Note:**
> *“It’s not exciting, but it’s working. USD soft, NZD steady — could drift higher while the market waits for GDP.”*

NZDUSD Expected Growth! BUY!
My dear subscribers,
My technical analysis for NZDUSD is below:
The price is coiling around a solid key level - 0.5966
Bias - Bullish
Technical Indicators: Pivot Points Highanticipates a potential price reversal.
Super trend shows a clear buy, giving a perfect indicators' convergence.
Goal - 0.6001
My Stop Loss - 0.5946
About Used Indicators:
By the very nature of the supertrend indicator, it offers firm support and resistance levels for traders to enter and exit trades. Additionally, it also provides signals for setting stop losses
Disclosure: I am part of Trade Nation's Influencer program and receive a monthly fee for using their TradingView charts in my analysis.
———————————
WISH YOU ALL LUCK

NZD/USD BEST PLACE TO SELL FROM|SHORT
NZD/USD SIGNAL
Trade Direction: short
Entry Level: 0.607
Target Level: 0.603
Stop Loss: 0.610
RISK PROFILE
Risk level: medium
Suggested risk: 1%
Timeframe: 3h
Disclosure: I am part of Trade Nation's Influencer program and receive a monthly fee for using their TradingView charts in my analysis.
✅LIKE AND COMMENT MY IDEAS✅

NZDUSD My Opinion! BUY!
My dear subscribers,
My technical analysis for NZDUSD is below:
The price is coiling around a solid key level - 0.6015
Bias - Bullish
Technical Indicators: Pivot Points High anticipates a potential price reversal.
Super trend shows a clear buy, giving a perfect indicators' convergence.
Goal - 0.6043
My Stop Loss - 0.5999
About Used Indicators:
By the very nature of the supertrend indicator, it offers firm support and resistance levels for traders to enter and exit trades. Additionally, it also provides signals for setting stop losses
Disclosure: I am part of Trade Nation's Influencer program and receive a monthly fee for using their TradingView charts in my analysis.
———————————
WISH YOU ALL LUCK

NZD-USD Bearish Breakout! Sell!
Hello,Traders!
NZD-USD broke out of the
Rising channel and then made
A bearish breakout of the
Horizontal key level too
Around 0.0602 which is
Now a resistance, then
Made a pullback and retest
And is going down again which
Reinforces our local bearish bias
And we will be expecting a
Further bearish move down
Sell!
Comment and subscribe to help us grow!
Check out other forecasts below too!
Disclosure: I am part of Trade Nation's Influencer program and receive a monthly fee for using their TradingView charts in my analysis.

NZD/USD Pushes Below Opening Range for JuneNZD/USD slipped to a fresh monthly low (0.5959) after struggling to close above 0.6070 (61.8% Fibonacci extension), and a move/close below the 0.5920 (61.8% Fibonacci extension) to 0.5930 (78.6% Fibonacci extension) region may lead to a test of the May low (0.5847).
Next area of interest comes in around 0.5740 (78.6% Fibonacci retracement) to 0.5760 (100% Fibonacci extension), but NZD/USD may attempt to retrace the decline from the monthly high (0.6088) should it defend the advance from the May low (0.5847).
Need a close above 0.6070 (61.8% Fibonacci extension) to bring 0.6170 (50% Fibonacci extension) on the radar, with the next area of interest coming in around 0.6230 (50% Fibonacci extension) to 0.6260 (38.2% Fibonacci extension).
--- Written by David Song, Senior Strategist at FOREX.com

Long trade
🟢 Trade Journal Entry – Buyside Trade
📍 Pair: NZDUSD
📅 Date: Tuesday, June 17, 2025
🕒 Time: 3:00 PM (NY Session PM)
⏱ Time Frame: 1 Hour
📈 Direction: Buyside
📊 Trade Breakdown:
Entry Price 0.60143
Profit Level 0.60749 (+1.01%)
Stop Loss 0.60052 (−0.15%)
Risk-Reward
Ratio 6:66 1
🧠 Context / Trade Notes:
1HR OB Entry Zone:
Long trade taken off a bullish order block zone following prior mitigation and consolidation buildup.
Sweep of Internal Liquidity:
Entry positioned after a sweep of a short-term low and rejection off internal demand.

Bearish reversal?The Kiwi (NZD/USD) is rising towards the pivot and could reverse to the pullback support.
Pivot: 0.6036
1st Support: 0.5965
1st Resistance: 0.6080
Risk Warning:
Trading Forex and CFDs carries a high level of risk to your capital and you should only trade with money you can afford to lose. Trading Forex and CFDs may not be suitable for all investors, so please ensure that you fully understand the risks involved and seek independent advice if necessary.
Disclaimer:
The above opinions given constitute general market commentary, and do not constitute the opinion or advice of IC Markets or any form of personal or investment advice.
Any opinions, news, research, analyses, prices, other information, or links to third-party sites contained on this website are provided on an "as-is" basis, are intended only to be informative, is not an advice nor a recommendation, nor research, or a record of our trading prices, or an offer of, or solicitation for a transaction in any financial instrument and thus should not be treated as such. The information provided does not involve any specific investment objectives, financial situation and needs of any specific person who may receive it. Please be aware, that past performance is not a reliable indicator of future performance and/or results. Past Performance or Forward-looking scenarios based upon the reasonable beliefs of the third-party provider are not a guarantee of future performance. Actual results may differ materially from those anticipated in forward-looking or past performance statements. IC Markets makes no representation or warranty and assumes no liability as to the accuracy or completeness of the information provided, nor any loss arising from any investment based on a recommendation, forecast or any information supplied by any third-party.

NZDUSD Bearish Bias on the 4H Bearish momentum break of trend line
LL created
Waiting for a pull back to the 50 - 61.8 % fib level
Pros
- we have daily Bearish
- Key Resistance level
- Fresh trend change
Cons
- We still need to wait for pull back to present a good entry.
For Entry,
- Looking for bearish price action e.g
momentum loss, pull back trend line break, bearish engulfing,
lower timeframe change of structure

NZDUSD BULLISH SETUPNZDUSD is bullish trend start, previous LH break.
I would take entry with buy limit order at fib retracement.
Manage your trade accordingly.
Bullish AB=CD Hey traders 👋
This is a textbook Bullish AB=CD structure unfolding on NZDUSD.
The market sold off in clean symmetry from A → B, pulled back into C, and completed the full AB = CD leg at D (0.59590) — precisely at the 100% – 127.2% PRZ.
🧠 Pattern Breakdown:
AB = CD completion at 0.59590
Reversal began from confluence zone with clear reaction
PRZ defined from 0.59788 to 0.59574
Target 1 → 0.60202 – 0.60368
Target 2 → 0.60683 – 0.60849 (extension to full symmetry cycle)
We now monitor for continuation and use structure to manage the trade.
Momentum shifting bullish — trade the setup, not your opinion.
— C. Dela | #TradeChartPatternsLikeThePros.

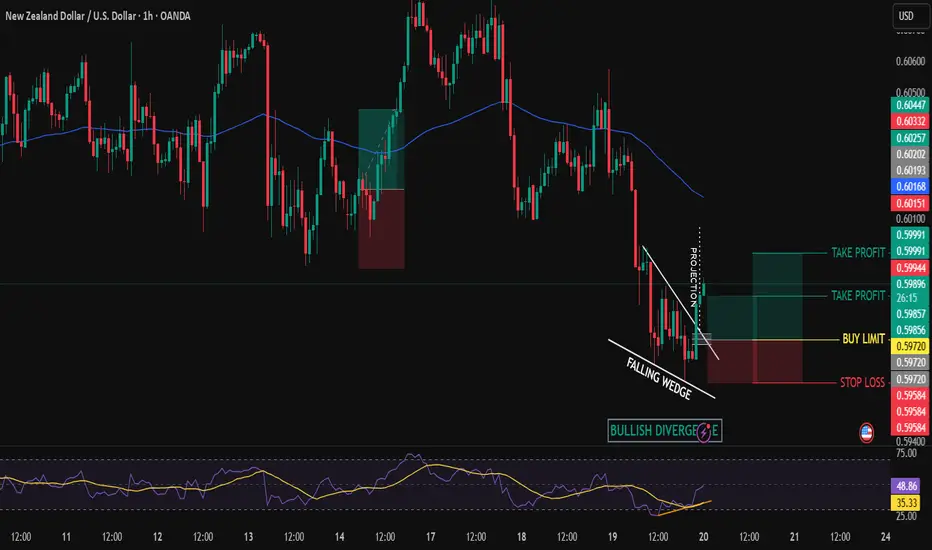
NZD/USD – Potential Bullish Reversal Setup- Wk9The NZD/USD pair is showing strong signs of a potential reversal. The price has entered the Potential Reversal Zone (PRZ) as indicated by the AB=CD harmonic pattern. A clear bullish divergence has also been spotted on the chart, adding further confirmation to the setup.
To strengthen the bias, a falling wedge—a classic bullish reversal pattern—has formed. With all technical indicators aligning, we anticipate a bullish reversal in the coming sessions.
🔹 Pair: NZD/USD
🔹 Trend: Bearish (but preparing for reversal)
🔹 Pattern: Falling Wedge
🔹 Harmonic Pattern: AB=CD
🔹 Divergence: Bullish
🔹 Entry: Buy Stop at 0.59917
🔹 Stop Loss: 0.59549
🔹 Take Profit 1: 0.60285
🔹 Take Profit 2: 0.60653
🔹 Lot Size: 0.14
🔹 Risk/Reward: 1:1 and 1:2
🔹 Risk: $200
🔹 Potential Reward: $300
📌 #NZDUSD #ForexSignals #HarmonicPatterns #ABCDPattern #BullishDivergence #FallingWedge #TechnicalAnalysis #ForexSetup #ReversalTrade #PriceActionTrading #SmartMoney #1HChart #FXTrading #RiskReward

NZDUSD What Next? BUY!
My dear friends,
My technical analysis for NZDUSD is below:
The market is trading on 0.5974 pivot level.
Bias - Bullish
Technical Indicators: Both Super Trend & Pivot HL indicate a highly probable Bullish continuation.
Target - 0.6009
About Used Indicators:
A pivot point is a technical analysis indicator, or calculations, used to determine the overall trend of the market over different time frames.
Disclosure: I am part of Trade Nation's Influencer program and receive a monthly fee for using their TradingView charts in my analysis.
———————————
WISH YOU ALL LUCK

nzd usd for buying H1 we wait for breaking the trend
then make bull back so its for buying when do it with divergance
NZDUSD - Expecting Bearish Continuation In The Short TermH1 - Clean bearish trend with the price creating series of lower highs, lower lows.
No opposite signs.
Expecting further continuation lower until the two Fibonacci resistance zones hold.
If you enjoy this idea, don’t forget to LIKE 👍, FOLLOW ✅, SHARE 🙌, and COMMENT ✍! Drop your thoughts and charts below to keep the discussion going. Your support helps keep this content free and reach more people! 🚀
--------------------------------------------------------------------------------------------------------------------

NZDUSD SHORTSwere seeing the distribution play out nicely on the dollar pairs. I think a pull up to the last supply could be a nice short !!!

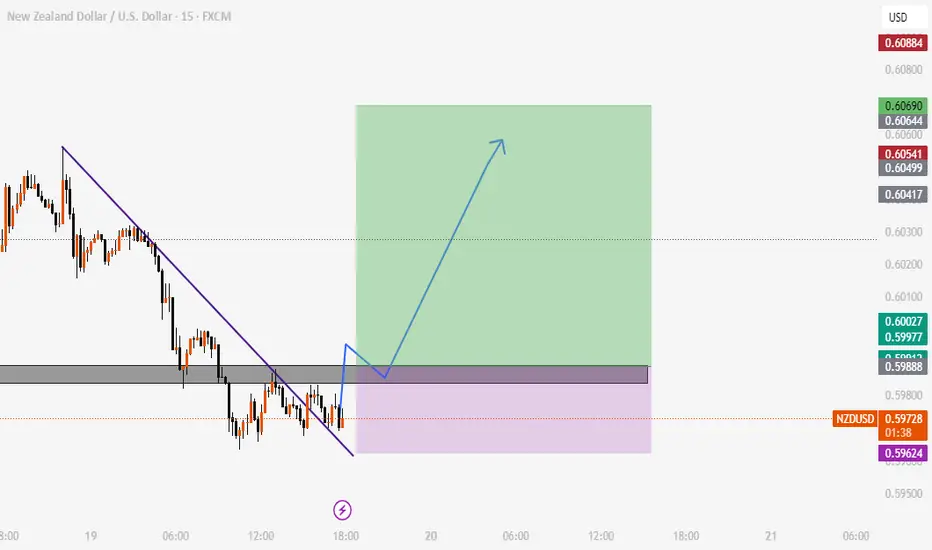
Bullish bounce off overlap support?The Kiwi (NZD/USD) is reacting off the pivot, which has been identified as an overlap support, and could bounce to the first resistance, which is an overlap resistance.
Pivot: 0.5990
1st Support: 0.5951
1st Resistance: 0.6044
Risk Warning:
Trading Forex and CFDs carries a high level of risk to your capital and you should only trade with money you can afford to lose. Trading Forex and CFDs may not be suitable for all investors, so please ensure that you fully understand the risks involved and seek independent advice if necessary.
Disclaimer:
The above opinions given constitute general market commentary, and do not constitute the opinion or advice of IC Markets or any form of personal or investment advice.
Any opinions, news, research, analyses, prices, other information, or links to third-party sites contained on this website are provided on an "as-is" basis, are intended only to be informative, is not an advice nor a recommendation, nor research, or a record of our trading prices, or an offer of, or solicitation for a transaction in any financial instrument and thus should not be treated as such. The information provided does not involve any specific investment objectives, financial situation and needs of any specific person who may receive it. Please be aware, that past performance is not a reliable indicator of future performance and/or results. Past Performance or Forward-looking scenarios based upon the reasonable beliefs of the third-party provider are not a guarantee of future performance. Actual results may differ materially from those anticipated in forward-looking or past performance statements. IC Markets makes no representation or warranty and assumes no liability as to the accuracy or completeness of the information provided, nor any loss arising from any investment based on a recommendation, forecast or any information supplied by any third-party.

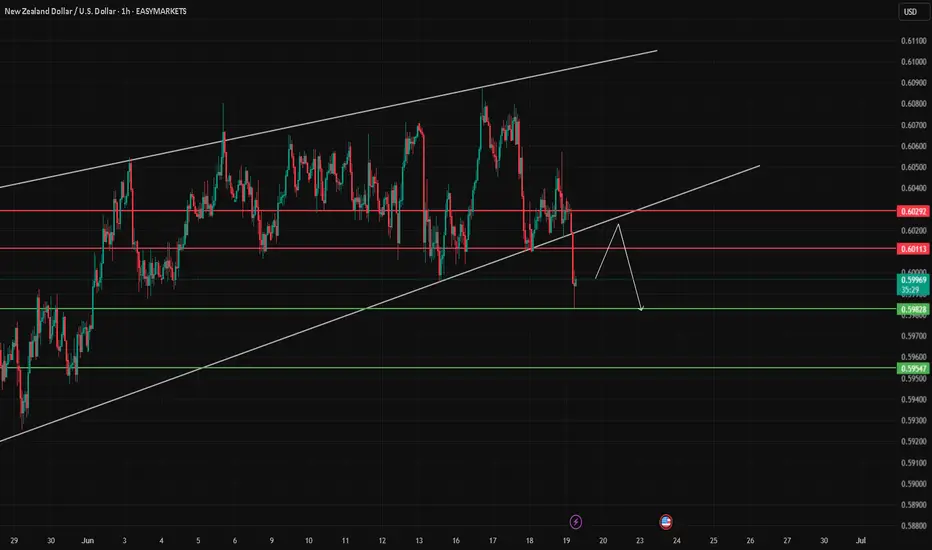
NZD/USD Breaks TrendlineNZD/USD has broken below the ascending trendline and is now retesting the 0.60113 – 0.60292 zone, which may act as new resistance.
If the pair fails to reclaim this zone, we could see a continuation lower toward the key supports at 0.59828 and 0.59547.
A confirmed break back above 0.6030 would invalidate the bearish outlook.
🔻 Structure: Break + retest of trendline
🔻 Resistance: 0.60113 – 0.60292
🔻 Support 1: 0.59828
🔻 Support 2: 0.59547
🔻 Timeframe: 1H
🔻 Bias: Bearish unless reclaimed above 0.6030
Technical idea only – not financial advice.
NZDUSD SELL OFF (Counter-Trend Setup)(Daily) - Price hit Key resistance level at (0.60308 - 0.59985) and consolidated at the level attempting to breakout but failing and forming double top in 4H.
(4H) - Price formed double top at the Key resistance level (0.60308 - 0.59985) which is reversal pattern, neckline of the DT at (0.60031).
(4H) - Bearish market structure at the level price forming new lower high and lower low at (0.60578 - 0.60535)
(4H) - Rising trendline connecting low of the price at (0.58522 - 0.59556).
Entry ;
-We have 2 entry models;
1.Aggressive Entry at the Double top after the close of the bearish Engulfing Candle SL above double top at 0.60808
2.Conservative Entry wait for the break of the rising trendline to signal trend change from an uptrend to downtrend then execute.

New Zealand GDP expected to contract, New Zealand dollar recoverThe New Zealand dollar has posted gains on Wednesday. In the North American session, NZD/USD is trading at 0.6042, up 0.45% on the day. The New Zealand dollar sustained sharp losses a day earlier, declining 0.75%.
The New Zealand economy is in recession and the markets are bracing for a contraction in first-quarter GDP of 0.8%. The economy declined in Q4 2024 by 1.1%.
A weak GDP report would put pressure on the Reserve Bank of New Zealand to reduce interest rates at the next meeting on July 9. The Reserve Bank has been aggressive and lowered rates for a sixth straight time in May to 3.25%, for a total of 225 basis points.
Is the resilient US consumer showing cracks?
US retail sales slumped in May, falling 0.9% m/m. This was well below the revised -0.1% reading in April and worse than the market estimate of -0.7%. Annually, retail sales fell to 3.3%, down sharply from a revised 5.0%.
The monthly retail sales is particularly concerning because it marked a second straight decline. The pre-tariff spike in consumer spending has fizzled as the tariffs have taken effect. Consumers are wary that the tariffs will boost inflation and dampen consumer spending power and concerns about hiring have risen, prompting consumers to batten down the hatches in anticipation of tougher times ahead.
If additional key US data heads lower, this will increase pressure on the Federal Reserve to lower interest rates. The markets have priced in a hold at Wednesday's meeting at practically 100%, with little chance of a rate cut before September.
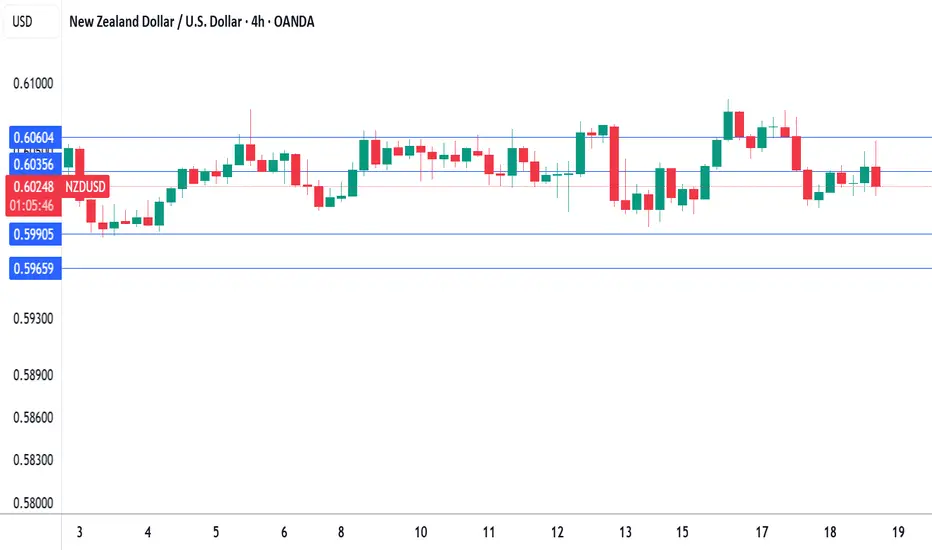
NZD/USD is testing resistance at 0.6035. Above, there is resistance at 0.6060
0.5990 and 0.5965 and providing support
Possible reversal on Nzd/UsdNZD/USD is currently trading around 0.6030, and there are indications of a potential reversal. Let's break down the key points :
- Current Price: NZD/USD is trading at 0.6027, with a 0.2% increase in the last 24 hours.
- Ascending Channel: The pair is testing the lower boundary of an ascending channel near 0.6020, which could signal a bearish bias if broken.
- Relative Strength Index (RSI): The 14-day RSI remains above 50, suggesting a bullish bias is still in play.
- Resistance Levels: Initial resistance is at the nine-day EMA of 0.6028, followed by the eight-month high of 0.6081.
- *Support Levels*: A break below 0.6020 could lead to a decline toward the 50-day EMA at 0.5941.
Maybe bullish:
- Overlap Support: The pivot point at 0.5989 acts as an overlap support, which could lead to a bounce to the 1st resistance at 0.6060.
- Buying Opportunity: Traders are monitoring NZD/USD for a buying opportunity around the 0.60000 zone, citing a testing of the upward trend and liquidity zone.
Keep in mind that technical analysis is only part of investment reference, and market volatility can be unpredictable. It's essential to consider multiple factors, including economic news and geopolitical events, when making trading decisions .

NZDUSD TRADE IDEATrade pulling back to the entry of our first trade.
Let's see what the market does.
But our bias is to the upside
