NZDUSD SELL TRADE PLAN🔥 NZD/USD TRADE PLAN 🔥
📅 Date: April 23, 2025
Plan Type: Main Swing – Reversal
Trade Plan Overview
Type Direction Confidence R:R Status
Swing Sell ⭐⭐⭐⭐ 88% 4.1:1 Waiting
Guidance: Prioritize this Swing Sell plan due to 88% confidence. Price has rejected a daily supply and H4 OB with bearish imbalance and exhaustion visible on intraday. Sentiment and macro DXY flow reinforce bearish NZD stance. Total portfolio risk: 1%.
Primary Trade Plan: Swing – Sell
📈 Market Bias & Trade Type
Bias: Bearish 📉
Trade Type: Reversal
🔰 Confidence Level
⭐⭐⭐⭐ (88%)
Reason:
* D1 supply zone + fresh rejection wick.
* H4 OB + liquidity sweep.
* M30 BOS + divergence.
* Sentiment Score: +7/10
* DXY bullish continuation
* Cross-confirmation: AUD/NZD bullish divergence
* Historical win rate: 76% for this setup archetype
Confidence Breakdown:
* OB Confluence: 28%
* Fib: 18%
* Sentiment: 14%
* Cross-Market: 12%
* Volume/Structure: 16%
📌 Status – price in primary OB zone.
📍 Entry Zones
🟥 Primary Sell Zone: 0.5990 – 0.6010 (D1 OB + FVG + wick inducement)
🟧 Secondary Zone: 0.6025 – 0.6045 (Wick imbalance fill + psychological level)
❗ Stop Loss
0.6060 (Above D1 OB + 1x H4 ATR, ~65 pips risk)
🎯 Take Profit Targets
🥇 TP1: 0.5910 (80 pips, 1.2:1 R:R, H4 swing zone)
🥈 TP2: 0.5805 (185 pips, 2.8:1 R:R, D1 EQ zone)
🥉 TP3: 0.5675 (315 pips, 4.8:1 R:R, swing low)
📏 Risk:Reward
TP2: 2.8:1
TP3: 4.8:1
🧠 Management Strategy
* Risk: 1% of $10,000 = $100 ≈ 0.2 lots
* SL to BE after TP1
* TP1: 50%, TP2: 30%, TP3: 20% trail
* Exit early on H4 BOS bullish or USD reversal
* Portfolio exposure capped at 1%
⚠️ Confirmation Criteria
* M30 bearish engulfing/pin bar inside OB
* H1/M30 volume confirmation
* Optional: M15 RSI divergence
* Best Entry: London Open / NY overlap
* Avoid: RBNZ policy statement/news spikes
⏳ Validity
H4 setup valid for 1–3 days (expires April 26)
❌ Invalidation: H4/D1 close above 0.6060 or structure shift bullish
🌐 Fundamental & Sentiment Snapshot
* COT: USD bullish bias strengthening
* DXY: Bullish structure holding
* Retail Sentiment: 74% long NZD/USD (contrarian bearish)
* Cross-Pair: AUD/NZD bullish (implies NZD weakness)
* Cross-Market: XAU/USD steady, not conflicting
* Macro: No major RBNZ/fed releases within 48h
* Sentiment Score: +7/10
* Historical: 76% win rate on this OB reversal pattern
📋 Final Trade Summary
D1 OB rejection with textbook H4 structure aligns for swing short. Setup awaits OB reaction + intraday entry. Confidence is high with strong macro alignment. Entry window preferred during London–NY crossover. Monitor volume and M30/H1 confirmations before executing. TP scaling designed to capture short-term, mid-range, and trend-continuation targets.
NZDUSD trade ideas

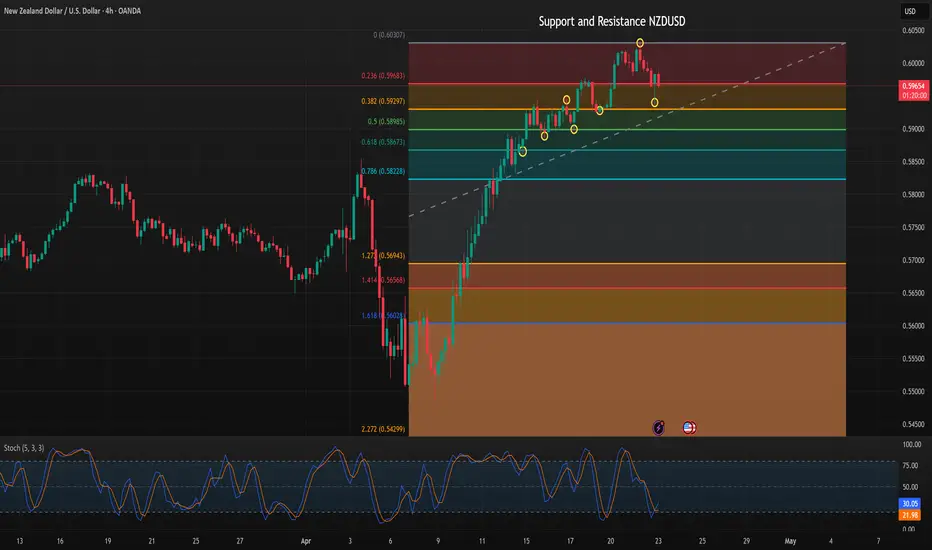
Support and Resistance for NZDUSDAwaiting a strengthing of the US Dollar. I have outlined support and resistance area's.
Support and Resistance for NZDUSD
OANDA:NZDUSD TVC:DXY
NZD-USD Potential Long! Buy!
Hello,Traders!
NZD-USD is trading in an
Uptrend and the pair is making
A local bearish correction
Towards the horizontal support
Level of 0.5912 and after the
Retest we will be expecting
A bullish rebound
Buy!
Comment and subscribe to help us grow!
Check out other forecasts below too!
Disclosure: I am part of Trade Nation's Influencer program and receive a monthly fee for using their TradingView charts in my analysis.

NZDUSD INTRADAY Bullish breakout supported at 0.5920NZDUSD maintains a bullish bias, supported by the prevailing upward trend. Recent intraday movement indicates a Bullish breakout above the consolidation zone, offering a potential setup for trend continuation.
Key Support Level: 0.5920 – previous consolidation range and pivotal support
Upside Targets:
0.6080 – initial resistance
0.6150 and 0.6180 – extended bullish targets on higher timeframes
A bullish reversal from 0.5920 would suggest continuation of the uptrend, confirming buying momentum.
However, a decisive break and daily close below 0.5920 would invalidate the bullish structure, opening the door for further retracement toward 0.5870, with additional support at 0.5830 and 0.5770.
Conclusion
NZDUSD remains bullish above 0.5920. A bounce from this level supports further gains. Traders should watch for confirmation signals before positioning for the next move.
This communication is for informational purposes only and should not be viewed as any form of recommendation as to a particular course of action or as investment advice. It is not intended as an offer or solicitation for the purchase or sale of any financial instrument or as an official confirmation of any transaction. Opinions, estimates and assumptions expressed herein are made as of the date of this communication and are subject to change without notice. This communication has been prepared based upon information, including market prices, data and other information, believed to be reliable; however, Trade Nation does not warrant its completeness or accuracy. All market prices and market data contained in or attached to this communication are indicative and subject to change without notice.

Compras Nzd, usd. R. MutuandiOn NZD/USD, we’re going to wait for clear structures (setups) that allow us to validate a buy entry. Those who decide to enter directly can do so at their own risk, but I suggest waiting and dropping to lower timeframes in order to get a better entry, maximize profits, and protect the trade as you've been taught. I see a favorable scenario for buys and I hope you can take advantage of it strategically to capture movement and generate profits. Patience, risk management, and precision.

SHORT ON NZD/USDNZD/USD Is currently at a major resistance level/zone and has created a double top or equal highs.
Price has started to fall a bit, but I do believe price will rise to take out the equal highs in a "Liquidity hunt"
Overall I am taking a market execution sell on NZD/USD to the next demand level looking to catch over 300+ pips.

Kiwi H4 | Bullish uptrend to extend further?The Kiwi (NZD/USD) is falling towards a pullback support and could potentially bounce off this level to climb higher.
Buy entry is at 0.5971 which is a pullback support.
Stop loss is at 0.5875 which is a level that lies underneath an overlap support and the 23.6% Fibonacci retracement.
Take profit is at 0.6082 which is a resistance level that aligns with the 161.8% Fibonacci extension.
High Risk Investment Warning
Trading Forex/CFDs on margin carries a high level of risk and may not be suitable for all investors. Leverage can work against you.
Stratos Markets Limited (tradu.com):
CFDs are complex instruments and come with a high risk of losing money rapidly due to leverage. 63% of retail investor accounts lose money when trading CFDs with this provider. You should consider whether you understand how CFDs work and whether you can afford to take the high risk of losing your money.
Stratos Europe Ltd (tradu.com):
CFDs are complex instruments and come with a high risk of losing money rapidly due to leverage. 63% of retail investor accounts lose money when trading CFDs with this provider. You should consider whether you understand how CFDs work and whether you can afford to take the high risk of losing your money.
Stratos Global LLC (tradu.com):
Losses can exceed deposits.
Please be advised that the information presented on TradingView is provided to Tradu (‘Company’, ‘we’) by a third-party provider (‘TFA Global Pte Ltd’). Please be reminded that you are solely responsible for the trading decisions on your account. There is a very high degree of risk involved in trading. Any information and/or content is intended entirely for research, educational and informational purposes only and does not constitute investment or consultation advice or investment strategy. The information is not tailored to the investment needs of any specific person and therefore does not involve a consideration of any of the investment objectives, financial situation or needs of any viewer that may receive it. Kindly also note that past performance is not a reliable indicator of future results. Actual results may differ materially from those anticipated in forward-looking or past performance statements. We assume no liability as to the accuracy or completeness of any of the information and/or content provided herein and the Company cannot be held responsible for any omission, mistake nor for any loss or damage including without limitation to any loss of profit which may arise from reliance on any information supplied by TFA Global Pte Ltd.
The speaker(s) is neither an employee, agent nor representative of Tradu and is therefore acting independently. The opinions given are their own, constitute general market commentary, and do not constitute the opinion or advice of Tradu or any form of personal or investment advice. Tradu neither endorses nor guarantees offerings of third-party speakers, nor is Tradu responsible for the content, veracity or opinions of third-party speakers, presenters or participants.

NZD_USD SHORT SIGNAL|
✅NZD_USD grew again
To retest the resistance of 0.6038
But it is a strong key level
So I think that there is a high chance
We will see a bearish pullback and a move down
Thus, we can enter a short trade
With the TP of 0.5953 and
The SL of 0.6042
SHORT🔥
✅Like and subscribe to never miss a new idea!✅
Disclosure: I am part of Trade Nation's Influencer program and receive a monthly fee for using their TradingView charts in my analysis.

NZDUSD to continue in the upward move?NZDUSD - 24h expiry
There is no indication that the rally is coming to an end.
Although we remain bullish overall, a correction is possible with plenty of room to move lower without impacting the trend higher.
Risk/Reward would be poor to call a buy from current levels.
A move through 0.6025 will confirm the bullish momentum.
The measured move target is 0.6075.
We look to Buy at 0.5950 (stop at 0.5900)
Our profit targets will be 0.6050 and 0.6075
Resistance: 0.6025 / 0.6050 / 0.6075
Support: 0.6000 / 0.5950 / 0.5925
Risk Disclaimer
The trade ideas beyond this page are for informational purposes only and do not constitute investment advice or a solicitation to trade. This information is provided by Signal Centre, a third-party unaffiliated with OANDA, and is intended for general circulation only. OANDA does not guarantee the accuracy of this information and assumes no responsibilities for the information provided by the third party. The information does not take into account the specific investment objectives, financial situation, or particular needs of any particular person. You should take into account your specific investment objectives, financial situation, and particular needs before making a commitment to trade, including seeking advice from an independent financial adviser regarding the suitability of the investment, under a separate engagement, as you deem fit.
You accept that you assume all risks in independently viewing the contents and selecting a chosen strategy.
Where the research is distributed in Singapore to a person who is not an Accredited Investor, Expert Investor or an Institutional Investor, Oanda Asia Pacific Pte Ltd (“OAP“) accepts legal responsibility for the contents of the report to such persons only to the extent required by law. Singapore customers should contact OAP at 6579 8289 for matters arising from, or in connection with, the information/research distributed.

NZDUSDPrice is Bullish and breaking structure to the upside im anticipating a pullback to take out liquidity and continue with the bullish trend

NZD-USD Will Fall! Sell!
Hello,Traders!
NZD-USD has retested a
Horizontal resistance level
Of 0.6036 so we are
Locally bearish biased
And from the resistance we
We will be expecting a
Local bearish correction
Sell!
Comment and subscribe to help us grow!
Check out other forecasts below too!
Disclosure: I am part of Trade Nation's Influencer program and receive a monthly fee for using their TradingView charts in my analysis.

NZD/USD For Bullishyou can go long now
or
wait for pull-back near by entry point and then go long
general trend is up trend
have fun :)
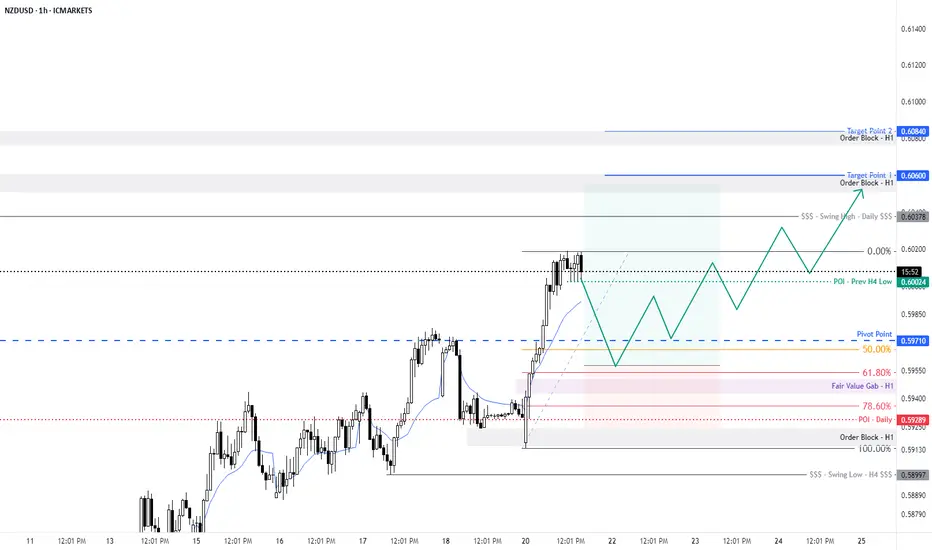

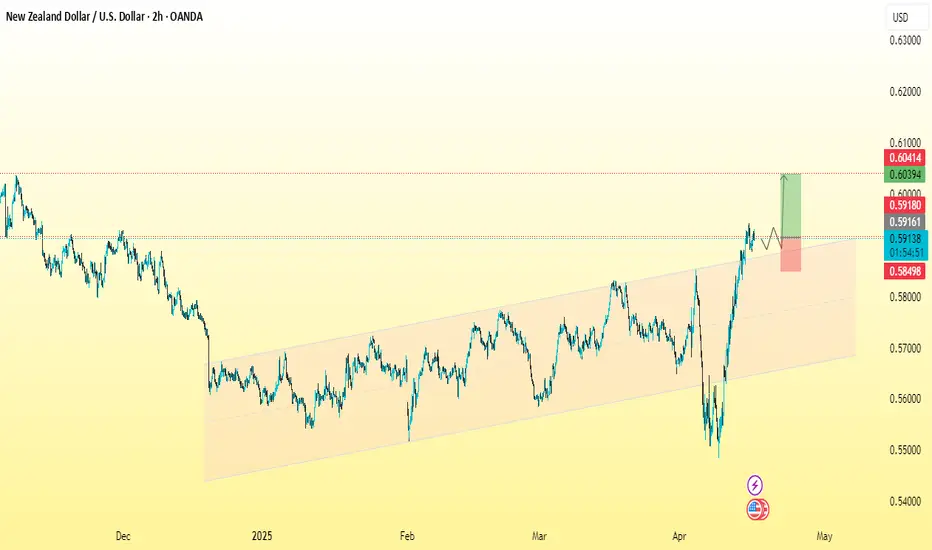
ZND/USD BUY SETUP 2H chart analysisEntry Point:
Around 0.59126 (highlighted by the black price action and small white ellipse)
Stop Loss (SL):
Around 0.58498, just below the channel and a previous support area.
Take Profit 1 (TP1):
Around 0.60414, which aligns with a previous resistance level and is near the top of the channel.
Final Target:
Likely around 0.6100, slightly above TP1 and just beyond the current visible range. This would be an extension beyond the last swing high and consistent with channel projection.
---
Support Levels
0.58498: Strong support (your SL zone) - price previously bounced here.
0.58000: Minor support - mid-channel zone.
0.57000: Previous horizontal support area.
0.55000: Last major low.
Resistance Levels
0.59119 - 0.59126: Current entry level, may act as short-term resistance.
0.60000: Psychological resistance.
0.60414: Your TP1 level and a clear historical resistance.
0.61000: Final target zone, key resistance area.
---
Summary
Bias: Bullish
Strategy: Buy on breakout/pullback to 0.59126, with TP at 0.60414 and final TP around 0.61000.
Risk Management: SL below the channel and last support zone at 0.58498.
Bearish reversal off overlap resistance?The Kiwi (NZD/USD) is rising towards the pivot and could reverse to the pullback support.
Pivot: 0.5987
1st Support: 0.5831
1st Resistance: 0.6125
Risk Warning:
Trading Forex and CFDs carries a high level of risk to your capital and you should only trade with money you can afford to lose. Trading Forex and CFDs may not be suitable for all investors, so please ensure that you fully understand the risks involved and seek independent advice if necessary.
Disclaimer:
The above opinions given constitute general market commentary, and do not constitute the opinion or advice of IC Markets or any form of personal or investment advice.
Any opinions, news, research, analyses, prices, other information, or links to third-party sites contained on this website are provided on an "as-is" basis, are intended only to be informative, is not an advice nor a recommendation, nor research, or a record of our trading prices, or an offer of, or solicitation for a transaction in any financial instrument and thus should not be treated as such. The information provided does not involve any specific investment objectives, financial situation and needs of any specific person who may receive it. Please be aware, that past performance is not a reliable indicator of future performance and/or results. Past Performance or Forward-looking scenarios based upon the reasonable beliefs of the third-party provider are not a guarantee of future performance. Actual results may differ materially from those anticipated in forward-looking or past performance statements. IC Markets makes no representation or warranty and assumes no liability as to the accuracy or completeness of the information provided, nor any loss arising from any investment based on a recommendation, forecast or any information supplied by any third-party.

NZD-USD Free Signal! Buy!
Hello,Trades!
NZD-USD made a bullish
Breakout of the key horizontal
Level around 0.5920 then
Made a pullback to retest
The new support so we are
Bullish biased which means
We can enter a long trade
On Monday with the Take
Profit of 0.5968 and the
Stop Loss of 0.5893
Buy!
Comment and subscribe to help us grow!
Check out other forecasts below too!
Disclosure: I am part of Trade Nation's Influencer program and receive a monthly fee for using their TradingView charts in my analysis.

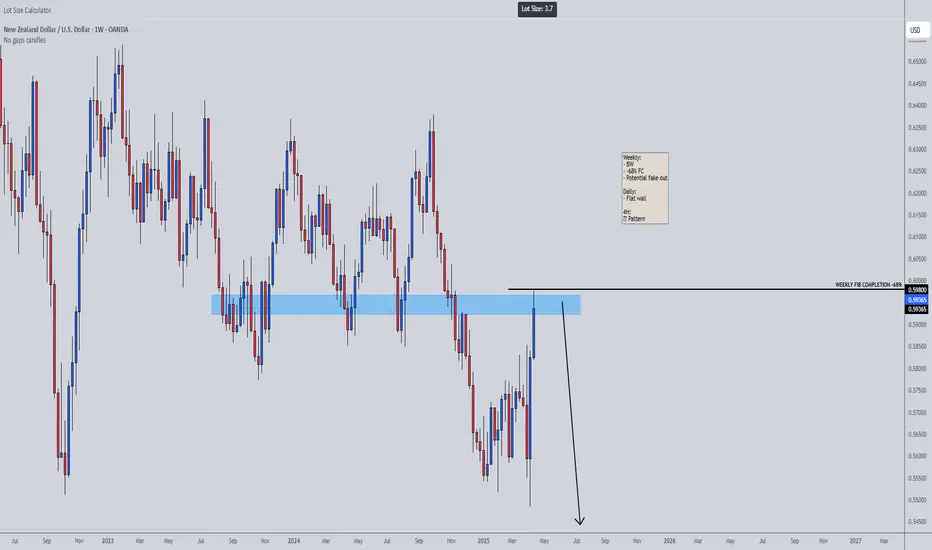
buy to sell model...a buy to sell model...this is my analysis on nzdusd...im anticipating a massive selling..dyor btw...lets see how it plays out

NZDUSD Trading Opportunity! SELL!
My dear friends,
Please, find my technical outlook for NZDUSD below:
The price is coiling around a solid key level - 0.5971
Bias - Bearish
Technical Indicators: Pivot Points Low anticipates a potential price reversal.
Super trend shows a clear sell, giving a perfect indicators' convergence.
Goal - 0.5847
Safe Stop Loss - 0.6013
About Used Indicators:
The pivot point itself is simply the average of the high, low and closing prices from the previous trading day.
Disclosure: I am part of Trade Nation's Influencer program and receive a monthly fee for using their TradingView charts in my analysis.
———————————
WISH YOU ALL LUCK

NZD_USD WILL KEEP GROWING|LONG|
✅NZD_USD is trading in an
Uptrend and the pair made a
Strong bullish breakout of the
Key horizontal level of 0.5927
Which is a support now and the
Breakout is confirmed so we
Will be expecting a further
Bullish continuation
LONG🚀
✅Like and subscribe to never miss a new idea!✅
Disclosure: I am part of Trade Nation's Influencer program and receive a monthly fee for using their TradingView charts in my analysis.

Price action Nzd kept price in range it moved up because of aud not completing it wave formation it's done collecting liquidity

18.04.25 Morning ForecastPairs on Watch -
FX:NZDUSD
FX:AUDUSD
FX:EURNZD
FX:USDJPY
A short overview of the instruments I am looking at for today, multi-timeframe analysis down to what I will be looking at for an entry. Enjoy!

NZDUSDselling NZDUSD
sl 0.59827
tp 0.59400
1% risk each trade
like an follow me
short on NZD/USD
NOTE: Skilled traders lose their capital if they do not manage risk.
The trader should first focus
on protecting his capital before
trying to make a profit.
