NZD/USD BEARS ARE STRONG HERE|SHORT
Hello, Friends!
The BB upper band is nearby so NZD-USD is in the overbought territory. Thus, despite the uptrend on the 1W timeframe I think that we will see a bearish reaction from the resistance line above and a move down towards the target at around 0.556.
✅LIKE AND COMMENT MY IDEAS✅
NZDUSD trade ideas

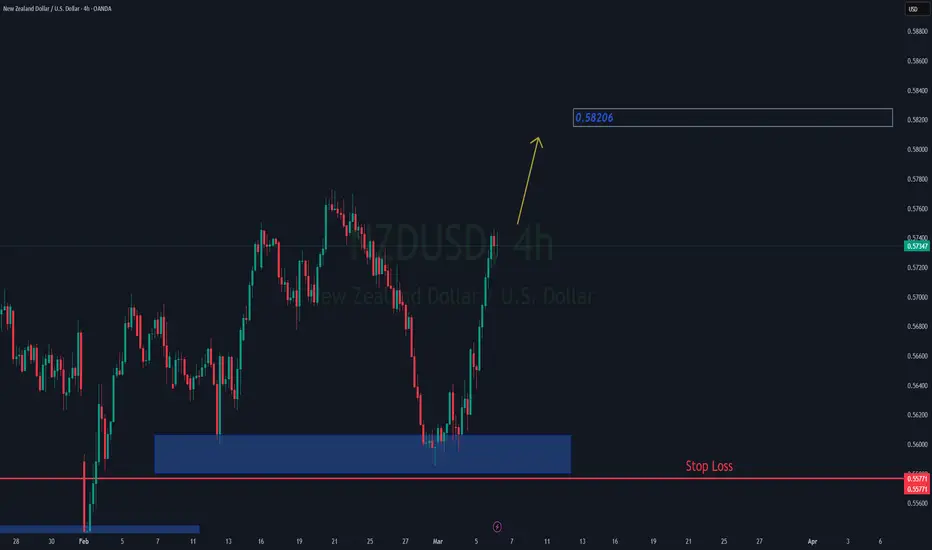
Kiwi H1 | Potential bullish bounceThe Kiwi (NZD/USD) is falling towards a swing-low support and could potentially bounce off this level to climb higher.
Buy entry is at 0.5707 which is a swing-low support that aligns with the 61.8% Fibonacci retracement.
Stop loss is at 0.5682 which is a level that lies underneath a swing-low support and the 38.2% Fibonacci retracement.
Take profit is at 0.5752 which is a swing-high resistance.
High Risk Investment Warning
Trading Forex/CFDs on margin carries a high level of risk and may not be suitable for all investors. Leverage can work against you.
Stratos Markets Limited (www.fxcm.com):
CFDs are complex instruments and come with a high risk of losing money rapidly due to leverage. 63% of retail investor accounts lose money when trading CFDs with this provider. You should consider whether you understand how CFDs work and whether you can afford to take the high risk of losing your money.
Stratos Europe Ltd (www.fxcm.com):
CFDs are complex instruments and come with a high risk of losing money rapidly due to leverage. 63% of retail investor accounts lose money when trading CFDs with this provider. You should consider whether you understand how CFDs work and whether you can afford to take the high risk of losing your money.
Stratos Trading Pty. Limited (www.fxcm.com):
Trading FX/CFDs carries significant risks. FXCM AU (AFSL 309763), please read the Financial Services Guide, Product Disclosure Statement, Target Market Determination and Terms of Business at www.fxcm.com
Stratos Global LLC (www.fxcm.com):
Losses can exceed deposits.
Please be advised that the information presented on TradingView is provided to FXCM (‘Company’, ‘we’) by a third-party provider (‘TFA Global Pte Ltd’). Please be reminded that you are solely responsible for the trading decisions on your account. There is a very high degree of risk involved in trading. Any information and/or content is intended entirely for research, educational and informational purposes only and does not constitute investment or consultation advice or investment strategy. The information is not tailored to the investment needs of any specific person and therefore does not involve a consideration of any of the investment objectives, financial situation or needs of any viewer that may receive it. Kindly also note that past performance is not a reliable indicator of future results. Actual results may differ materially from those anticipated in forward-looking or past performance statements. We assume no liability as to the accuracy or completeness of any of the information and/or content provided herein and the Company cannot be held responsible for any omission, mistake nor for any loss or damage including without limitation to any loss of profit which may arise from reliance on any information supplied by TFA Global Pte Ltd.
The speaker(s) is neither an employee, agent nor representative of FXCM and is therefore acting independently. The opinions given are their own, constitute general market commentary, and do not constitute the opinion or advice of FXCM or any form of personal or investment advice. FXCM neither endorses nor guarantees offerings of third-party speakers, nor is FXCM responsible for the content, veracity or opinions of third-party speakers, presenters or participants.

NZDUSD will continuing to grow after the correctionNZDUSD is BULLISH on daily timeframe and after the correction will continue to grow, moreover the RSI is overbought

Market Analysis: NZD/USD Could Continue HigherMarket Analysis: NZD/USD Could Continue Higher
NZD/USD is showing positive signs and might attempt a fresh increase above 0.5720.
Important Takeaways for NZD USD Analysis Today
- NZD/USD is holding gains above the 0.5695 support zone.
- There was a break below a major bullish trend line with support at 0.5720 on the hourly chart of NZD/USD at FXOpen.
NZD/USD Technical Analysis
On the hourly chart of NZD/USD on FXOpen, the pair started a steady increase from the 0.5585 zone. The New Zealand Dollar broke the 0.5635 resistance to start the recent increase against the US Dollar.
The pair settled above 0.5695 and the 50-hour simple moving average. It tested the 0.5760 zone and is currently correcting gains. The pair corrected lower below the 0.5720 level. The pair also traded below the 23.6% Fib retracement level of the upward wave from the 0.5595 swing low to the 0.5759 high.
Besides, there was a break below a major bullish trend line with support at 0.5720. The NZD/USD chart suggests that the RSI is now below 50. On the downside, there is major support forming near 0.5695.
The next major support is near the 61.8% Fib retracement level of the upward wave from the 0.5595 swing low to the 0.5759 high at 0.5660.
If there is a downside break below the 0.5660 support, the pair might slide toward the 0.5635 support. Any more losses could lead NZD/USD in a bearish zone to 05585.
On the upside, the pair might struggle near 0.5720. The next major resistance is near the 0.5760 level. A clear move above the 0.5760 level might even push the pair toward the 0.5800 level. Any more gains might clear the path for a move toward the 0.5840 resistance zone in the coming days.
Trade on TradingView with FXOpen. Consider opening an account and access over 700 markets with tight spreads from 0.0 pips and low commissions from $1.50 per lot.
This article represents the opinion of the Companies operating under the FXOpen brand only. It is not to be construed as an offer, solicitation, or recommendation with respect to products and services provided by the Companies operating under the FXOpen brand, nor is it to be considered financial advice.

NZDUSDThe price has touched this base once and is now unable to fall, so I expect the price to rise above the upper base.

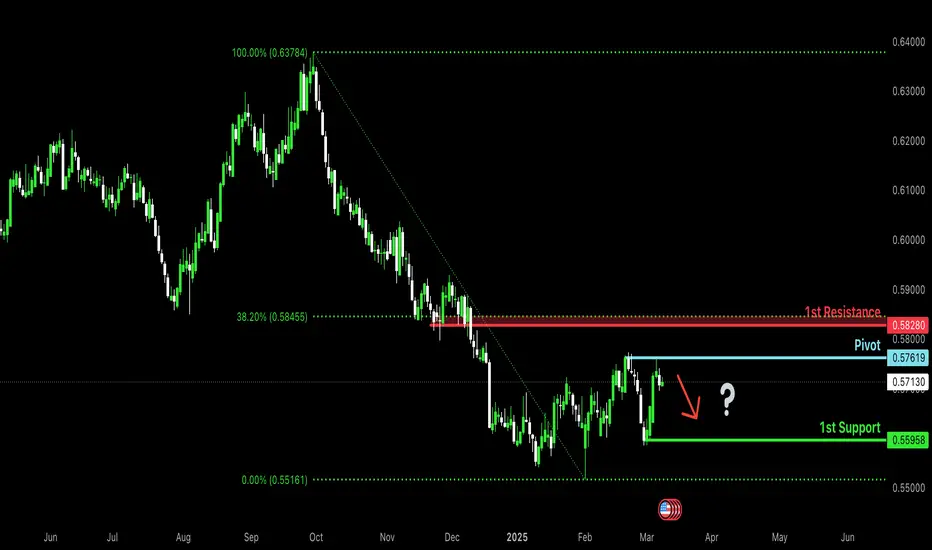
Bearish drop?The Kiwi (NZD/USD) has reacted off the pivot and could drop to the 1st support.
Pivot: 0.5761
1st Support: 0.5595
1st Resistance: 0.5828
Risk Warning:
Trading Forex and CFDs carries a high level of risk to your capital and you should only trade with money you can afford to lose. Trading Forex and CFDs may not be suitable for all investors, so please ensure that you fully understand the risks involved and seek independent advice if necessary.
Disclaimer:
The above opinions given constitute general market commentary, and do not constitute the opinion or advice of IC Markets or any form of personal or investment advice.
Any opinions, news, research, analyses, prices, other information, or links to third-party sites contained on this website are provided on an "as-is" basis, are intended only to be informative, is not an advice nor a recommendation, nor research, or a record of our trading prices, or an offer of, or solicitation for a transaction in any financial instrument and thus should not be treated as such. The information provided does not involve any specific investment objectives, financial situation and needs of any specific person who may receive it. Please be aware, that past performance is not a reliable indicator of future performance and/or results. Past Performance or Forward-looking scenarios based upon the reasonable beliefs of the third-party provider are not a guarantee of future performance. Actual results may differ materially from those anticipated in forward-looking or past performance statements. IC Markets makes no representation or warranty and assumes no liability as to the accuracy or completeness of the information provided, nor any loss arising from any investment based on a recommendation, forecast or any information supplied by any third-party.
NZD/USDOn Daily,
it clearly pulling back from impulsive Bearish move for a long time. In the Rising Wedge OR it can be a reversal the previous Bullish move did't reach the previous high.
this means that it might go back down one more time.
On the lower time frame, 10Minutes, it seems, it's pulling back "Correction" . If the trend line breaks and confirms, I would consider going Bearish.

NZDUSD Short/Sell IdeaNZDUSD appears to be retracing to the downside. Although the US dollar has been underperforming of late, I do believe NZDUSD has more room to drop especially given the economic uncertainties we're currently facing against the backdrop of Donald Trump's tariff wars.

NZD-USD Risky Long! Buy!
Hello,Traders!
NZD-USD made a retest
Of the horizontal support
Level 0.5687 and we are
Already seeing a local
Bullish reaction so we
Are locally bullish baised
And we will be expecting
A further bullish move up
Buy!
Comment and subscribe to help us grow!
Check out other forecasts below too!

NZDUSD ShortPrice on the LTF has takeout 2 key demand zones and this is a sign of a change of direction giving us the bearish sentiment.

Sell NZDUSDNzdusd perfect sell setup, making clear low levels
if we sell these level we can make good profit.

Elliott Waves in NZD/USD – A Bullish Outlook 📊 NZD/USD Technical Analysis Based on Elliott Waves
The NZD/USD market is in a short- and mid-term uptrend and is currently completing its fifth Elliott wave.
📍 Key Support Level: 0.56880
✅ As long as this level holds, the price can continue its bullish movement toward 0.58000.
🔹 If this support level is broken, the Elliott wave structure may change. So, always consider risk management!
📊 What’s your view on this analysis? Do you agree with this outlook? Share your thoughts in the comments! 👇

NZD_USD LOCAL LONG|
✅NZD_USD will soon retest a key support level of 0.5690
So I think that the pair will make a rebound
And go up to retest the supply level above at 0.5730
LONG🚀
✅Like and subscribe to never miss a new idea!✅

NZDUSD Ready for a Bullish MoveHello Traders
In This Chart NZDUSD HOURLY Forex Forecast By FOREX PLANET
today NZDUSD analysis 👆
🟢This Chart includes_ (NZDUSD market update)
🟢What is The Next Opportunity on NZDUSD Market
🟢how to Enter to the Valid Entry With Assurance Profit
This CHART is For Trader's that Want to Improve Their Technical Analysis Skills and Their Trading By Understanding How To Analyze The Market Using Multiple Timeframes and Understanding The Bigger Picture on the Charts
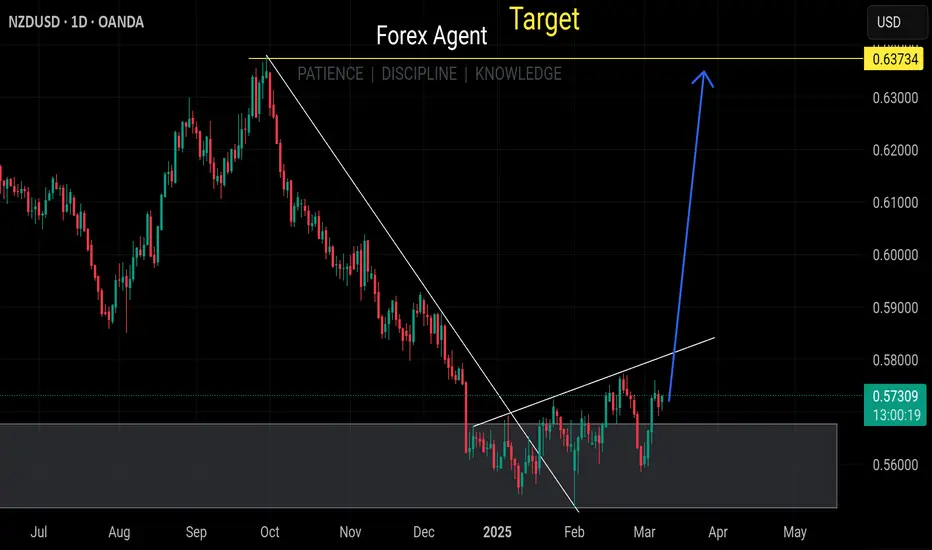
NZDUSD OBEYING ELLIOTT WAVEThe move numbered in Red from the top of the screen is an on-going 5 Wave move that obeys Elliott Wave principles. The wave is Mathematically backed by the Fibonacci Sequence. A Zigzag formed the Wave 2 and a Flat would form the Wave 4 as shown. Though on-going, moves can be predicted using Elliott Wave from beginning to their ends. The NZDUSD is not immune to the Laws of Nature.

NZDUSD Update H4 LongRemember, successful trading relies on proper risk management and a disciplined approach. Use stop-losses to safeguard your assets and carefully plan each trade. Analysis is the key to making informed decisions. Stay updated and continue refining your strategies!

Bullish bounce?The Kiwi (NZD/USD) is falling towards the support level which is an overlap support that aligns with the 38.2% Fibonacci retracement and could bounce from this level to the upside.

#049 Trust The Process NZDUSD Short 1230SGT 07032025Shorting with the trend.
1233SGT 07032025
Talk too much makes one think too much which causes people to keep changing their strategy and in the end go stray.
amen.
1234SGT 07032025
sadhu.

Potential bearish reversal?The Kiwi (NZD/USD) has reacted off the pivot and could drop to the 38.2% Fibonacci support.
Pivot: 0.5744
1st Support: 0.5693
1st Resistance: 0.5773
Risk Warning:
Trading Forex and CFDs carries a high level of risk to your capital and you should only trade with money you can afford to lose. Trading Forex and CFDs may not be suitable for all investors, so please ensure that you fully understand the risks involved and seek independent advice if necessary.
Disclaimer:
The above opinions given constitute general market commentary, and do not constitute the opinion or advice of IC Markets or any form of personal or investment advice.
Any opinions, news, research, analyses, prices, other information, or links to third-party sites contained on this website are provided on an "as-is" basis, are intended only to be informative, is not an advice nor a recommendation, nor research, or a record of our trading prices, or an offer of, or solicitation for a transaction in any financial instrument and thus should not be treated as such. The information provided does not involve any specific investment objectives, financial situation and needs of any specific person who may receive it. Please be aware, that past performance is not a reliable indicator of future performance and/or results. Past Performance or Forward-looking scenarios based upon the reasonable beliefs of the third-party provider are not a guarantee of future performance. Actual results may differ materially from those anticipated in forward-looking or past performance statements. IC Markets makes no representation or warranty and assumes no liability as to the accuracy or completeness of the information provided, nor any loss arising from any investment based on a recommendation, forecast or any information supplied by any third-party.

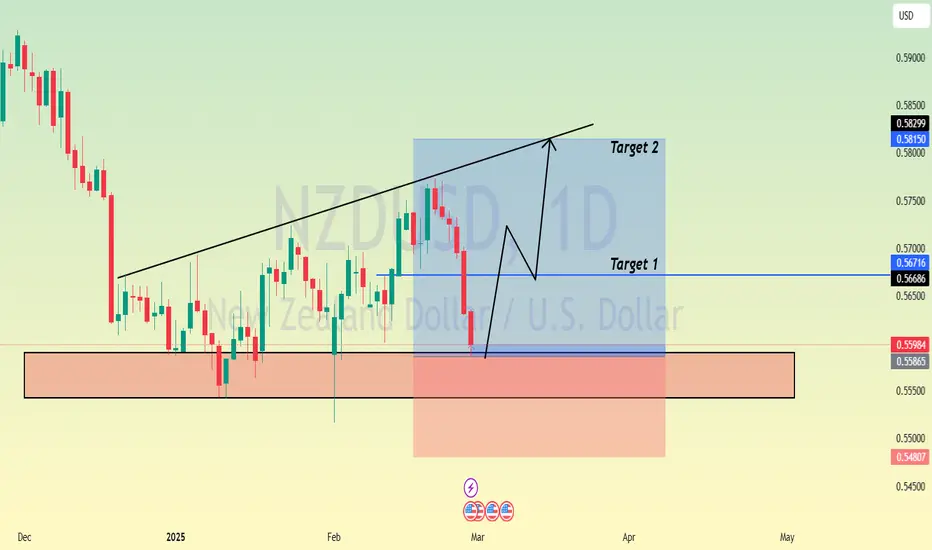
$NZDUSD Trade Idea that clicked inSerie Of Higher high On 30Min, 1hour and 4 hour timeframes
Break Of Structure (BOS) of the Trendline.
I waited for my confirmation trend continuation candle on the lower time frame (30min)
I put 2 trendlines on the body of the first blue candle
Since I see that the price CLOSE higher than the trendline of the Higher Body Length, I went Long with a StopLoss at the yellow trendline (4 Hour Trendline)
Take Profit at Fibonacci Extension -127% (100pips)
That was my first confirmation, I took a second trade at my second confirmation
When the price retraced to Fib Retracement 38.6%, I adjusted SL but when I saw that it didn't break 50% but just tested it, I put another Long position. Small stop loss hunt institutions.
it was another confirmation of the uptrend (while adjusting the SL to 78.6%)
Finally, my last confirmation was my Moving averages (Blue over red signal uptrend)
I could have added other indicators but , my trade idea was already in motion with strong confirmations already
3 positions, 1 trade, 267 pips
100 pips
81 pips
86 pips
SL was 15 pips in the red so, very low downside for big upside . Opaah !
1 day and 1 hour of holding.

NZDUSD Update H4 LongRemember, successful trading relies on proper risk management and a disciplined approach. Use stop-losses to safeguard your assets and carefully plan each trade. Analysis is the key to making informed decisions. Stay updated and continue refining your strategies!
Kiwi D1 | Heading into swing-high resistanceThe Kiwi (NZD/USD) is rising towards a swing-high resistance and could potentially reverse off this level to drop lower.
Sell entry is at 0.5761 which is a swing-high resistance.
Stop loss is at 0.5838 which is a level that sits above the 127.2% Fibonacci extension level and a pullback resistance.
Take profit is at 0.5653 which is an overlap support.
High Risk Investment Warning
Trading Forex/CFDs on margin carries a high level of risk and may not be suitable for all investors. Leverage can work against you.
Stratos Markets Limited (www.fxcm.com):
CFDs are complex instruments and come with a high risk of losing money rapidly due to leverage. 63% of retail investor accounts lose money when trading CFDs with this provider. You should consider whether you understand how CFDs work and whether you can afford to take the high risk of losing your money.
Stratos Europe Ltd (www.fxcm.com):
CFDs are complex instruments and come with a high risk of losing money rapidly due to leverage. 63% of retail investor accounts lose money when trading CFDs with this provider. You should consider whether you understand how CFDs work and whether you can afford to take the high risk of losing your money.
Stratos Trading Pty. Limited (www.fxcm.com):
Trading FX/CFDs carries significant risks. FXCM AU (AFSL 309763), please read the Financial Services Guide, Product Disclosure Statement, Target Market Determination and Terms of Business at www.fxcm.com
Stratos Global LLC (www.fxcm.com):
Losses can exceed deposits.
Please be advised that the information presented on TradingView is provided to FXCM (‘Company’, ‘we’) by a third-party provider (‘TFA Global Pte Ltd’). Please be reminded that you are solely responsible for the trading decisions on your account. There is a very high degree of risk involved in trading. Any information and/or content is intended entirely for research, educational and informational purposes only and does not constitute investment or consultation advice or investment strategy. The information is not tailored to the investment needs of any specific person and therefore does not involve a consideration of any of the investment objectives, financial situation or needs of any viewer that may receive it. Kindly also note that past performance is not a reliable indicator of future results. Actual results may differ materially from those anticipated in forward-looking or past performance statements. We assume no liability as to the accuracy or completeness of any of the information and/or content provided herein and the Company cannot be held responsible for any omission, mistake nor for any loss or damage including without limitation to any loss of profit which may arise from reliance on any information supplied by TFA Global Pte Ltd.
The speaker(s) is neither an employee, agent nor representative of FXCM and is therefore acting independently. The opinions given are their own, constitute general market commentary, and do not constitute the opinion or advice of FXCM or any form of personal or investment advice. FXCM neither endorses nor guarantees offerings of third-party speakers, nor is FXCM responsible for the content, veracity or opinions of third-party speakers, presenters or participants.
