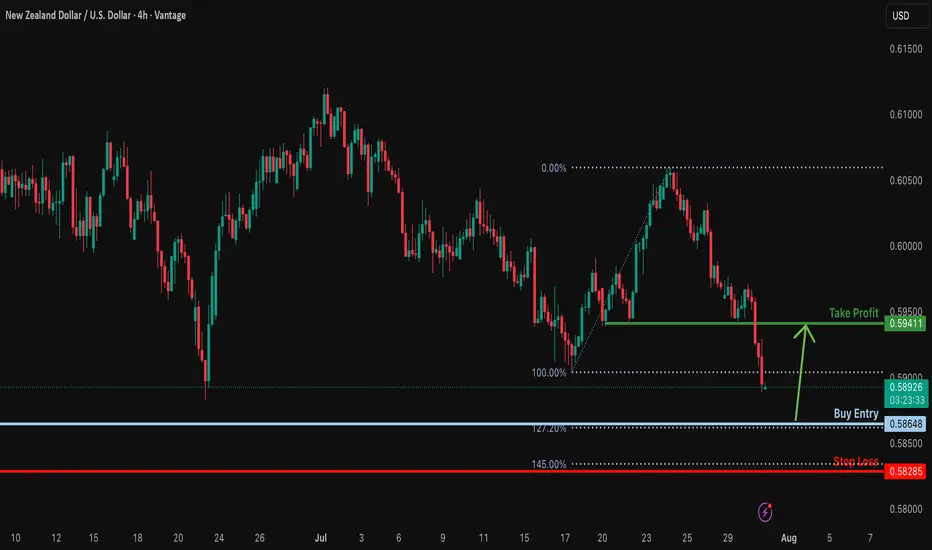
Bullish reversal?NZD/USD is falling towards the support level, which is a swing low support that lines up with the 127.2% Fibonacci extension. Could NZD/USD bounce from this level to our take profit?
Entry: 0.5864
Why we like it:
There is a swing low support that lines up with the 127.2% Fibonacci extension.
Stop loss: 0.5828
Why we like it:
There is a pullback support that lines up with the 145% Fibonacci extension.
Takeprofit: 0.5941
Why we like it:
There is a pullback resistance level.
Enjoying your TradingView experience? Review us!
Please be advised that the information presented on TradingView is provided to Vantage (‘Vantage Global Limited’, ‘we’) by a third-party provider (‘Everest Fortune Group’). Please be reminded that you are solely responsible for the trading decisions on your account. There is a very high degree of risk involved in trading. Any information and/or content is intended entirely for research, educational and informational purposes only and does not constitute investment or consultation advice or investment strategy. The information is not tailored to the investment needs of any specific person and therefore does not involve a consideration of any of the investment objectives, financial situation or needs of any viewer that may receive it. Kindly also note that past performance is not a reliable indicator of future results. Actual results may differ materially from those anticipated in forward-looking or past performance statements. We assume no liability as to the accuracy or completeness of any of the information and/or content provided herein and the Company cannot be held responsible for any omission, mistake nor for any loss or damage including without limitation to any loss of profit which may arise from reliance on any information supplied by Everest Fortune Group.
NZDUSD trade ideas

NZDUSD potential 600 pips in makingPrice of NZDUSD have made a structure that has a high probability to be a triangle just after a leading diagonal. If this view is favored then we should expect price to regain its bullish momentum to make wave C. To take advantage of this possibility a trade should find areas of support to go long. One of the places is as marked on the chart on lower trendline of the triangle.

NZDUSD: Market Sentiment & Price Action
Looking at the chart of NZDUSD right now we are seeing some interesting price action on the lower timeframes. Thus a local move up seems to be quite likely.
Disclosure: I am part of Trade Nation's Influencer program and receive a monthly fee for using their TradingView charts in my analysis.
❤️ Please, support our work with like & comment! ❤️

NZDUSD long trade dated 29 July 2025- Breakout of last LH will suggest that the odds are in favour of the long trade
- Presence of a bullish AB=CD pattern increases our chances. However entry set via Buy Stop after confirmed trend reversal

NZDUSDT Long Looking to enter NZD/USD around 0.59250 at the Order Block due to a liquidity inducement zone and potential Market Structure Shift (MSS).

NZDUSD LongNZDUSD broke the initial downtrend structure channel , which is where we started looking for buying opportunities.
the pair then created a retracement move.
it then created a reversal head and shoulders pattern.
signalling a move to the the upside again.

NZDUSD is forming an upward cycle trendKiwi dollar is strong at the moment.
It is in an upward trend. If the trend completes 2 cycles and maintains the upward trajectory, I will get in the trade as a Long/Buy.
Patiently watching if the trend continues or breaks down.

Kiwi H4 | Potential bullish bounceThe Kiwi (NZD/USD) is falling towards a pullback support and could potentially bounce off this level to climb higher.
Buy entry is at 0.6032 which is a pullback support.
Stop loss is at 0.5985 which is a level that lies underneath a pullback support and the 38.2% Fibonacci retracement.
Take profit is at 0.6078 which is a pullback resistance that aligns closely with the 78.6% Fibonacci retracement.
High Risk Investment Warning
Trading Forex/CFDs on margin carries a high level of risk and may not be suitable for all investors. Leverage can work against you.
Stratos Markets Limited (tradu.com ):
CFDs are complex instruments and come with a high risk of losing money rapidly due to leverage. 66% of retail investor accounts lose money when trading CFDs with this provider. You should consider whether you understand how CFDs work and whether you can afford to take the high risk of losing your money.
Stratos Europe Ltd (tradu.com ):
CFDs are complex instruments and come with a high risk of losing money rapidly due to leverage. 66% of retail investor accounts lose money when trading CFDs with this provider. You should consider whether you understand how CFDs work and whether you can afford to take the high risk of losing your money.
Stratos Global LLC (tradu.com ):
Losses can exceed deposits.
Please be advised that the information presented on TradingView is provided to Tradu (‘Company’, ‘we’) by a third-party provider (‘TFA Global Pte Ltd’). Please be reminded that you are solely responsible for the trading decisions on your account. There is a very high degree of risk involved in trading. Any information and/or content is intended entirely for research, educational and informational purposes only and does not constitute investment or consultation advice or investment strategy. The information is not tailored to the investment needs of any specific person and therefore does not involve a consideration of any of the investment objectives, financial situation or needs of any viewer that may receive it. Kindly also note that past performance is not a reliable indicator of future results. Actual results may differ materially from those anticipated in forward-looking or past performance statements. We assume no liability as to the accuracy or completeness of any of the information and/or content provided herein and the Company cannot be held responsible for any omission, mistake nor for any loss or damage including without limitation to any loss of profit which may arise from reliance on any information supplied by TFA Global Pte Ltd.
The speaker(s) is neither an employee, agent nor representative of Tradu and is therefore acting independently. The opinions given are their own, constitute general market commentary, and do not constitute the opinion or advice of Tradu or any form of personal or investment advice. Tradu neither endorses nor guarantees offerings of third-party speakers, nor is Tradu responsible for the content, veracity or opinions of third-party speakers, presenters or participants.

NZDUSD LTF Triangle being formedNZDUSD is going up in all TF's.
A very small triangle is spotted in this case, we will wait for break to the upside to enter into the market.

NZDUSD Wave Analysis – 23 July 2025
- NZDUSD reversed from support zone
- Likely to rise to resistance level 0.6100
NZDUSD recently reversed up from the support zone located between the key support level 0.5920 (which stopped wave 4in the middle of June), lower daily Bollinger Band and the support trendline of the daily up channel from April.
The upward reversal from this support zone started the active intermediate correction (2).
Given the clear daily uptrend, NZDUSD can be expected to rise to the next resistance level 0.6100, target price for the completion of the active correction (2) (which has been reversing the price from June).

NZDUSD – Critical Price Action Ahead! (July 23 Analysis)NZDUSD – Critical Price Action Ahead! (July 23 Analysis)
As shown in the chart, NZDUSD has broken above a long-term descending trendline, followed by a pullback that successfully retested the trendline as support. This retest was backed by strong demand, preventing further decline.
However, price is now facing another descending trendline resistance, around the 0.61000 zone — a level that aligns with a previous key supply area.
🔍 If this resistance is broken on lower timeframes with a valid bullish confirmation, the next target could be 0.62000.
❗ But if the pair gets rejected at 0.61000, watch for possible support reactions at 0.59800 and 0.58700.
📈 This is a make-or-break zone for NZDUSD — stay sharp and don’t miss the next move!
👉 Follow for more clean, technical setups and real-time updates on major forex pairs.

Short NUAlthough now towards at the end of the week, I am gonna risk this entry as the setup looks okay, and currently the US is running strong in other pairs.
Bullish Continuation..?Resistance 1 Can touch 0.60443
Resistance 2 Can touch 0.60819
Resistance 3 Can touch 0.61210
Support 1 Can touch 0.60038
Support 2 Can touch 0.59968
Support 3 Can touch 0.59756
Disclaimer:
Trading foreign exchange (Forex) on margin involves a high level of risk and may not be suitable for all investors. The use of leverage can work both for and against you. Before deciding to participate in the Forex market, you should carefully consider your investment objectives, level of experience, and risk tolerance.
There is a possibility that you may incur a loss of some or all of your initial investment, and therefore, you should not invest money that you cannot afford to lose. Be fully aware of all the risks associated with foreign exchange trading, and seek advice from a licensed and independent financial advisor if you have any doubts.
Past performance is not indicative of future results. Always trade responsibly.

Buy and sell level nzdusd Now more buy side expected
Our marked sell level much strong to change the trend
Wait first to sweep high then sell after confirmation

NZDUSD BUY OPPORTUNITY Price provides a buy opportunity in the H4 timeframe after breaking the neckline of the double button pattern that’s being formed around the key level of 0.59089 a buy opportunity is envisaged from the current market price.

NZDUSD Sell Stop SetupNZDUSD is in a clear downtrend, forming lower highs and lower lows. A sell stop is placed below the recent support to confirm bearish continuation.
Sell Stop: 0.59
Stop Loss (SL): 0.60
Take Profit 1 (TP1): 0.58
Take Profit 2 (TP2): 0.57
Waiting for price activation to validate the setup.

NZD/USD - Market OverviewNZD/USD saw modest gains, but upside momentum remained limited as market sentiment stayed cautious amid renewed tariff threats from Trump ahead of the February 1 deadline.
On Thursday, President Trump stated he would soon decide whether to exempt Canadian and Mexican oil imports from the 25% tariffs set to take effect on Saturday.
He also reiterated that additional tariffs on Chinese goods remain under consideration due to concerns over China's role in the fentanyl trade.
As of (GMT 06:09), the Kiwi dollar was up 0.19%, trading at 0.5646 against the U.S. dollar.
Key technical levels:
Resistance: Immediate resistance is seen at 0.5673 (38.2% Fib); a break above this level could drive the pair towards 0.5720 (50% Fib).
Support: The nearest support is at 0.5630 (38.2% Fib), with a break below exposing downside potential towards 0.5573 (23.6% Fib).
📉 Trade Setup:
🔹 Sell around 0.5660
🔹 Stop-loss: 0.5700
🔹 Target: 0.5550

NZDUSD Is a Short-Term Rebound on the Table?NZD/USD is down nearly 0.4% in Tuesday’s European session, trading near the key support area of 0.5940 — a confluence of the 0.5 Fibonacci retracement and the midline of a descending channel. The pair is pressured by rising expectations that the RBNZ may cut rates in August, while the USD remains volatile amid uncertainty surrounding trade talks between the US and its key partners.
🔍 Technical Overview – Structure & Momentum
✅ Overall Trend: Bearish short-term (descending channel)
✅ Current Structure: Price is testing key technical support at 0.5940
✅ Volume Profile: VPOC and upper supply zones remain key targets on a bounce
NZD/USD continues to respect the bearish channel structure. However, the support zone at 0.5940 (Fibo 0.5 + recent demand) is showing signs of holding. If price sustains above this level, a bullish correction toward the 0.6006 and 0.6040 supply zones is a valid scenario.
🧭 Trade Scenarios
🔸 Bullish Short-Term Scenario (if 0.5940 holds):
Entry: Buy around 0.5940
TP1: 0.60064 (VPOC + supply zone)
TP2: 0.60400 (OBS sell zone)
SL: Below 0.5905 (sell-side liquidity break)
🔹 Bearish Continuation (if support breaks):
A clean break below 0.5905 confirms downside continuation
Look for retest and short entries targeting deeper channel lows (0.586x–0.583x)
⚠️ Macro Risk Drivers
Growing expectations of an RBNZ rate cut in August
Ongoing US trade negotiation uncertainty with key partners
Potential USD volatility around upcoming macroeconomic releases
📌 Key Price Levels to Watch
Technical Support 0.5940 Fibo 0.5 + mid-channel
Sell-Side Liquidity 0.5905 Bearish confirmation if broken
VPOC + Supply Zone 0.60064 First upside target
OBS Sell Zone 0.60400 Final bullish target / resistance
💬 The descending channel remains in control, but 0.5940 could be the key pivot. Wait for confirmation before entering, and watch volume closely.

NZDUSD Buy C setupHello traders this is a nice setup but it doesn't have that much confluence!!
Clear!!
Not sweet because of how far the pivot point is from my Sl.
we aslo have a weak Head and Shoulders at the bottom I hope you can see it.
NZDUSD SELLBy utilizing levels, historical patterns, we can formulate a hypothesis that the market might follow a similar trajectory if bearish sentiment prevails.

Break Even Here Please The market has moved some pips from our original entry, its well advised to breakeven and take a chill for the day.
I hope you enjoy my setup so far. It's simple and easy to understand.

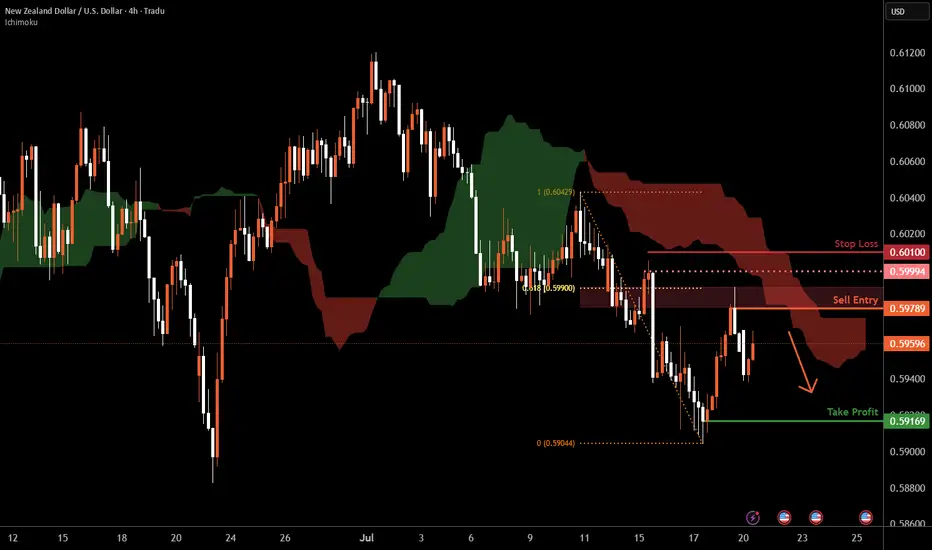
Kiwi H4 | Swing-high resistance at 61.8% Fibonacci retracementThe Kiwi (NZD/USD) is rising towards a swing-high resistance and could potentially reverse off this level to drop lower.
Sell entry is at 0.5978 which is a swing-high resistance that aligns closely with the 61.8% Fibonacci retracement.
Stop loss is at 0.6010 which is a level that sits above a swing-high resistance.
Take profit is at 0.5916 which is a swing-low support.
High Risk Investment Warning
Trading Forex/CFDs on margin carries a high level of risk and may not be suitable for all investors. Leverage can work against you.
Stratos Markets Limited (tradu.com ):
CFDs are complex instruments and come with a high risk of losing money rapidly due to leverage. 66% of retail investor accounts lose money when trading CFDs with this provider. You should consider whether you understand how CFDs work and whether you can afford to take the high risk of losing your money.
Stratos Europe Ltd (tradu.com ):
CFDs are complex instruments and come with a high risk of losing money rapidly due to leverage. 66% of retail investor accounts lose money when trading CFDs with this provider. You should consider whether you understand how CFDs work and whether you can afford to take the high risk of losing your money.
Stratos Global LLC (tradu.com ):
Losses can exceed deposits.
Please be advised that the information presented on TradingView is provided to Tradu (‘Company’, ‘we’) by a third-party provider (‘TFA Global Pte Ltd’). Please be reminded that you are solely responsible for the trading decisions on your account. There is a very high degree of risk involved in trading. Any information and/or content is intended entirely for research, educational and informational purposes only and does not constitute investment or consultation advice or investment strategy. The information is not tailored to the investment needs of any specific person and therefore does not involve a consideration of any of the investment objectives, financial situation or needs of any viewer that may receive it. Kindly also note that past performance is not a reliable indicator of future results. Actual results may differ materially from those anticipated in forward-looking or past performance statements. We assume no liability as to the accuracy or completeness of any of the information and/or content provided herein and the Company cannot be held responsible for any omission, mistake nor for any loss or damage including without limitation to any loss of profit which may arise from reliance on any information supplied by TFA Global Pte Ltd.
The speaker(s) is neither an employee, agent nor representative of Tradu and is therefore acting independently. The opinions given are their own, constitute general market commentary, and do not constitute the opinion or advice of Tradu or any form of personal or investment advice. Tradu neither endorses nor guarantees offerings of third-party speakers, nor is Tradu responsible for the content, veracity or opinions of third-party speakers, presenters or participants.