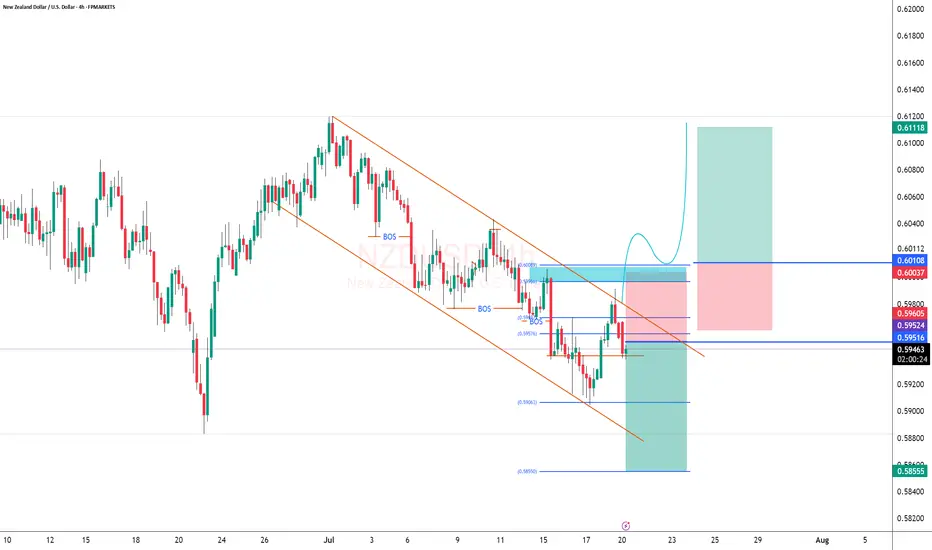
NZD_USD BULLISH BREAKOUT|LONG|
✅NZD_USD is going up
Now and the pair made a bullish
Breakout of the key horizontal
Level of 0.5980 and the breakout
Is confirmed so we are bullish
Biased and we will be expecting
A further bullish move up
LONG🚀
✅Like and subscribe to never miss a new idea!✅
Disclosure: I am part of Trade Nation's Influencer program and receive a monthly fee for using their TradingView charts in my analysis.
NZDUSD trade ideas

NZDUSD Updated analysis This analysis is an update of the previous one I made on NZDUSD. And if you're not following me, you can do that so you don't miss my analysis as I drop them often.
So eventually, the NZDUSD took out the level, and eventually used the extreme OB which also had an inducement. This is why we must stay reactive when trading.
Live and learn, Follow me for more trading setups.

NZDUSD Sell Stop SetupNZDUSD is in a clear downtrend, forming lower highs and lower lows. A sell stop is placed below the recent support to confirm bearish continuation.
Sell Stop: 0.59
Stop Loss (SL): 0.60
Take Profit 1 (TP1): 0.58
Take Profit 2 (TP2): 0.57
Waiting for price activation to validate the setup.

NZD/USD - Market OverviewNZD/USD saw modest gains, but upside momentum remained limited as market sentiment stayed cautious amid renewed tariff threats from Trump ahead of the February 1 deadline.
On Thursday, President Trump stated he would soon decide whether to exempt Canadian and Mexican oil imports from the 25% tariffs set to take effect on Saturday.
He also reiterated that additional tariffs on Chinese goods remain under consideration due to concerns over China's role in the fentanyl trade.
As of (GMT 06:09), the Kiwi dollar was up 0.19%, trading at 0.5646 against the U.S. dollar.
Key technical levels:
Resistance: Immediate resistance is seen at 0.5673 (38.2% Fib); a break above this level could drive the pair towards 0.5720 (50% Fib).
Support: The nearest support is at 0.5630 (38.2% Fib), with a break below exposing downside potential towards 0.5573 (23.6% Fib).
📉 Trade Setup:
🔹 Sell around 0.5660
🔹 Stop-loss: 0.5700
🔹 Target: 0.5550

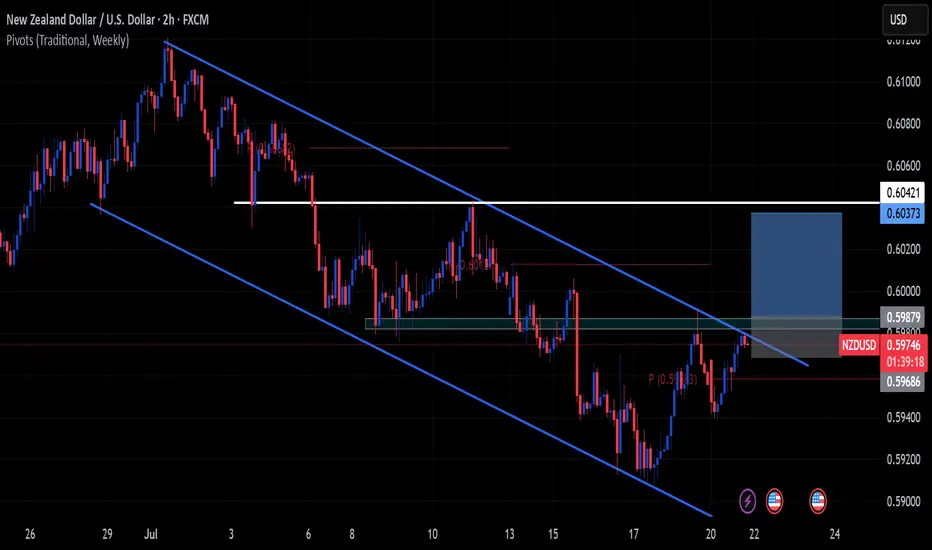
NZDUSD Is a Short-Term Rebound on the Table?NZD/USD is down nearly 0.4% in Tuesday’s European session, trading near the key support area of 0.5940 — a confluence of the 0.5 Fibonacci retracement and the midline of a descending channel. The pair is pressured by rising expectations that the RBNZ may cut rates in August, while the USD remains volatile amid uncertainty surrounding trade talks between the US and its key partners.
🔍 Technical Overview – Structure & Momentum
✅ Overall Trend: Bearish short-term (descending channel)
✅ Current Structure: Price is testing key technical support at 0.5940
✅ Volume Profile: VPOC and upper supply zones remain key targets on a bounce
NZD/USD continues to respect the bearish channel structure. However, the support zone at 0.5940 (Fibo 0.5 + recent demand) is showing signs of holding. If price sustains above this level, a bullish correction toward the 0.6006 and 0.6040 supply zones is a valid scenario.
🧭 Trade Scenarios
🔸 Bullish Short-Term Scenario (if 0.5940 holds):
Entry: Buy around 0.5940
TP1: 0.60064 (VPOC + supply zone)
TP2: 0.60400 (OBS sell zone)
SL: Below 0.5905 (sell-side liquidity break)
🔹 Bearish Continuation (if support breaks):
A clean break below 0.5905 confirms downside continuation
Look for retest and short entries targeting deeper channel lows (0.586x–0.583x)
⚠️ Macro Risk Drivers
Growing expectations of an RBNZ rate cut in August
Ongoing US trade negotiation uncertainty with key partners
Potential USD volatility around upcoming macroeconomic releases
📌 Key Price Levels to Watch
Technical Support 0.5940 Fibo 0.5 + mid-channel
Sell-Side Liquidity 0.5905 Bearish confirmation if broken
VPOC + Supply Zone 0.60064 First upside target
OBS Sell Zone 0.60400 Final bullish target / resistance
💬 The descending channel remains in control, but 0.5940 could be the key pivot. Wait for confirmation before entering, and watch volume closely.

Just following linesNzd price within an 8hr channel. Either going to break out and become bullish (short term) or it may just fall back within the channel. Either movement should signal short term direction for the pair.
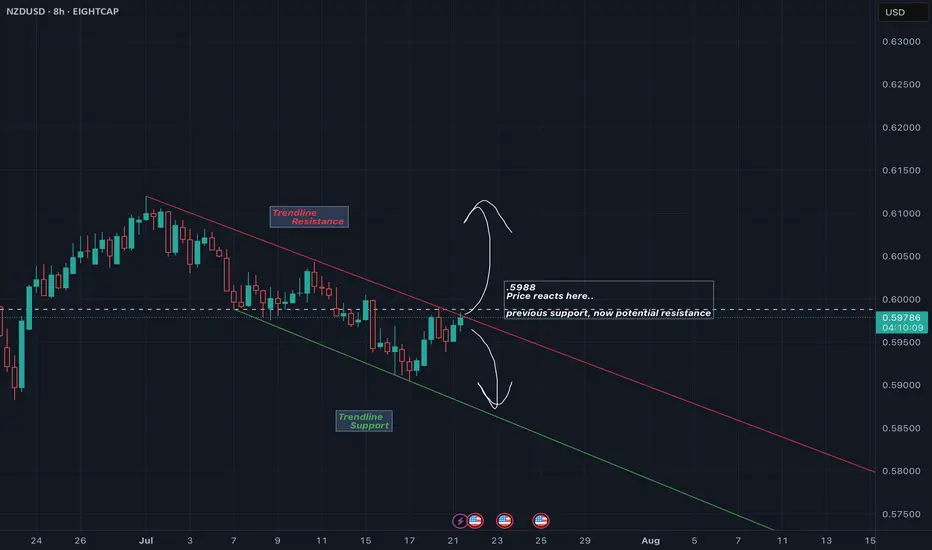
Bearish reversal?The Kiwi (NZD/USD) has rejected off the pivot, which is a pullback resistance, and could drop to the 1st support, which is also a pullback support.
Pivot: 0.5979
1st Support: 0.5918
1st Resistance: 0.6040
Risk Warning:
Trading Forex and CFDs carries a high level of risk to your capital and you should only trade with money you can afford to lose. Trading Forex and CFDs may not be suitable for all investors, so please ensure that you fully understand the risks involved and seek independent advice if necessary.
Disclaimer:
The above opinions given constitute general market commentary, and do not constitute the opinion or advice of IC Markets or any form of personal or investment advice.
Any opinions, news, research, analyses, prices, other information, or links to third-party sites contained on this website are provided on an "as-is" basis, are intended only to be informative, is not an advice nor a recommendation, nor research, or a record of our trading prices, or an offer of, or solicitation for a transaction in any financial instrument and thus should not be treated as such. The information provided does not involve any specific investment objectives, financial situation and needs of any specific person who may receive it. Please be aware, that past performance is not a reliable indicator of future performance and/or results. Past Performance or Forward-looking scenarios based upon the reasonable beliefs of the third-party provider are not a guarantee of future performance. Actual results may differ materially from those anticipated in forward-looking or past performance statements. IC Markets makes no representation or warranty and assumes no liability as to the accuracy or completeness of the information provided, nor any loss arising from any investment based on a recommendation, forecast or any information supplied by any third-party.

NZDUSD Will Go Higher From Support! Long!
Please, check our technical outlook for NZDUSD.
Time Frame: 12h
Current Trend: Bullish
Sentiment: Oversold (based on 7-period RSI)
Forecast: Bullish
The market is trading around a solid horizontal structure 0.596.
The above observations make me that the market will inevitably achieve 0.602 level.
P.S
Please, note that an oversold/overbought condition can last for a long time, and therefore being oversold/overbought doesn't mean a price rally will come soon, or at all.
Disclosure: I am part of Trade Nation's Influencer program and receive a monthly fee for using their TradingView charts in my analysis.
Like and subscribe and comment my ideas if you enjoy them!

NZDUSD Potential LongsThis is how I'd be looking at NZDUSD for longs, not a high probability setup, considering current bearish structure but good RR makes it worth the risk

NZDUSD Buy C setupHello traders this is a nice setup but it doesn't have that much confluence!!
Clear!!
Not sweet because of how far the pivot point is from my Sl.
we aslo have a weak Head and Shoulders at the bottom I hope you can see it.
NZDUSD SELLBy utilizing levels, historical patterns, we can formulate a hypothesis that the market might follow a similar trajectory if bearish sentiment prevails.

nzdusd long tradein my opinion this is a good trade with a good r/r
hope it will hit the target
consider this is my trade not your trade
i just like to share my trades with world

NZDUSD Faces Further Downside Amid Renewed Tariff ConcernsNZDUSD Faces Further Downside Amid Renewed Tariff Concerns
In July, NZDUSD created a false breakout after printing a new higher high.
Initially, the pair appeared set for further gains, but the U.S. dollar regained strength following stronger-than-expected Non-Farm Payrolls (NFP) data.
Today, market sentiment remains fragile as anticipation builds around President Trump's upcoming remarks on tariffs.
Our analysis suggests that the broader outlook remains unchanged—NZDUSD is still positioned for further downside.
You may find more details in the chart!
Thank you and Good Luck!
❤️PS: Please support with a like or comment if you find this analysis useful for your trading day❤️
Disclosure: I am part of Trade Nation's Influencer program and receive a monthly fee for using their TradingView charts in my analysis.

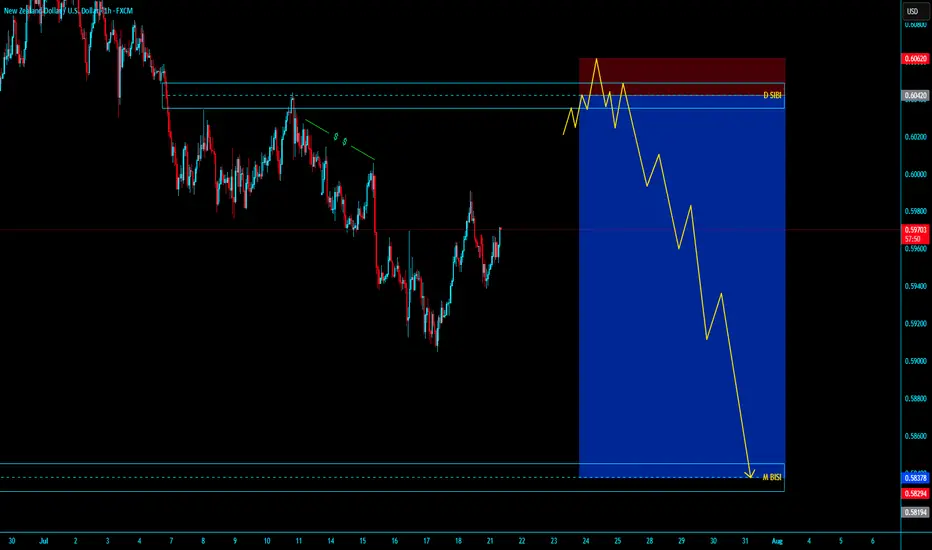
# NZDUSD SHORT SELLING# NZDUSD SHORT SELLING
Market IN monthly SIBI in Daily TF MSS , in Daily SIBI Going to LTF after Valid MSS with Run on Stop either Engage dose not Matter . entry with Tight SL and LONG Target Open
- HELLO..................
ENTYR PRICE - 0.60418
SL 20 PIPS - 0.60618
TARGET MONTHLY BISI - 0.58376
I THINK ITS OVER NIGHT HOLDING
JUST HOLD AND ENJOYYYYYYYYYYYYYYYYYYYYYYYYYYYYYYYYYYYYYYYYY
NZD/USD BUYERS WILL DOMINATE THE MARKET|LONG
NZD/USD SIGNAL
Trade Direction: long
Entry Level: 0.595
Target Level: 0.608
Stop Loss: 0.587
RISK PROFILE
Risk level: medium
Suggested risk: 1%
Timeframe: 1D
Disclosure: I am part of Trade Nation's Influencer program and receive a monthly fee for using their TradingView charts in my analysis.
✅LIKE AND COMMENT MY IDEAS✅

NZD/USD 1-Target 0.59900 2- Target 0.59328Monday's target no. 1, then target no. 2, meaning continued weakening of the NZD against the USD.
Tools:
- real volume (proper interpretation)
- Fibonacci expansion ABC
- Fibonacci retracement
- volume support and resistance levels
- oversold/overbought index
- candlestick patterns

Break Even Here Please The market has moved some pips from our original entry, its well advised to breakeven and take a chill for the day.
I hope you enjoy my setup so far. It's simple and easy to understand.

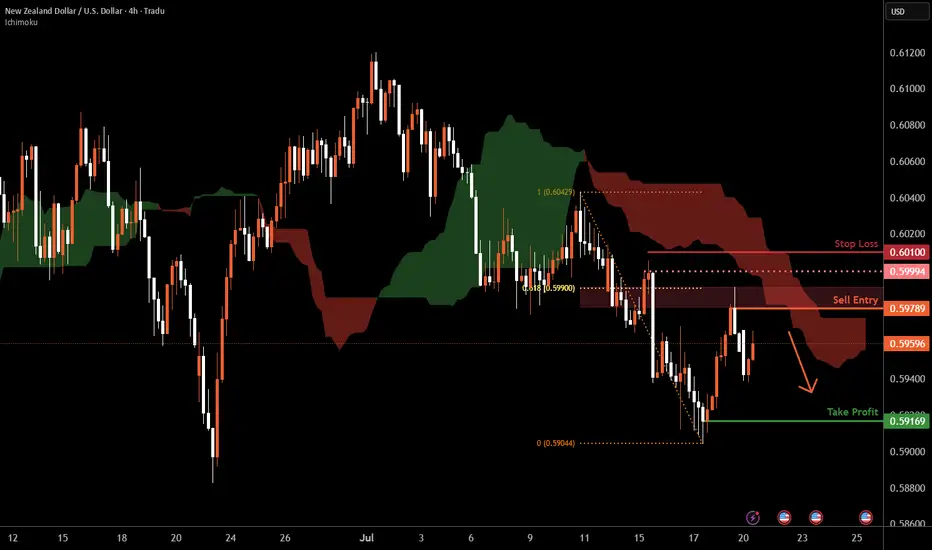
Kiwi H4 | Swing-high resistance at 61.8% Fibonacci retracementThe Kiwi (NZD/USD) is rising towards a swing-high resistance and could potentially reverse off this level to drop lower.
Sell entry is at 0.5978 which is a swing-high resistance that aligns closely with the 61.8% Fibonacci retracement.
Stop loss is at 0.6010 which is a level that sits above a swing-high resistance.
Take profit is at 0.5916 which is a swing-low support.
High Risk Investment Warning
Trading Forex/CFDs on margin carries a high level of risk and may not be suitable for all investors. Leverage can work against you.
Stratos Markets Limited (tradu.com ):
CFDs are complex instruments and come with a high risk of losing money rapidly due to leverage. 66% of retail investor accounts lose money when trading CFDs with this provider. You should consider whether you understand how CFDs work and whether you can afford to take the high risk of losing your money.
Stratos Europe Ltd (tradu.com ):
CFDs are complex instruments and come with a high risk of losing money rapidly due to leverage. 66% of retail investor accounts lose money when trading CFDs with this provider. You should consider whether you understand how CFDs work and whether you can afford to take the high risk of losing your money.
Stratos Global LLC (tradu.com ):
Losses can exceed deposits.
Please be advised that the information presented on TradingView is provided to Tradu (‘Company’, ‘we’) by a third-party provider (‘TFA Global Pte Ltd’). Please be reminded that you are solely responsible for the trading decisions on your account. There is a very high degree of risk involved in trading. Any information and/or content is intended entirely for research, educational and informational purposes only and does not constitute investment or consultation advice or investment strategy. The information is not tailored to the investment needs of any specific person and therefore does not involve a consideration of any of the investment objectives, financial situation or needs of any viewer that may receive it. Kindly also note that past performance is not a reliable indicator of future results. Actual results may differ materially from those anticipated in forward-looking or past performance statements. We assume no liability as to the accuracy or completeness of any of the information and/or content provided herein and the Company cannot be held responsible for any omission, mistake nor for any loss or damage including without limitation to any loss of profit which may arise from reliance on any information supplied by TFA Global Pte Ltd.
The speaker(s) is neither an employee, agent nor representative of Tradu and is therefore acting independently. The opinions given are their own, constitute general market commentary, and do not constitute the opinion or advice of Tradu or any form of personal or investment advice. Tradu neither endorses nor guarantees offerings of third-party speakers, nor is Tradu responsible for the content, veracity or opinions of third-party speakers, presenters or participants.
NZDUSD in Downtrend ContinuationSell Limit
Entry Price 0.5978
Stop Loss 0.6013
Risk 1%
Lot Size 0.70
TP (1RR) 0.5942
TP (2.7RR) 0.5884

NZD/USD to GO DOWN AMOTHER 86 PIPS?Wit hprice still firmly in our down channel creating new highs and lows, we would want to see price continue on its downward projection with entry @ 0.59515 giving us a drop down to at least 0.58555 with stop loss @0.60037
Let's Go from here It's another good time to find a buy position.
Please follow for more updates and encourage my efforts
NZDUSD - Elliott Wave: High-Probability Reversal Zone Ahead!NZDUSD – Elliott Wave Roadmap
3Day Chart
Every move has been unfolding with precision — true to Elliott Wave Theory.
We're in the final leg of a massive A-B-C correction:
- Wave A and the complex Wave B (WXY) are complete.
- Wave C is now in play, targeting the highs of Wave A.
We’ve just seen a clean 5-wave advance (wave 1 leading diagonal).
Now expecting a classic ABC correction for wave 2, into our reversal zone (38.2–61.8% Fib).
🔍 Once price enters this zone, we’ll drop to lower timeframes and:
- Look for bullish confirmations (BOS, trendline break)
- Set entries with stops below corrective lows
- Targets: 0.63 (500 pips) and 0.65 (700 pips)
📌 Why is the buy zone so big?
It’s a higher timeframe zone. Once price enters, we zoom into lower timeframes for precise entries. The zone simply tells us when to focus, not where to blindly buy.
This is the Wave 3 generation point — and that’s where the real move begins.
Plan your trade. Watch for the setup. Execute with confidence.
Goodluck and as always, Trade Safe!
NZDUSD 12H Chart - Looking for this ABC correction for wave 2

NZDUSD TRADE SETUPWait for retest the entry level and bearish momentum then take a trade for Sell otherwise skip this setup
