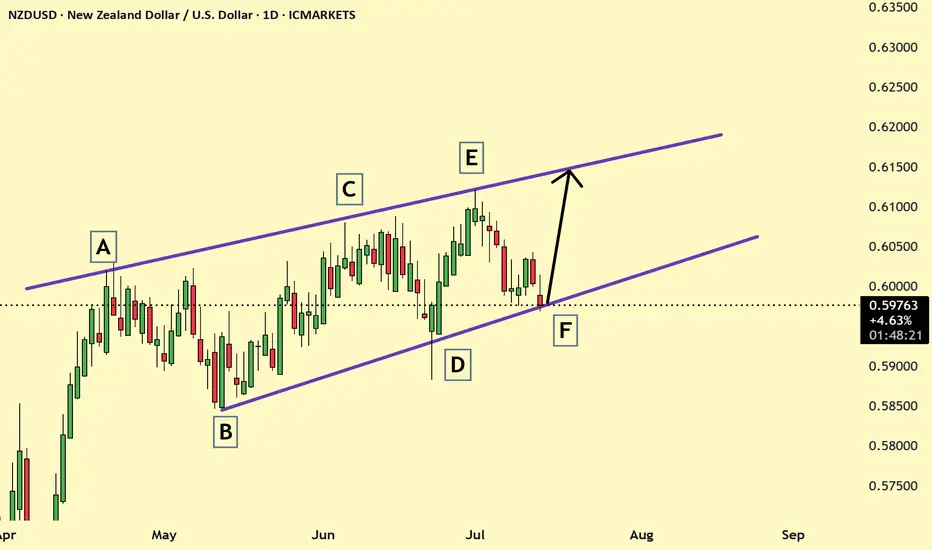
NZDUSDSince March we have been trading NZDUSD inside a chanell and after catching the sells we now look into maximising the buys as well with 0.61775 as our main target before we consider changing biase to bear.
A colure below the channel will invalidate this analysis and will target 0.57646 - 0.55404
NZDUSD trade ideas

July 13, Forex Outlook : This Week’s Blueprint to Profit!Welcome back, traders!
In today’s video, we’ll be conducting a Forex Weekly Outlook, analyzing multiple currency pairs from a top-down perspective—starting from the higher timeframes and working our way down to the lower timeframes.
Currency Pairs:
EURUSD
USDCAD
AUDUSD
EURGBP
EURJPY
GBPCHF
USDCHF
NZDCHF
NZDUSD
EURNZD
Our focus will be on identifying high-probability price action scenarios using clear market structure, institutional order flow, and key confirmation levels. This detailed breakdown is designed to give you a strategic edge and help you navigate this week’s trading opportunities with confidence.
📊 What to Expect in This Video:
1. Higher timeframe trend analysis
2. Key zones of interest and potential setups
3. High-precision confirmations on lower timeframes
4. Institutional insight into where price is likely to go next
Stay tuned, take notes, and be sure to like, comment, and subscribe so you don’t miss future trading insights!
Have a great week ahead, God bless you!
The Architect 🏛️📉

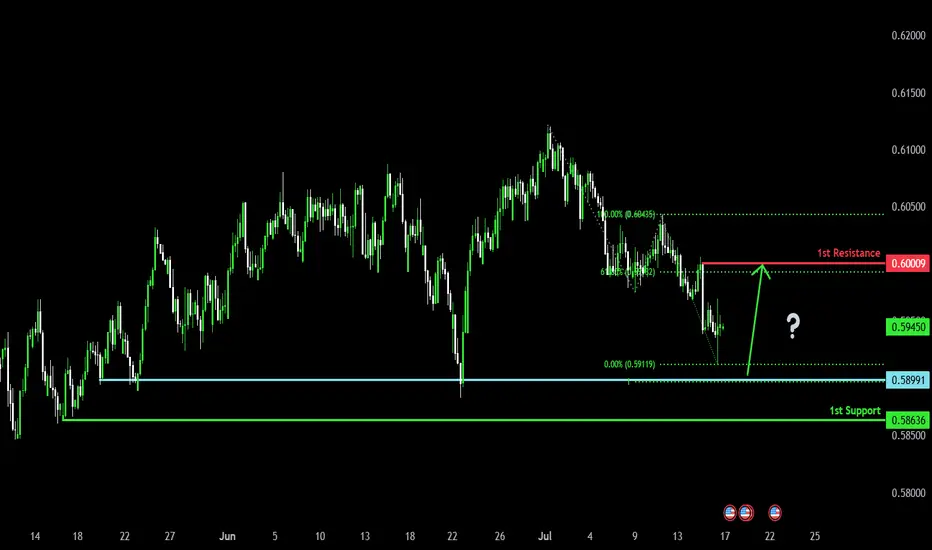
Bullish bounce?The Kiwi (NZD/USD) is falling towards the pivot and could bounce to the 1st resistance.
Pivot: 0.5899
1st Support: 0.5863
1st Resistance: 0.6000
Risk Warning:
Trading Forex and CFDs carries a high level of risk to your capital and you should only trade with money you can afford to lose. Trading Forex and CFDs may not be suitable for all investors, so please ensure that you fully understand the risks involved and seek independent advice if necessary.
Disclaimer:
The above opinions given constitute general market commentary, and do not constitute the opinion or advice of IC Markets or any form of personal or investment advice.
Any opinions, news, research, analyses, prices, other information, or links to third-party sites contained on this website are provided on an "as-is" basis, are intended only to be informative, is not an advice nor a recommendation, nor research, or a record of our trading prices, or an offer of, or solicitation for a transaction in any financial instrument and thus should not be treated as such. The information provided does not involve any specific investment objectives, financial situation and needs of any specific person who may receive it. Please be aware, that past performance is not a reliable indicator of future performance and/or results. Past Performance or Forward-looking scenarios based upon the reasonable beliefs of the third-party provider are not a guarantee of future performance. Actual results may differ materially from those anticipated in forward-looking or past performance statements. IC Markets makes no representation or warranty and assumes no liability as to the accuracy or completeness of the information provided, nor any loss arising from any investment based on a recommendation, forecast or any information supplied by any third-party.
NZDUSD SHORTMarket structure bearish on HTFs DH
Entry at both Weekly and Daily AOi
Weekly Rejection at AOi
Daily Rejection at AOi
Daily EMA retest
Previous Structure point Daily
Around Psychological Level 0.60000
H4 EMA retest
H4 Candlestick rejection
Rejection from Previous structure
Levels 3.93
Entry 105%
REMEMBER : Trading is a Game Of Probability
: Manage Your Risk
: Be Patient
: Every Moment Is Unique
: Rinse, Wash, Repeat!
: Christ is King.


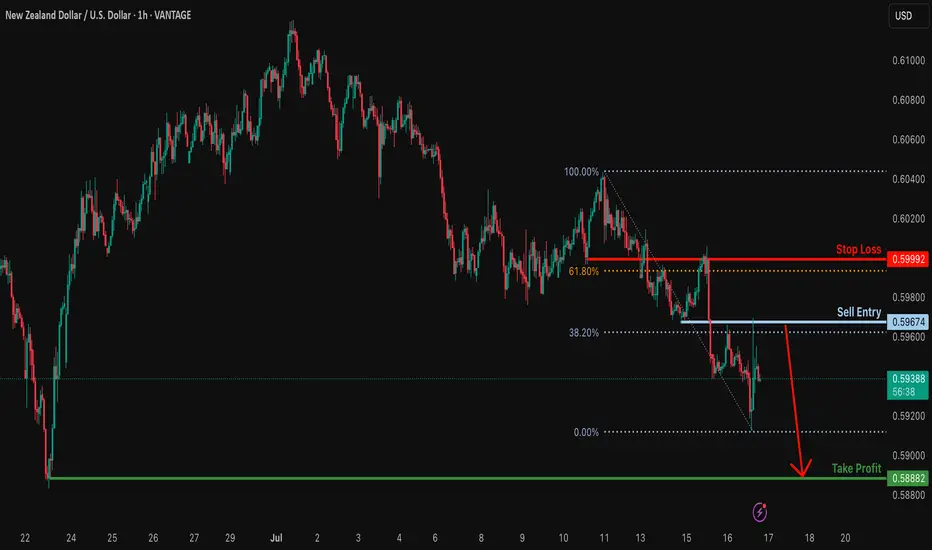
Bearish continuation?NZD/USD has rejected off the resistance level which is an overlap resistance that lines up with the 38.2% Fibonacci retracement and could drop from this level to our take profit.
Entry: 0.5967
Why we like it:
There is an overlap resistance that lines up with the 38.2% Fibonacci retracement.
Stop loss: 0.5999
Why we like it:
There is an overlap resistance that is slightly above the 61.8% Fibonacci retracement.
Take profit: 0.5888
Why we like it:
There is a pullback support.
Enjoying your TradingView experience? Review us!
Please be advised that the information presented on TradingView is provided to Vantage (‘Vantage Global Limited’, ‘we’) by a third-party provider (‘Everest Fortune Group’). Please be reminded that you are solely responsible for the trading decisions on your account. There is a very high degree of risk involved in trading. Any information and/or content is intended entirely for research, educational and informational purposes only and does not constitute investment or consultation advice or investment strategy. The information is not tailored to the investment needs of any specific person and therefore does not involve a consideration of any of the investment objectives, financial situation or needs of any viewer that may receive it. Kindly also note that past performance is not a reliable indicator of future results. Actual results may differ materially from those anticipated in forward-looking or past performance statements. We assume no liability as to the accuracy or completeness of any of the information and/or content provided herein and the Company cannot be held responsible for any omission, mistake nor for any loss or damage including without limitation to any loss of profit which may arise from reliance on any information supplied by Everest Fortune Group.
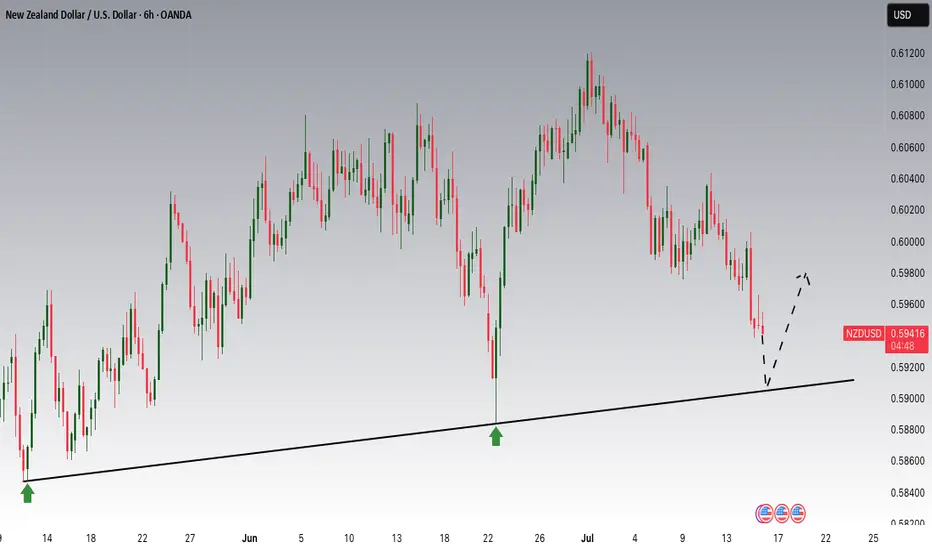
NZDUSD is Nearing an Important SupportHey Traders, in today's trading session we are monitoring NZDUSD for a buying opportunity around 0.59100 zone, NZDUSD is trading in an uptrend and currently is in a correction phase in which it is approaching the trend at 0.59100 support and resistance area.
Trade safe, Joe.
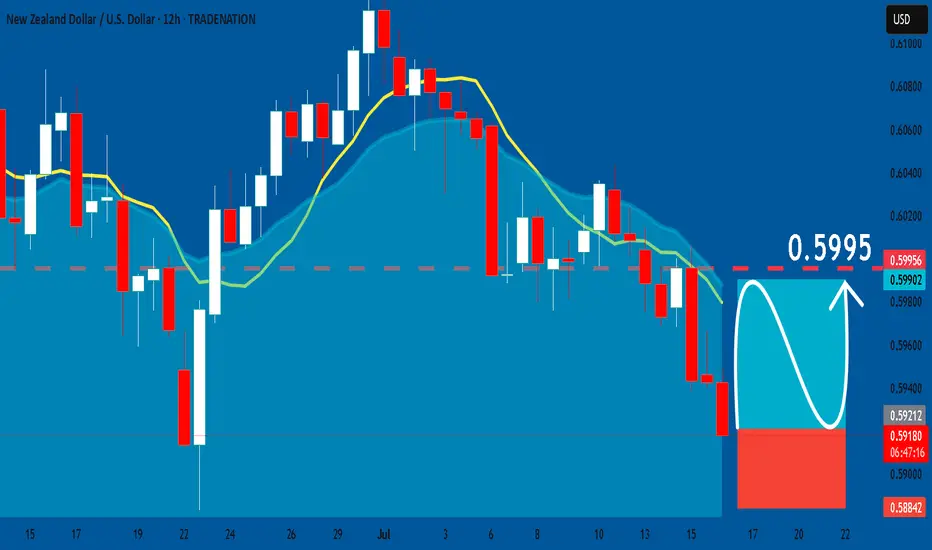
NZDUSD: Bullish Continuation & Long Signal
NZDUSD
- Classic bullish setup
- Our team expects bullish continuation
SUGGESTED TRADE:
Swing Trade
Long NZDUSD
Entry Point - 0.5922
Stop Loss - 0.5884
Take Profit - 0.5995
Our Risk - 1%
Start protection of your profits from lower levels
Disclosure: I am part of Trade Nation's Influencer program and receive a monthly fee for using their TradingView charts in my analysis.
❤️ Please, support our work with like & comment! ❤️
NZDUSD at trendline Support NZDUSD is trading in the channel and currently price has reached the trendline support form this area pullback can be seen.
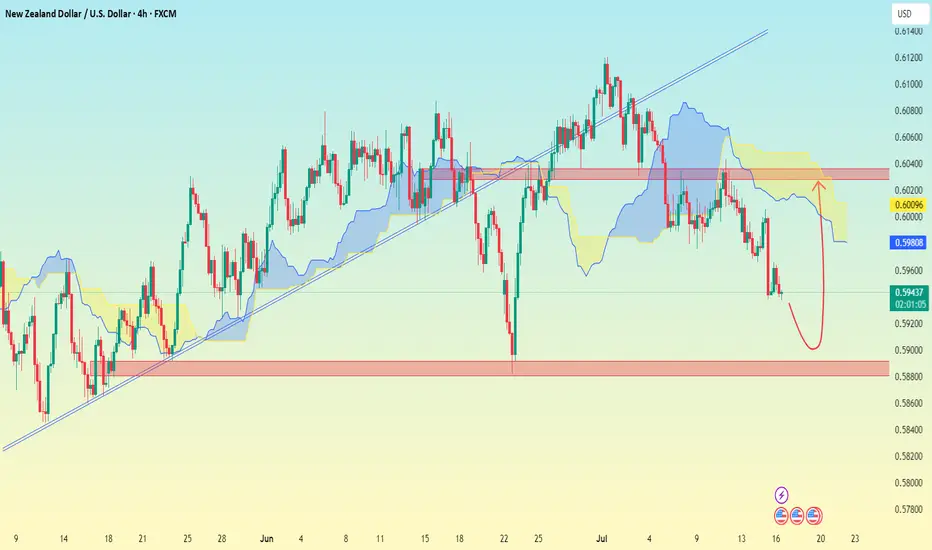
NZD/USD (4H time frame)..NZD/USD (4H time frame), here's the analysis:
---
📉 Chart Analysis Summary:
Price has broken below the trendline and is currently below the Ichimoku cloud, indicating bearish momentum.
A bearish move is likely continuing toward a strong support zone.
A rebound is drawn on my analysis suggesting a possible bounce after reaching a key demand zone.
---
🎯 Target Levels:
🔻 Bearish Move (Primary Setup):
Sell from: Current zone around 0.59400
Target 1: 0.59000
Target 2 (Main Support Zone): 0.58600
Stop Loss: Above the red horizontal resistance — around 0.60000
---
🔁 Possible Bounce Scenario (Secondary Setup):
If price hits the 0.58600 zone and shows reversal signs:
Buy from: 0.58600 – 0.58800
Target: 0.59800 – 0.60000
---
⚠ Key Zones:
🔴 Resistance: 0.60000 – 0.60200
🟢 Support: 0.58600 – 0.58800

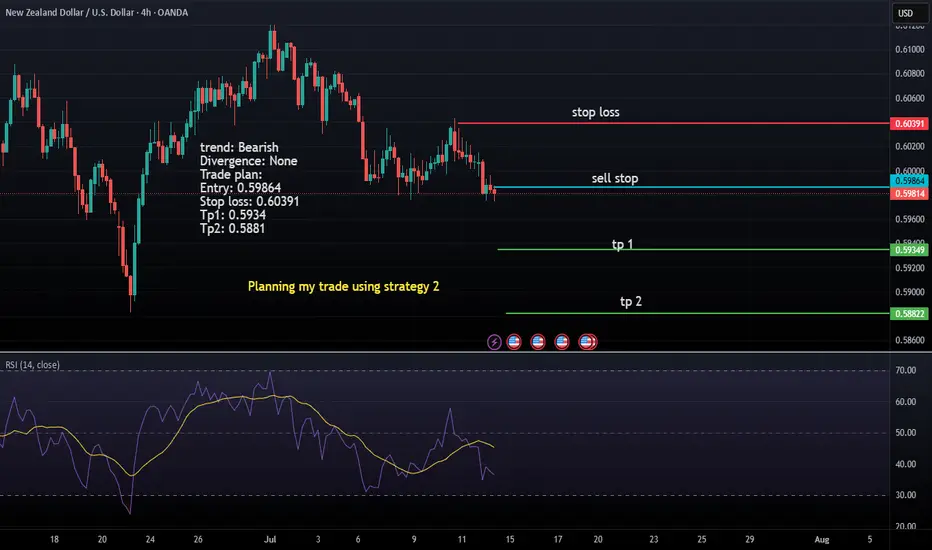
NZDUSD BEARISH 16-7-2025trend : bearish
divergence : n/a
reversal : n/a
continuation : lhs & lls
harmonics : n/a
bias : bearish

NZD USD longA correction could occur to gather more momentum for the continuation of its downward movement

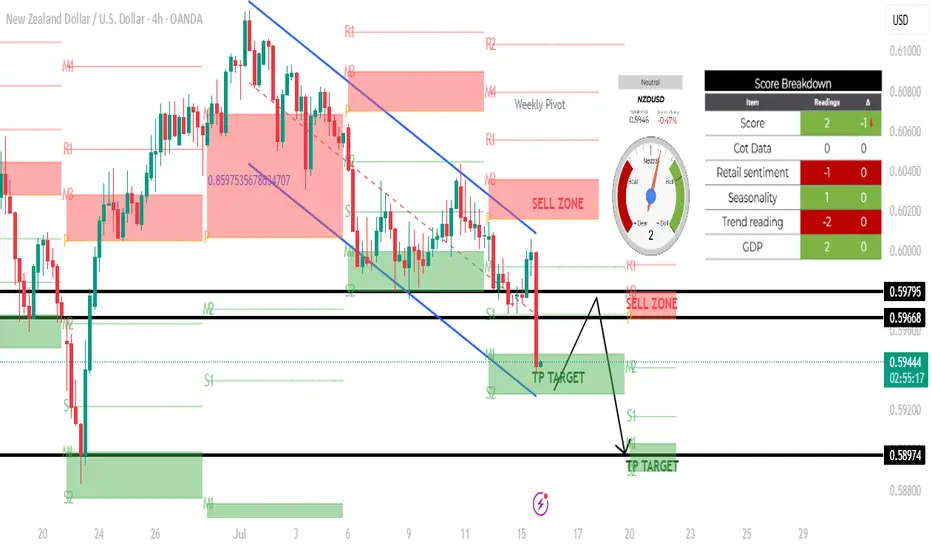
NZDUSD H4 SHORT SETUP: 15 JULY 2025Based on the 4-hour chart of NZD/USD, here's a technical analysis of the current setup:
\---
🕒 Timeframe: 4H
💱 Pair: NZD/USD
📉 Current Price: Around 0.59430
---
🔍 Chart Structure and Analysis:
🔻 Trend:
The market is in a clear downtrend, as indicated by the descending channel and the strong bearish candle that broke below the previous support zone.
Sellers are currently in control.
---
📍 Key Zones:
🔴 Sell Zones (Supply):
0.59668 – 0.59795: Marked as a supply/sell zone.
Price previously reacted here and dropped sharply. Expect selling pressure if price retests this zone.
---
🟢 Take Profit (TP) Targets / Demand Zones:
1. TP Target 1: Around 0.59430 – 0.59300 — Already hit; slight bounce seen.
2. TP Target 2: 0.58974 — This is the next key target/support zone, which aligns with a prior low.
---
🔁 Possible Scenarios:
✅ Scenario 1: Continuation Bearish
If price fails to break back above the 0.59668 resistance, it will likely:
Consolidate below,
Retest and reject again,
Then head lower toward 0.58974 (TP2).
⚠ Scenario 2: Short-Term Retracement
If there's a bounce (as seen by the current candle's wick), price may retest the sell zone at 0.59668–0.59795.
This could present another short entry opportunity with a target at 0.58974.
---
📊 Confluences:
Weekly Pivot + Structure Resistance near 0.59668: Strengthens the sell zone.
Strong Bearish Momentum Candle: Signals potential for continuation.
TP Zone overlaps with S2 level: Providing possible support/bounce area.

NZDUSD BUYSI’m looking to take buys on NZD/USD because the overall trend remains bullish. We’ve reached a strong technical level, and the new monthly candle has retraced into a key discount zone, offering a favorable entry. This pullback aligns with the broader upward momentum, so my bias is to the upside. That’s why I’m entering long from here—buying the dip within the context of a continuing uptrend.

IS USD STRENGTH BACK? or IS IT JUST A PULLBACK?All the information you need to find a high probability trade are in front of you on the charts so build your trading decisions on 'the facts' of the chart NOT what you think or what you want to happen or even what you heard will happen. If you have enough facts telling you to trade in a certain direction and therefore enough confluence to take a trade, then this is how you will gain consistency in you trading and build confidence. Check out my trade idea!!
www.tradingview.com

NZDUSD Pullback in Play – Head & Shoulders Signals More DownsideNZDUSD ( OANDA:NZDUSD ) is currently trading near the Resistance zone($0.612-$0.605) and has also managed to break the Support zone($0.604-$0.602) . We consider the Support zone as the neckline of the Head and Shoulders Pattern .
In terms of classic technical analysis , NZDUSD has managed to form a Head and Shoulders Pattern .
I expect NZDUSD to decline towards the Support zone($0.5968-$0.5946) after completing the pullback .
Note: Stop Loss(SL): $0.6062
Please respect each other's ideas and express them politely if you agree or disagree.
New Zealand Dollar/ U.S. Dollar Analyze (NZDUSD), 1-hour time frame.
Be sure to follow the updated ideas.
Do not forget to put a Stop loss for your positions (For every position you want to open).
Please follow your strategy and updates; this is just my Idea, and I will gladly see your ideas in this post.
Please do not forget the ✅' like '✅ button 🙏😊 & Share it with your friends; thanks, and Trade safe.

Bearish trend in NZDUSD pairA Bearish trend in the NZDUSD pair clear shows no divergence so I will short it and booking my tp 1 & tp 2
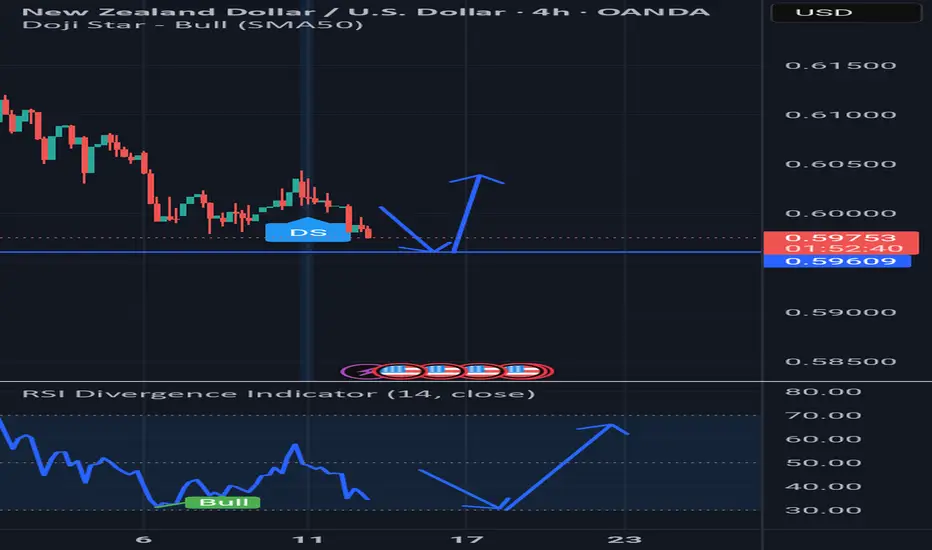
30Pips up from here is likely achievable Stay tuned as I go for instant execution for 30pips from here. Up of buy position.
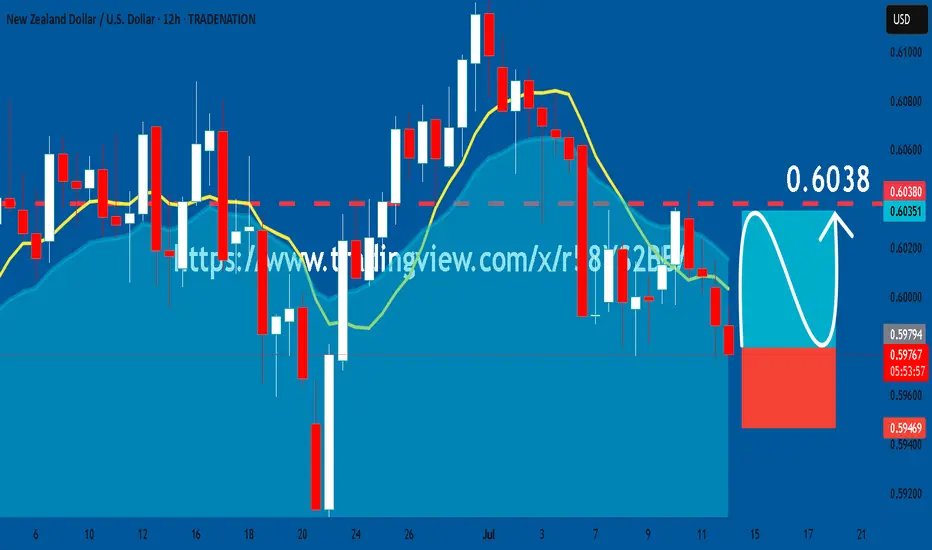
NZDUSD: Bullish Continuation & Long Trade
NZDUSD
- Classic bullish setup
- Our team expects bullish continuation
SUGGESTED TRADE:
Swing Trade
Long NZDUSD
Entry Point - 0.5978
Stop Loss - 0.5946
Take Profit - 0.6038
Our Risk - 1%
Start protection of your profits from lower levels
Disclosure: I am part of Trade Nation's Influencer program and receive a monthly fee for using their TradingView charts in my analysis.
❤️ Please, support our work with like & comment! ❤️
NZDUSD Bearish - SELL SetupNZDUSD is making series of LH and LLs. there is no divergence therofore bears will remain in control of the market. market has retraced to the the fib level of 0.382 and took rejection from the resistance level marked. futher market is moving in channel which is a continuation pattern. we are all set to take sell entry instantly with our SL defined above last LH.
manage your risk with a R:R of 1:2

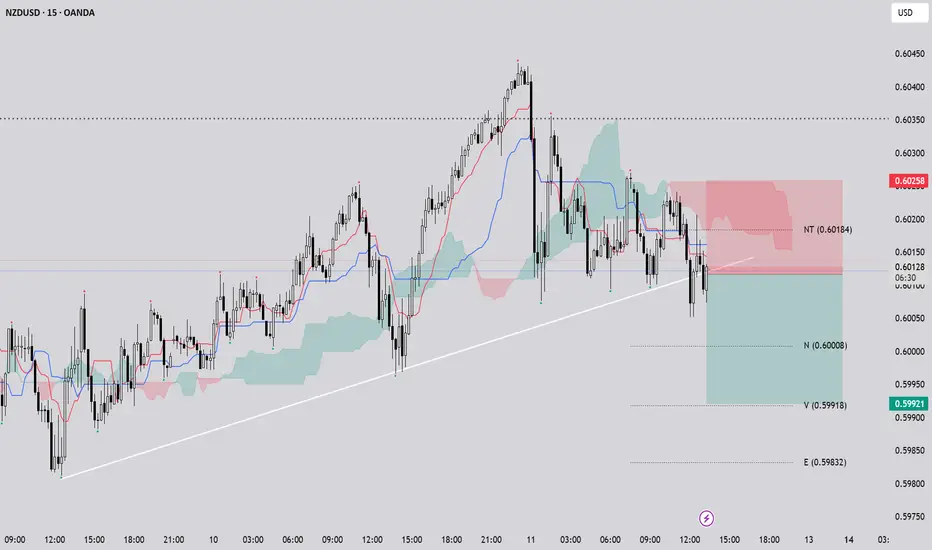
NZD USD / M15 / SHORTOn the 15-minute chart of NZDUSD, a shift in market structure is evident as the prior uptrend—previously supported by ascending trendlines—has been broken. The Ichimoku cloud (Kumo) outlines key support and resistance zones, and price movement outside the cloud reinforces the weakening of the bullish momentum. The crossover between the Tenkan-sen and Kijun-sen lines aligns with the wave structure, signaling a potential bearish phase. This combination of technical signals suggests that the market may be transitioning into a corrective move or a short-term downtrend, presenting a potential opportunity for short positions.