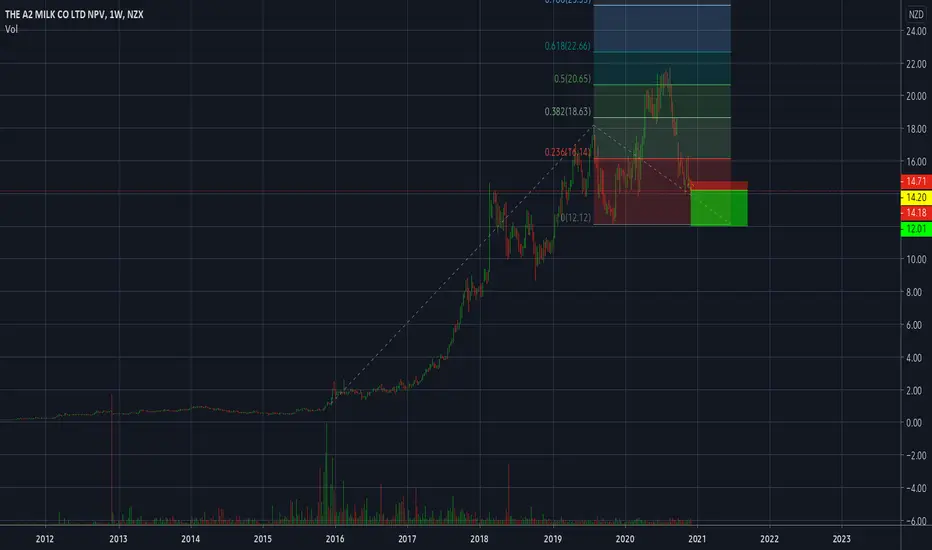
Waiting for it to fall more.Cycle complete and now in a correction. Fibbs looking very good on log scale. .23 and .618 has proven a great sr level historically. Alarm at price label for entry. buy zone rectangle
ATM trade ideas

A2M | Milk is for Babies!Trade Analysis based on Price action & Fundamentals..
The target is NZ$13.50 with a Price range of $5.50-$17.00, with downside...
With risk management you will never loss money..
Ridethemacro

A2M future TrendIf it can break the trend line, it will start its up-trend move in future ...
We should wait for this break of the trend line and after re-test as a confirmation for starting a up-trend; we can go long.
ASX:A2M

ASX - A2mAccumulation of A2m between the 0.61 and 0.786 retracement from the 2016 low of $1.33
and the 2020 high of $20. 01 .
This will align with the long term trend line from its early
years.
I calculated an intrinsic value between $8-$16
using various ROIC figures, ROE, Future PE ratio,
expected MARR of 15%
ROE- 22% (has actually been between 30-46%
I devalued the return because of the current headwinds
with the chinese export routes.

A2 milk having its milkshake drunkProfit downgrade. Not a "bad" company. Main market is China. Fancy-man milk with special magic proteins. Still turning a profit. Will have to bottom out at some point :D

A2M Class A Bullish Divergence Evident on Weekly ChartHello,
Obviously A2M is in a significant downtrend for some time now. As seen on the MACD (green line on MACD) we are seeing a loss of bear power and on the chart we are still in downtrend (red line on chart). This is an evident Class A Bullish Divergence, also on the Stochastic we can see the stock has been in the oversold area for a since September 2020. Additionally, the fundamentals for A2M have been great. No debt, making profits and still expanding in some others. (Daigou channel still hurting but I don't think it will break the company.) Now I'm not saying that we will see a trend reversal just yet. However I think we are very close to a trend reversal, possibly 4-12 weeks away. I can't see anything tradeable at the moment but I am keeping and eye for a potential bottom and trend reversal on this. I am interested in your views.
Thanks for reading :)

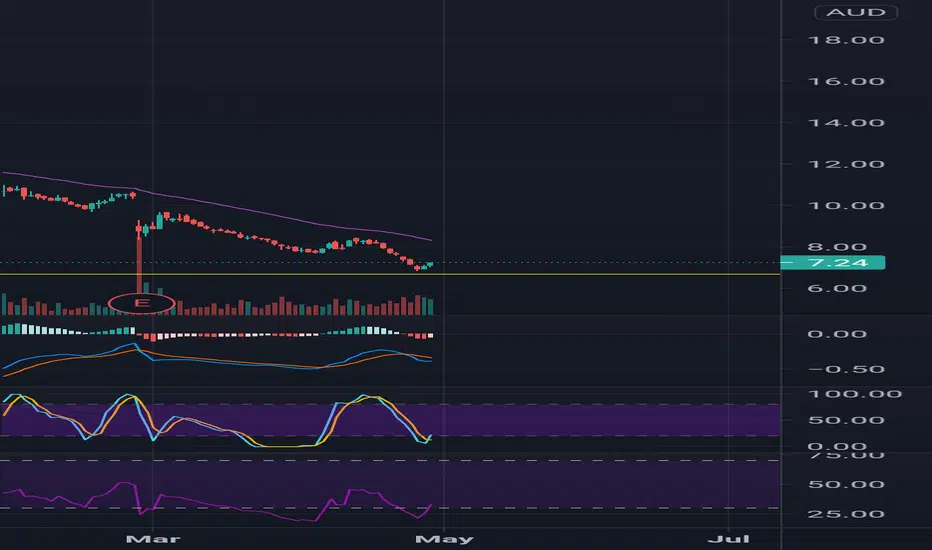
A2M with a weekly trade if you want it. I see a2m having a strong week next week, before either breaking through 43EMA or going lower. There are rumours around about a take over on the cards for the company. Any news is currently good for A2M as it was heavily oversold at $6.90. Personally i see a move to $7.90 on the cards before either bears take control again, or bulls step up. A good swing entry here if thats how you trade, stop loss at $6.90.
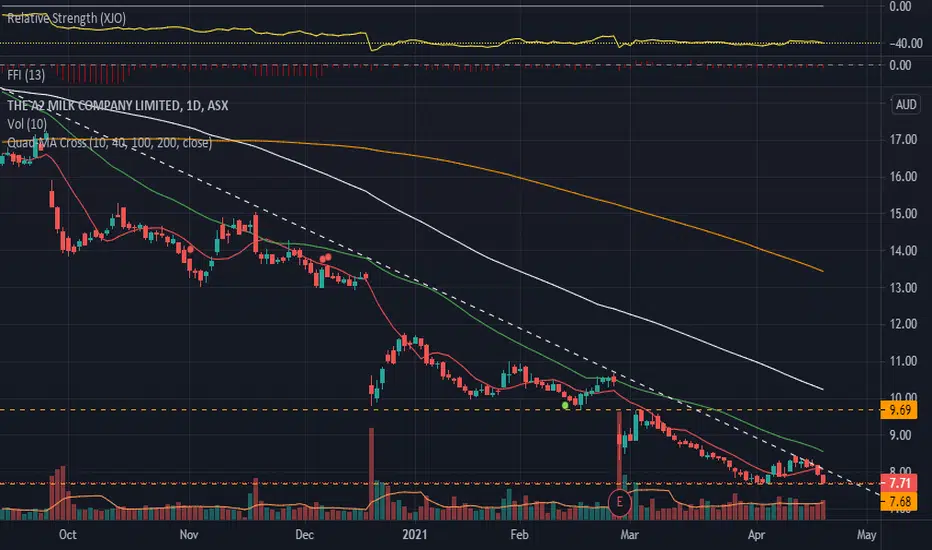
A2M.ASX_Breakout Trade_ShortENTRY: 7.65
SL: 8.10
TP1: 7.17
TP2: 6.33
- ADX>25
- RSI<35
- RS and FFI -ve
- Weekly MACD -ve
- Breakdown with decent volume on 21 Apr 2021
A2M looks ready to break downtrend.It has been moving well the past 5 trading days. Looking for a breakout tomorrow and a close above $8.60 for an entry.
Initial target at $10.40.
A stock that will probably be dependant on borders and trade agreements with china to be positive for the company. TA wise, its bullish above $8.60 so will post again when it gets there. Still on watch. However, entry here with a stop at $7.65 is good risk-reward.


A2M - Double bottom and bullish divergenceI have a position in this that I picked up on the earnings drop.
Was looking for a short over-reaction scalp and considering closing it out but stop to wonder if this could be an actual reversal.
Weekly
- double bottom on hte breakout
- bullish divergence
Double bottom on the breakout is obviously a strong support line. There will be a lot of price memory here, see the big volume candle at the current bottom. A lot of action but still didn't get past it.
-----------------------------
disclaimer: this is not financial advice, I am not a CPA.
Trade at your own risk.

$$$ A2M $$$Hi guys !
A2M seems on Bullish reversal mode after hitting 2 years low $8.33 , Which makes fresh opening market now after the half yearly negative reports and accounts.
If market tends to move upward and breaks the resistance of $9.83 then its most likely to hit $10.67 after and RSI is fresh market mode to support if we are talking about technically and many others. If A2m can perform good next quarter of this year then last year high $20.05 will be seeing next !
Cheers !
Happy Trading !!!


A2M - Trade PlanA2M is at a very important juncture, currently at $10.20, and the market now is waiting for the announcement of its earnings report on the 25th of February. A2M has been consolidating between the range of $10.00 and $11.00 range, (50% Fib Retracement Zone) since the plunge in price. This (50% Fib Retracement Zone) is from the initial lows in May 2015, to its all time Highs of $20.00 in July 2020. This is also a High Profile Volume Zone where price is hovering currently.
The market is anticipating the release of its earnings report with an estimate of $0.17 EPS, and I think that if it releases its EPS below estimate, or any negative surprise, then we may see some more pressure to the downside towards the $8.00 - $9.00 Zone (Extremely Critical Support Zone). If we see it announce higher then estimate or any good surprise, then we need to see the break of the Bearish Trendline coupled with High Volume. Price has been hugging the Bearish Trendline and has not been able to break and close above it as of yet.
I want to see a decisive break of the Bearish Trendline with High Volume and a close above it, to take a Buy Position with a tight Stoploss below the 18th December, 2020 low. My Stoploss will be at $9.70, aiming for an initial target towards $12.00 - $13.00 zone, which is also a Gap Window Zone.
Please note these are my own notes, by no means trading advice. Please do your own research before entering into any trade.

A2M - Trendline BrokenA2M looking weak on the Weekly and Monthly chart and forming Lower Highs and Lower Lows on the Daily Chart, suggesting lower prices to be seen ahead. Price may come to either one of the Support Levels ideally in the Fibonacci Retracement Zone between 50-61.8% level (The Golden Pocket Zone) and a very strong Support level for a very good buying opportunity.
Note: Please note these are my notes for my own future reference. By no means trading advise to anyone. Please do your own research before entering into any trade.


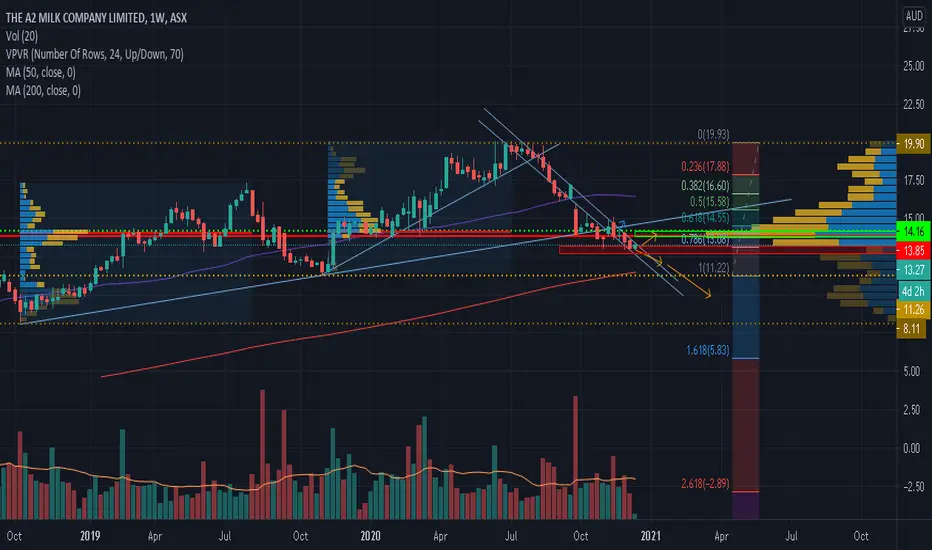
A2M - Bearish (May have more room to the Downside)Bearish Confirmation Indications according to Volume Profile Strategy
As the trend line is apparently broken, the price is now below the heavy volume zone between $13.80 - @14.20 (which may now act as resistance and hence may get selling pressure to the next volume profile zone between $9.60 - @10.20. There are two bearish scenarios that may be possibly in development.
Scenario 1
Either price finds support at the current price level of $13.00 and goes up to hit the High Volume Profile Zone of $13.80 - @14.20 and heads lower to the next lower High Volume Profile Support Zone of $9.60 - @10.20.
Scenario 2
The price continues lower and finds significant support at the next High Profile Support Zone of $9.60 - @10.20.The Volume Profile Zone of $9.60 - @10.20 is expected to be a very strong support zone where I would be interested to buy for medium term.
Please note these are my own notes, by no means trading advice. Please do your own research before entering into any trade.
A2m milk -LONGA2m setting up for a buy on the weekly. Sitting at the 38 fib level, it could find support a bit lower. I think after xmas this will have a good run.

A2M - Bearish Trend ContinuationBearish Trend Continuation Indications:
1. Bullish Trendline is broken
2. Has been consolidating below the trendline since ten trading sessions.
3. Unable to break above the trendline and close.
4. It did try to move up but was unable to sustain above once, and then fell below.
Scenario 1.
I would be comfortable to buy once it reaches the Buy Zone between $11.22 and $11.95 and shows Bullish Price Action.
Scenario 2.
I would buy when it closes above the swing high trendline for atleast two consecutive days to show that Bulls have regained control.
P.S. My target would be $20.00 level (Previous Resistance), which would be 60% gain.
Please note these are my own notes, by no means trading advice. Please do your own research before entering into any trade.