ATM trade ideas


Possible Bullish CypherHave an EW count chart for this but here is another scenario that could play out also.

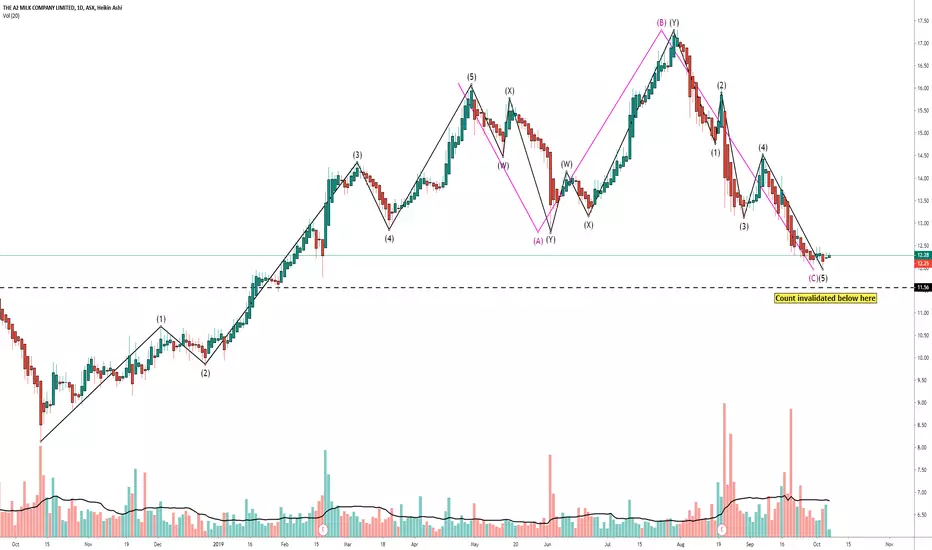
Correctional CountLooking like an irregular expanded flat count which has completed/very close we have an invalidation line marked if we bust below gl.

A2 Milk - Confirmed H&S I reported earlier in the month that A2 Milk was showing a good formation of a head and shoulders pattern.
This week we had a confirmed breakout of the neckline, here is my complete analysis.
Price has fallen and closed below 30EMA (weekly).
Price has fallen and closed below 200EMA (daily).
CCI indicator(daily) is reading 222, which is a sign of strength to the downside.
Mansfield Relative Strength (XAO)(daily) is below zero showing A2M is under performing the All Ords.
Price has closed below Neckline of Head and shoulder pattern for 2 periods (confirmation).
Target price on the down side is roughly $10.7, using a 30EMA weekly as exit once price closes below on weekly time frame.
If you enjoyed this idea, please subscribe for more technical analysis in the future.
Disclaimer - This in not financial advise and may not fit your financial needs, do you own analysis before investing any of your money or seek advice from a qualified financial advisor.

A2M Head & Shoulders - Waiting for final ConfirmationA2 Milk appears to have lost to the bears.
A very distinct head and shoulders pattern has emerged although still not confirmed until neck line is broken.
Taking a look at the relative strength, A2M is under performing the ASX 200 (XJO) which also is a strong bearish sign.
Increased volume on negative candles and on right shoulder shows strong possibility of break down.
Finally the share is closed below the 30 Week EMA, which also signifies a bear movement maybe lurking.
Please note this general advice for educational purposes, carry out your own analysis before entering a position or consult a financial adviser.

A2M - Possible weekly Head and shoulders formationKeeping an eye on A2 Milk as a possible head and shoulder's pattern is emerging.
Definitely not confirmed but a good one to add to the watch-list that's for sure.

A2M A2 Milk, is this overdue for a fall?parabolic gains, thousands of percent in just a few years.... for milk....
over 10B $AUD company
impulse 1 - 2 - 3 - 4 - 5 complete
Head and shoulders at the top
Divergence across RSI from weekly
Diverging descending triangle
haven't looked at fundamentals, was just going through Market capitalization of XAO and saw A2M was at 10 B... sounds over valued to me.
I'm looking for a bullish push in the coming weeks and then a H+S nose dive...
will expand TA in comments
DYOR
Not financial advisor
happy trading
good luck ladies and gentlemen
TTT

A2M - A2 Milk Company up 3.72% in today's sessionA2M - A2 Milk Company up 3.72% in today's session. The share prices hit a critical retracement price level at 14.75 in last week session and have now created a price channel to the upside in today's price movement.
A2 share prices have the potential to head back up as long as it remains within the price channel as indicated on the price chart below.
Short term targets are estimated at 15.70, 16.30, and 16.65

A2 Milk Company up 3.72% in today's sessionA2 Milk Company up 3.72% in today's session. The share prices hit a critical retracement price level at 14.75 in last week session and have now created a price channel to the upside in today's price movement.
A2 share prices have the potential to head back up as long as it remains within the price channel as indicated on the price chart below.
Short term targets are estimated at 15.70, 16.30, and 16.65

ASX:A2M pump for earningsA2M is still good value in the 3 monthly view. With earnings a month away it will probably pump to compensate for increased sales to china according to NZ port data.

Almost a Head and Shoulders here..I might be stretching here to see a H&S from the slightly erratic chart, but lets see how it goes. Once it closes the gap it has free license to fall, giving a great short opportunity of several dollars per share.

A2M New all time closing high breakouttop growth stock moving to new highs with a MACD signal and volatility pattern.

PERFECT WYCKOFF RE-ACCUMULATION - ASX:A2M - THE A2 MILK COMPANYFrom 2015, the A2 Milk Company saw an amazing growth stage from less than $1 a share right up to a peak of $13.78 in February 2018.
On the 22nd February we had obvious climatic action. The stock was up over 50% in two days before retracing on the 22nd.
The stock began to fall. On the 16th May we see our first sign of possible buying interest again with our preliminary support. Large Bar down (using the true range) closing in the middle with a very large spike in volume.
The stock can’t rally so we fall lower. A week later in the 23rd May we get more higher volume but the next day we see a great reaction.
The stock rallies and we see our first indication with a stronger rally then the previous three. This is called our automatic rally.
The stock falls and looks to retest the previous low, notice the volume is a lot lower when we retrace the $9.19 level once again. This is our secondary test.
The first phase of accumulation is complete, we have seen stopping action in the stock.
Phase B sees the stock rally and this time is able to make a higher high than the AR level. We upthrust that level and fall lower.
Phase C begins with a spring of the $9.19 level. The psychology around this is to retest the supply and gauge if weak hands are still holding on. Once they see the $9.19 level broken, we get as low as $8.14. The volume increases and we may have just seen the completion of transfer from weak hands to strong hands, as the stock rallies. Any one that bought at higher levels and has seen the stock test a level three times and that fail it, will panic and sell.
We retest the $9.19 level once again and notice the volume is a lot lower. Phase C is complete.
Over the next three months the stock rallies towards the top of the trading range, with continual tests.
We break through the creek and have our final retest - a back up to the creek, it is on low volume. Perfect retest.
Phase E or “mark up” occurs after this point and the stock begins to move higher on increased volume and demand.
If you had of placed a trade at the “test” area, with a stop under the spring, you would have seen a move of over 50% between November and March.
The point and figure chart has projected a target of $14.89 - $16.68.
Buying in at the $9.30 area, you could have trailed you stop continually up, locking in amazing profits, with one eye on the point and figure targets looking for negative price action that would give you a sign to close your position.
This chart is one to print out and stick on the wall and continually refer to it.


ASX: A2 Milk Limited UpsideA2 Milk ASX:A2M is still bullish. Just be be cautious, daily chart is oversold.
Target: $14.
A break-down below $10.85 will invalidate this outlook.

Entering large supply areasWeekly shows A2M entering areas where significant selling came in in the past. Be careful if you're long.


A2 MilkIt's had a great run up to these supply lines, where they stopped price action dead in it's tracks for the last few days. The low end closes and selling tails of these bars, together with slightly increased selling volume makes A2M look weak. If you're long you could look to take some profits off the table.

A2M.ASX - still think there needs to be another leg downBeen tracking A2M for a long time - still think we need another leg down to complete correction but stock market looks bullish atm.

A2 MilkI'd be looking at exiting or shorting around these levels. There is decreasing volume supporting this current rally.

A2M Bullish SignalA great day for A2M consider the market condition and finally closed above the 200 EMA since beginning of October. Should the market condition remain positive, A2M should be able to test major resistance around $10.40 followed by $10.86!
