Greed Alert: STOXX 50 Momentum Signals But Caution Needed🚨 STOXX50 RESISTANCE BREAKOUT PLAY! 💥 | THIEF TRADER STYLE 🔓📈
🧠 Thief Trader Master Plan: BULLISH ATTACK
🎯 Entry: Breakout above 5420 (Major RESISTANCE WALL 🧱)
🛑 Stop Loss: 5330 — Strict risk control, no funny business 😤
🚀 Target: 5560 — Smart money aims high 💰
👀 We spotted a strong momentum brewin


STOXX50: Still at good place for buysHello,
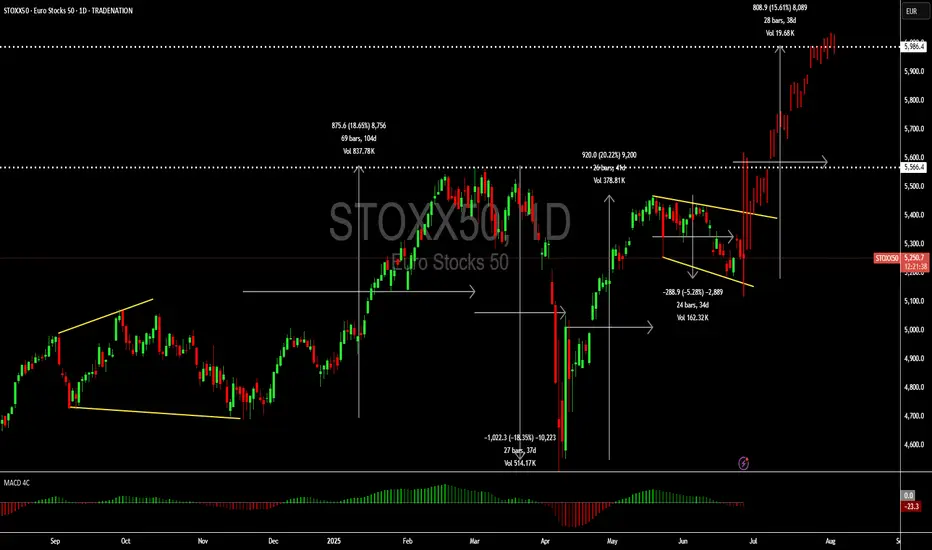
The Eurostocks 50 is in a bullish correction forming an expanding triangle pattern. We still see an opportunity for investors who missed the entry at the bottom of the correction to join the risk averse trade once we have a strong breakout of the corrective pattern. The STOXX50 is coming clo

STOXX50: A great short term buyHello,
I see a short-term buying opportunity with a target of 6,000 for the Euro stocks 50. The EURO STOXX 50 is a stock index of Eurozone stocks designed by STOXX, an index provider owned by the Deutsche Börse Group. The index is composed of 50 stocks from 11 countries in the Eurozone.
EURO STOXX
STOXX "Double Top" resistance retest at 5335The SOXX50 remains in a bullish trend, with recent price action showing signs of a corrective pullback within the broader uptrend.
Support Zone: 5200 – a key level from previous consolidation. Price is currently testing or approaching this level.
A bullish rebound from 5200 would confirm ongoing u

Stoxx50 Bearish reversal resistance at 5,325The Stoxx50 equity index is exhibiting bearish price action sentiment, consistent with the prevailing downtrend. Recent movements show signs of a corrective pullback, suggesting temporary relief within a broader downward structure.
Key Technical Levels:
Resistance:
5,325 – Critical resistance lev

STOXX50 INTRADAY Bullish sideways consolidationTrend: Overall trend remains bullish, supported by rising price action.
Recent Movement: Price is in a sideways consolidation phase after a strong uptrend.
Key Levels
Support:
5310 – Key level from prior consolidation.
5275, then 5230 – Next supports if 5310 breaks.
Resistance:
5480 – First upsid

STOXX INTRADAY consolidation key support at 5310Trend: Overall trend remains bullish, supported by rising price action.
Recent Movement: Price is in a sideways consolidation phase after a strong uptrend.
Key Levels
Support:
5310 – Key level from prior consolidation.
5275, then 5230 – Next supports if 5310 breaks.
Resistance:
5480 – First upsid

"STOXX50/EURO50" Trading Plan: Ride the Wave or Get Trapped?🚨 EUROPEAN INDEX HEIST: STOXX50 Breakout Robbery Plan (Long Setup) 🚨
🌟 Hi! Hola! Ola! Bonjour! Hallo! Marhaba! 🌟
Attention Market Bandits & Index Robbers! 🏦💶💸
Using 🔥Thief Trading tactics🔥, we're targeting the STOXX50/EURO50 for a clean breakout heist. The plan? Go long and escape before the MA tr

STOXX INTRADAY uptrend continuation supported at 5310Trend: Overall trend remains bullish, supported by rising price action.
Recent Movement: Price is in a sideways consolidation phase after a strong uptrend.
Key Levels
Support:
5310 – Key level from prior consolidation.
5275, then 5230 – Next supports if 5310 breaks.
Resistance:
5480 – First upsid

See all ideas
Displays a symbol's price movements over previous years to identify recurring trends.
Frequently Asked Questions
Europe 50 reached its highest quote on Mar 3, 2025 — 5,570.6 EUR. See more data on the Europe 50 chart.
The lowest ever quote of Europe 50 is 1,579.7 EUR. It was reached on Mar 9, 2009. See more data on the Europe 50 chart.
Europe 50 is just a number that lets you track performance of the instruments comprising the index, so you can't invest in it directly. But you can buy Europe 50 futures or funds or invest in its components.