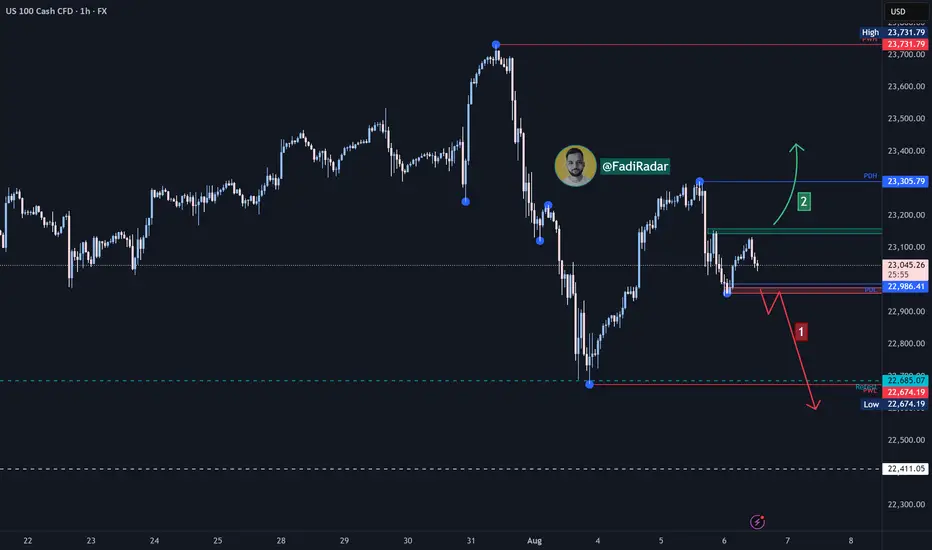
Nasdaq Index Analysis (US100 / NASDAQ):The Nasdaq index saw a slight improvement with today’s market open and is currently trading near 23,000 USD. The short-term trend remains bearish.
1️⃣ A break and close below 22,960 USD may push the price toward 22,670 USD as an initial target.
📉 Holding below that level could open the path to 22,400 USD.
2️⃣ However, if strong buying momentum leads to a break above 23,160 USD and price holds, we could see a move toward 23,300 USD, followed by 23,600 USD.
⚠️ Disclaimer:
This analysis is not financial advice. It is recommended to monitor the markets and carefully analyze the data before making any investment decisions.
NAS100USD trade ideas
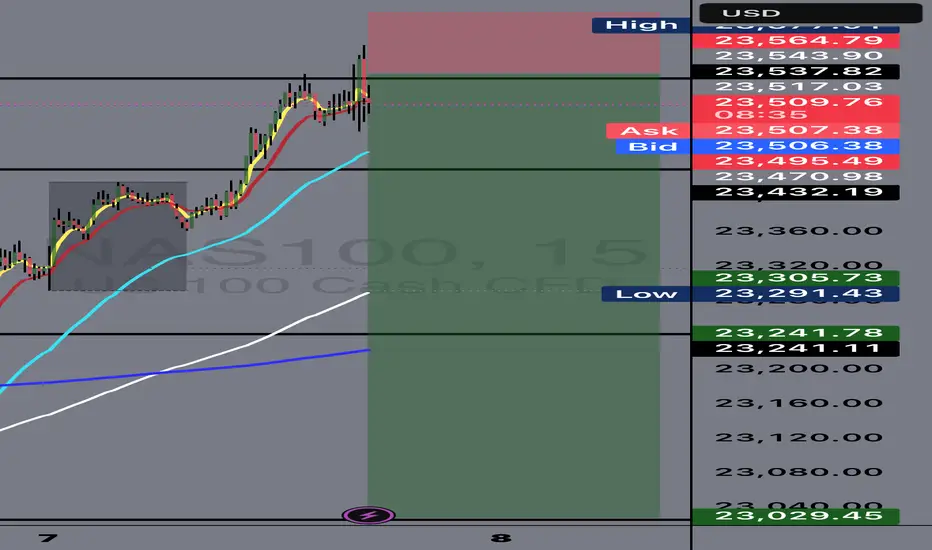
UPDATEFriday we closed on the breakeven after that the price reached our 50% level of the trade, so our TP was raised to the breakeven.
Follow for more trades to catch up the next week!


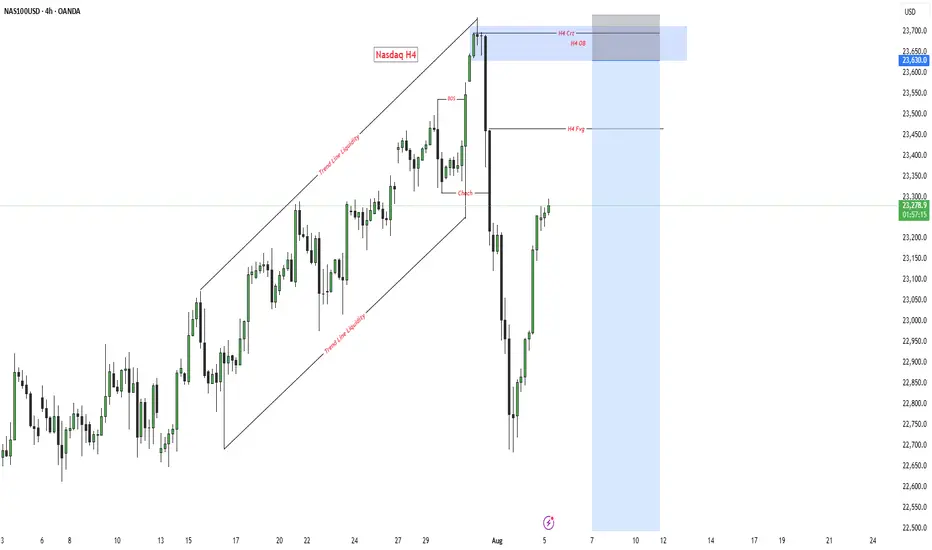
Nasdaq h4✅ NASDAQ H4 – Premium Short Setup
📊 What we are looking at:
✔️ H4 FVG (Fair Value Gap)
✔️ H4 Order Block (OB)
✔️ H4 CRT (Candle Range Theory)
✔️ Trendline Liquidity already taken out
📌 Game Plan:
Price swept trendline liquidity and is now pushing towards H4 FVG.
As soon as it retests the FVG and taps into OB & CRT zone, we’ll look for SELL opportunities from this premium area.
🎯 Target: Next liquidity pool below.
⚠️ Patience = Profit. Wait for confirmation before entry.
🔥 Smart Money never chases – it waits for the market to deliver.
OUR TRADE TODAY ON NASDAQBeen a while since I last posted here, today I’m sharing with you our trade we took 15min ago with an RR of 3
Follow for more

USNAS100 New ATH, looks a Correction...Wall Street Indices Hit Record Highs as AI Momentum Builds
Indices tied to the S&P 500 and Nasdaq reached fresh all-time highs on Thursday, driven by strong earnings reports from Meta and Microsoft. The results reinforced investor optimism that AI investments are delivering tangible returns and fueling future growth.
Meanwhile, Fed Chair Jerome Powell noted it's still too early to predict a rate cut in September, emphasizing that current monetary policy is not constraining economic activity. His comments followed a stronger-than-expected Q2 GDP reading, further supporting the Fed’s cautious stance.
Technical Outlook – USNAS100
After reaching recent highs, the index appears to be entering a corrective phase. A pullback toward 23470 is likely, with bullish momentum expected to resume if the price stabilizes above 23440. A sustained move above that level would target a new ATH near 23870.
However, a break below 23440 could trigger a deeper correction toward 23295.
Support: 23540 • 23440 • 23295
Resistance: 23870 • 24040

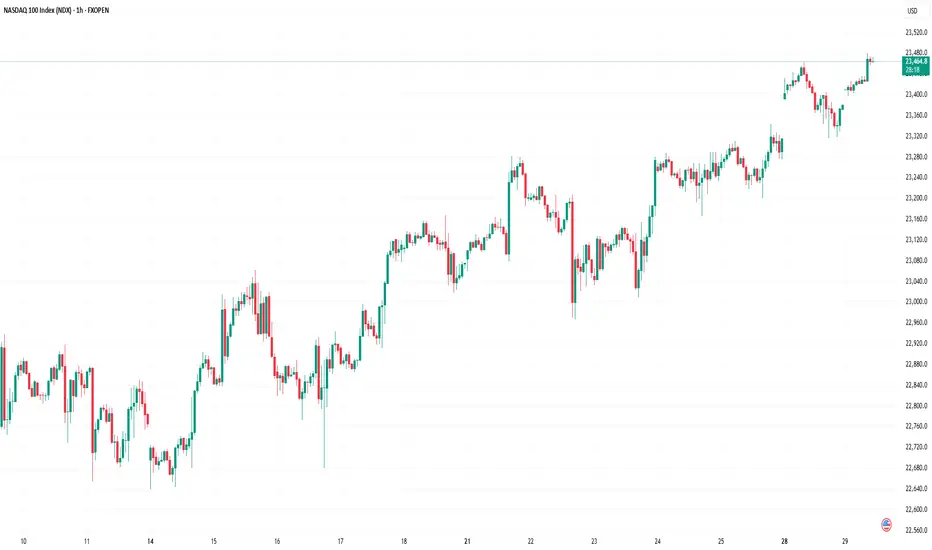
Nasdaq 100 Index Hits New Highs Ahead of Big Tech EarningsNasdaq 100 Index Hits New Highs Ahead of Big Tech Earnings
Earlier, we noted signs of optimism in the Nasdaq 100 index as the market anticipated earnings reports from major tech firms.
Now, companies such as Alphabet (GOOGL) and Tesla (TSLA) have already released their results (we previously covered their charts → here and here). Up next are the most highly anticipated earnings reports: this week, tech giants including Microsoft (MSFT), Amazon (AMZN), Meta Platforms (META), and Apple (AAPL) are set to publish their results. The combined market capitalisation of these four companies exceeds $11 trillion, and their reports could have a significant impact on a stock market that is already showing strong bullish sentiment:
→ The Nasdaq 100 index has climbed to an all-time high, surpassing the 23,400 mark.
→ The signing of trade agreements between the US and Europe (and earlier, Japan) has eased concerns about the negative impact of tariff barriers.
Technical Analysis of Nasdaq 100
The chart supports growing signs of optimism: earlier in July, the price remained within a rising channel (marked in blue). However, towards the end of the month, price action has begun to follow a steeper upward trajectory (marked in purple).
What could happen next? Much will depend on the earnings results and forward guidance from these tech giants.
On the one hand, continued enthusiasm around AI adoption could accelerate further growth. The stronger the optimism, the more fuel it may add to discussions around a potential bubble — with some analysts already drawing parallels to the dot-com era of the early 2000s.
On the other hand, earnings could temper market excitement and prompt a correction. For example, the index may retreat to the support level around 23,020, which is reinforced by the lower boundary of the blue trend channel.
This article represents the opinion of the Companies operating under the FXOpen brand only. It is not to be construed as an offer, solicitation, or recommendation with respect to products and services provided by the Companies operating under the FXOpen brand, nor is it to be considered financial advice.
NAS100 shortElite analysis
Confirmed the entire checklist
Targeting lower liquidity pools.
Main Target NY Low.
This was confirmed from Daily all the way down to 1m.

NASDAQ Potential UpsidesHey Traders, in today's trading session we are monitoring NAS100 for a buying opportunity around 23,140 zone, NASDAQ is trading in an uptrend and currently is in a correction phase in which it is approaching the trend 23,140 support and resistance area.
Trade safe, Joe.

NAS100 Technical Outlook — Final Impulse Before the Fall?
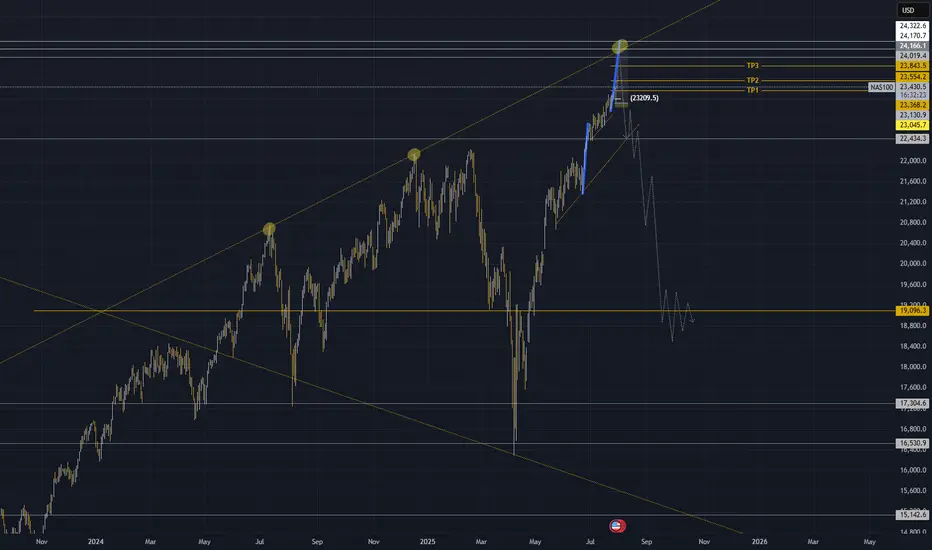
The NAS100 has just completed its 5th touch on a long-term ascending trendline, forming a clear rising wedge pattern. Historically, each touch of this structure has triggered significant bearish reversals — and this time looks no different.
🔹 However, before the major drop, I'm expecting a final impulsive wave of around 1,000 pips— a last bullish move that could stretch toward the 24,300–24,400 zone. This would complete the wave structure and offer a strong sell opportunity.
🔻 After that, a deeper correction is likely, targeting the 19,000 area, which aligns perfectly with:
The midpoint of the wedge on the daily chart
A strong historical support zone
A potential area for medium-term consolidation
⚠️ As long as price remains below 24,400, the bearish scenario remains valid. Any daily close above that level would force a re-evaluation.
🧠 This setup reflects a classic distribution phase followed by a high-probability breakdown.
NAS100 - Update Dear Friends in Trading,
How I see it,
I will be waiting for a clear and decisive break below the PIVOT.
Keynote:
I am not trading NASDAQ at all...just monitoring patiently!!
I will keep you in the loop as the stock market progress...
I sincerely hope my point of view offers a valued insight
Thank you for taking the time study my analysis.

Trend Exhaustion Detected – Bearish Structure AheadUS100 (NASDAQ) 30-minute chart as of July 26, 2025, with technical insights based on the visible elements.
🔍 1. Trend Analysis
Primary Trend: Uptrend (bullish structure)
The price has been respecting a rising parallel channel, marked by:
Ascending support (lower boundary)
Ascending resistance (upper boundary)
Market structure shows:
Higher Highs (HH)
Higher Lows (HL)
✅ This indicates continuation of bullish momentum until structure breaks.
📐 2. Market Structure Elements
Structure Type Label on Chart Price Zone (approx.)
Break of Structure (BOS) BOS (center-left) ~22,950
Higher Low (HL) HL (2x) ~22,700 (1st), ~23,050 (2nd)
Higher High (HH) HH (2x) ~23,150 and ~23,300
Resistance Labelled ~23,300–23,320
Demand Zones Labelled ~22,450–22,700
🔁 Break of Structure (BOS)
The BOS occurred after a prior swing low was broken, followed by a new higher high, confirming a bullish shift.
🧱 3. Support / Resistance Analysis
🔼 Resistance Zone
The price is testing strong resistance around 23,300–23,320
Multiple rejections in this area
Trendline resistance also aligns here
A rejection arrow is drawn, indicating potential bearish reaction
🔽 Support Zone (Immediate)
23,180–23,220: highlighted green box is a local support block
If broken, likely to revisit 23,000–23,050, or even down to 22,900 range
🟩 4. Demand Zones
Zone 1:
22,450–22,600: Strong bullish reaction historically — likely to act as a key demand if a deeper pullback occurs
Zone 2:
22,850–22,950: Validated with prior accumulation & BOS event
🧠 5. Key Observations
Price is at a critical inflection zone:
Testing a resistance zone
At the upper trendline of an ascending channel
A bearish reaction is projected (black arrow)
Possibly targeting the green support zone around 23,180–23,220
If that fails, demand at ~23,000 will likely be tested
Ichimoku Cloud:
Currently price is above the cloud → still bullish
Cloud is thin → potential weakness or upcoming consolidation
⚠️ 6. Trading Bias & Setup Ideas
✅ Bullish Bias (if price holds above ~23,180)
Long entries can be considered on bullish reaction from support
Target: retest of 23,300–23,350 or even breakout continuation
❌ Bearish Bias (if breakdown below support)
Short entry valid below 23,180 with:
TP1: 23,050
TP2: 22,900
A breakdown from the ascending channel would signal trend exhaustion
🔚 Conclusion
Current Price: 23,298.4
Trend: Bullish, but at resistance
Next move: Watch for reaction at resistance and support box below
Bias: Neutral-to-bullish unless the structure breaks below ~23,180

NAS100 - Potential TargetsDear Friends in Trading,
How I see it,
I know I'm posting the same old overbought pattern...
"I think I found a background I like at last - Just Testing"
1) A previously discussed we will notice a "SIGNAL" Type candle
2) It can be on 1HR-4HR-1D TF
3) Today is FOMC and Friday NFP
These two events will for sure give us the signals we need to clarify
the way forward
Let this very important week play out, I'll touch base again next week
I sincerely hope my point of view offers a valued insight
Thank you for taking the time study my analysis.

NASDAQ & NFP- I expect BullishnessHello fellow traders,
Today is NFP and I expect a bulishness as per my PD Arrays analysis. Lets se if it words out.
I have higlighted all important PD Arrays in my chart, keep an eye.
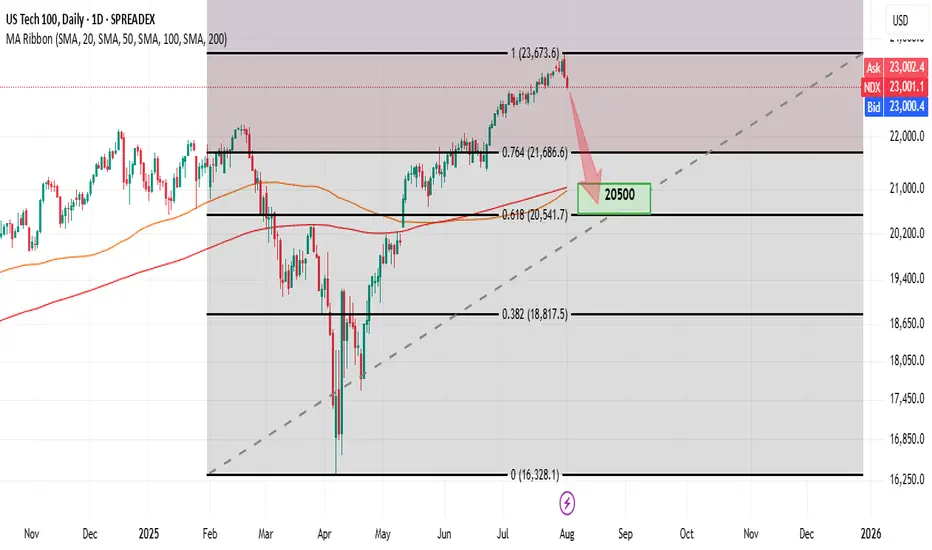
NDX – Double Top & Divergence (H4, D FRL Setup)Hello friends! It's time for our beloved Nasdaq index to cool down. I expect a correction amid the strengthening of the dollar.
H4: clear Double Top forming near 23,000.
Daily: bearish MACD divergence confirms momentum shift.
📐 FRL (H4): neckline at 23,000, perfectly aligned with 100 SMA on H4.
🎯 Target: 0.618 Fib retracement at 20,500 – confluence with 100 & 200 SMA on Daily and strong horizontal support.
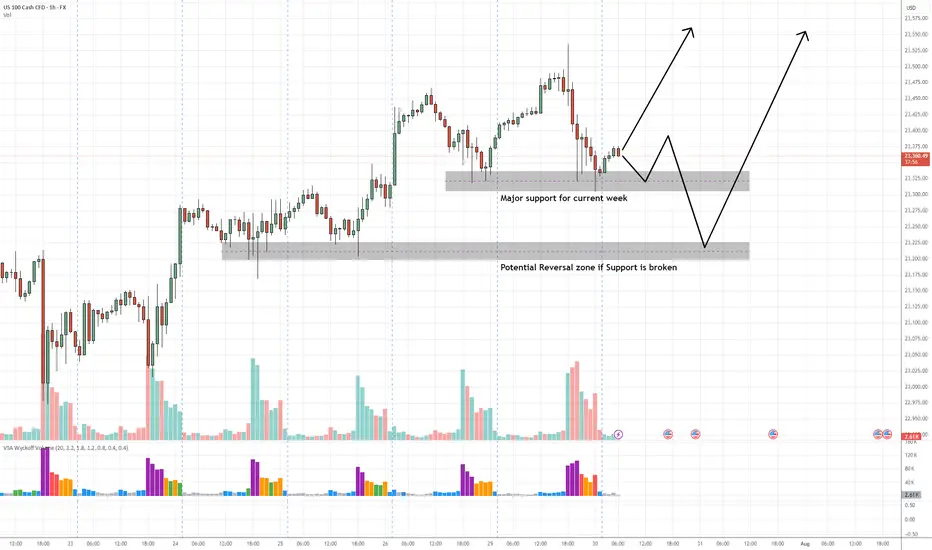
NAS100 Buy Setup – VSA & Multi-Zone Demand Analysis✅ Primary Entry Zone: Major support for current week (around 23,325–23,350)
✅ Secondary Entry Zone: Potential reversal zone if primary support is broken (around 23,200–23,230)
🎯 Target 1 (TP1): Previous swing high near 23,500
🎯 Target 2 (TP2): Extension above 23,550
🛑 Stop Loss (SL): Below 23,170 (beyond secondary reversal zone to avoid false breaks)
📊 Technical Insight (VSA & Price Action Structure)
Support Structure:
The current major support zone has been tested multiple times with no follow-through selling, indicating strong buying interest from larger players.
Volume Spread Analysis Observations:
On the recent decline into the major support zone, we see wider spreads on high volume followed by narrow range candles on lower volume, a classic sign of stopping volume and supply exhaustion.
Within the secondary reversal zone, historical reactions show climactic volume spikes leading to sharp reversals, suggesting this level is watched closely by smart money.
Any test back into the zone on low volume would confirm the No Supply (NS) condition.
Trade Pathways:
Scenario 1: Price respects the major support and begins to climb, confirming demand dominance → target TP1 then TP2.
Scenario 2: Support is temporarily breached, triggering a liquidity grab into the secondary reversal zone, followed by a bullish reversal bar on high volume → strong buy signal with potentially faster move toward TP levels.
📍 Bias: Bullish as long as price holds above the secondary reversal zone.
📌 Execution Tip: Wait for a wide spread up-bar on increased volume from either zone to confirm the start of the markup phase.
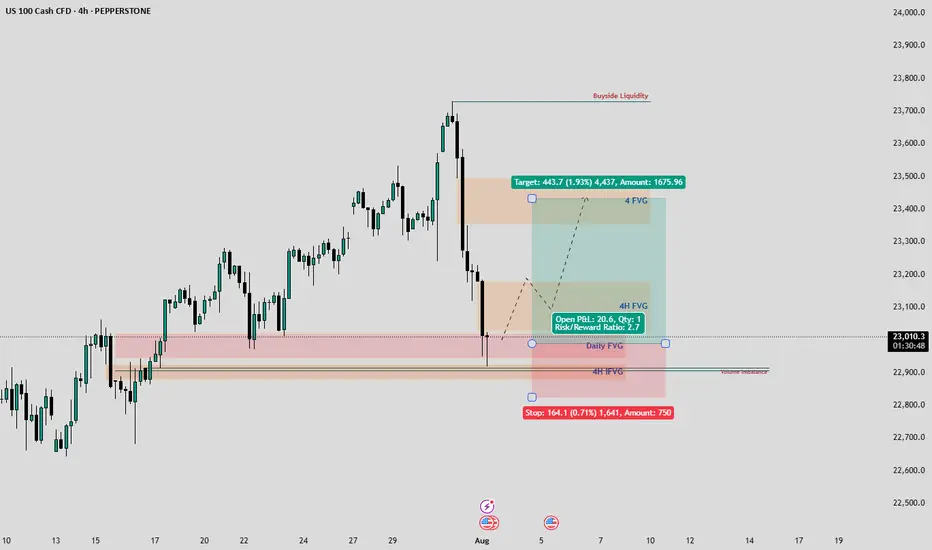
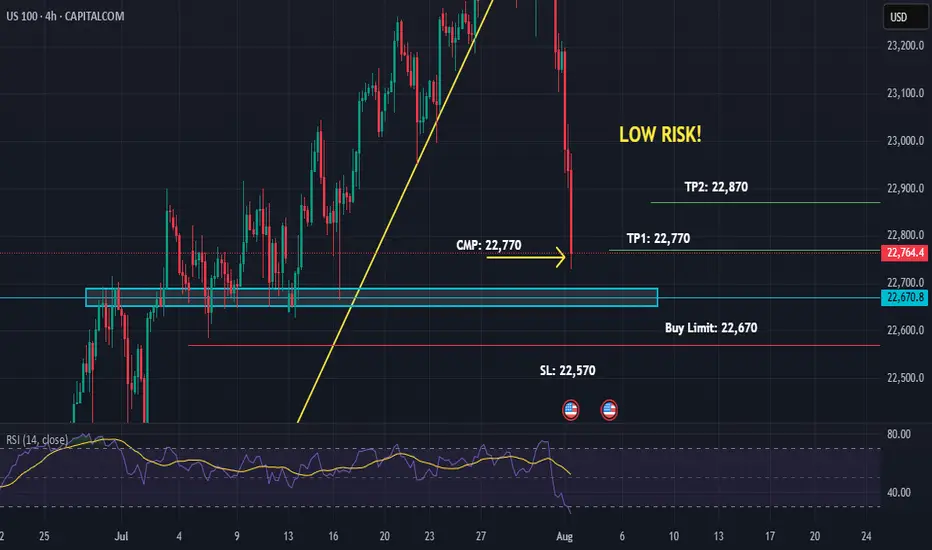
US100 Buy-Limit on Support 4HUS100 Buy-Limit on Support 4H
01-08-25
06:57 PM
Low Risk Trade because market is bearish!
CASH100 (NASDAQ) CRASH - Head and shoulders Risk/reward = 3.7
Entry price = 23 430
Stop loss price = 23 503.2
Take profit level 1 (50%) = 23 202
Take profit level 2 (50%) = 23 099
Still waiting for some variables to confirm before entering the trade
NAS - LET'S MAKE MILLIONS Team, last night NAS I was expect the FALL BACK as I predicted rate un-change will get NASTY on both DOW AND NAS.
So I have a set up entry LONG, i didnt expect the NAS flying to the moon.
both target hit so fast in 15 minutes
However, today is another opportunity to SHORT NAS on the current market at 23613-23625
STOP LOSS AT 23720
Once the NAS pull back toward 23580-65 - BRING STOP LOSS TO BE
TARGET 1: at 23540-20
TARGET 2: at 23480-65
LETS GO

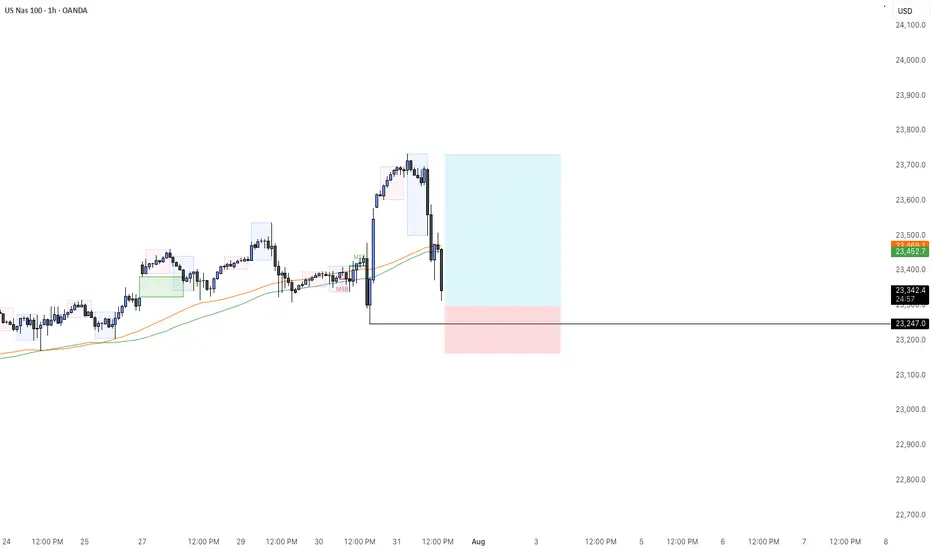
NAS100 - BUYHuge drop as expected today. Now that we are reaching its key level of interest, I will wait for a buy confirmation to take our last nights highs.
Fibonacci Retrace Strategy NAS100 Trade Idea📈 NASDAQ 100 (NAS100) is holding a strong bullish trend 🚀. After a weekend gap-up 🕳️➡️📈, price retraced back into the gap zone—exactly what you'd expect in a healthy trending market.
🔍 I'm applying my Fibonacci Expansion + Retrace Strategy 🔢, watching closely for a pullback into equilibrium ⚖️ within the previous price swing. That’s where I’ll be waiting for a bullish market structure break 🔓📊 to confirm my long bias.
🧠 Patience is key here—let the setup come to you.
📌 As always, this is not financial advice!

US100 Index – Potential Bearish Reversal in Key Resistance Zone🧠 US100 Index – Potential Bearish Reversal in Key Resistance Zone
Timeframe: 30-Minute | Chart Published: July 24, 2025
---
🔍 Overview
The US100 (NASDAQ) has been trading in a well-structured ascending channel, forming higher highs and higher lows. However, recent price action suggests that the index is testing a critical supply zone near 23,400, with signs of weakening bullish momentum. This may signal a potential corrective phase or bearish reversal.
---
📈 Technical Analysis Breakdown
🔵 Trend Structure:
Price is respecting a clear ascending trendline (blue), connecting multiple higher lows.
Multiple bullish flag/channel formations have been completed within the uptrend, showing healthy momentum until the current point.
🟥 Resistance Zone:
Strong supply zone marked between 23,250 – 23,450.
Price action shows stalling candles and rejection wicks within this zone, indicating buyer exhaustion.
⚠ Bearish Patterns:
The red path projection suggests a head and shoulders-like structure forming at the top of the channel.
This, along with divergence in wave strength and shrinking momentum, supports a potential reversal.
🔵 Key Support:
First support lies around 23,000 — aligning with the ascending trendline and previous consolidation.
If broken, next demand zone is around 22,835 – 22,900, where historical consolidation took place.
---
🔁 Projected Scenario (as per visual path)
1. Price may attempt one last push into the 23,400–23,450 zone (possible false breakout).
2. Rejection from this level could trigger a fall toward the ascending trendline support.
3. A confirmed break of the trendline can lead to a larger correction toward the 22,800 zone.
---
🧠 Unique Insight
This chart combines multi-timeframe structure recognition with a real-time reversal formation inside a long-standing bullish trend. The analysis doesn’t just rely on textbook patterns—it recognizes real-time price behavior shifts, which makes it valuable for proactive traders.
---
📌 Conclusion
While the trend remains bullish overall, caution is warranted as the US100 approaches a historically significant resistance zone. The setup offers a compelling risk-reward short opportunity for aggressive traders, especially if the price confirms a break below trendline support.
---
🔧 Next Steps for Viewers
> “Watch for a clean rejection candle or lower high at resistance before entering short. If trendline breaks cleanly, 22,835 could be the next target zone.”
