SG30 - Clean Price actionHi all,
Here we are breaking down SG30
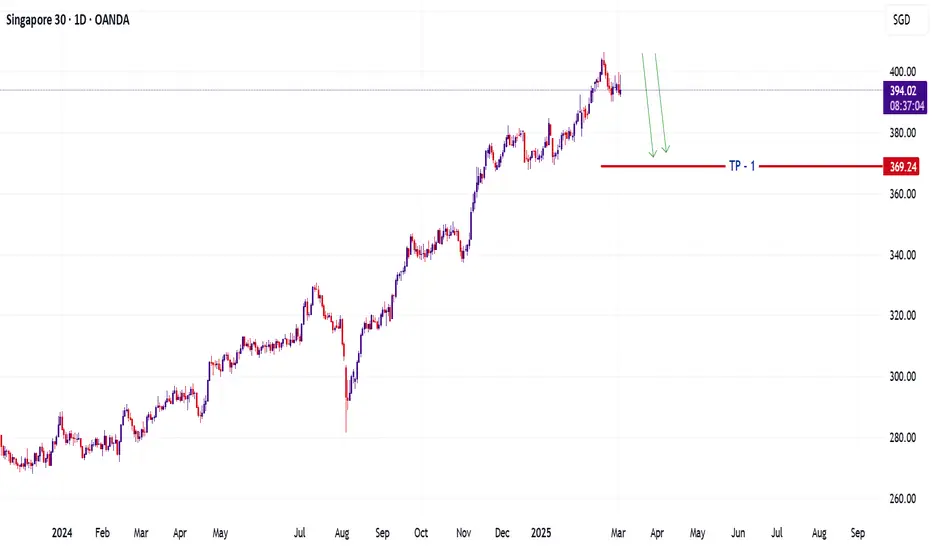
Clearly we are in a very strong Bullish Trend and we have been for a while now, I would preferred to look at trade ideas supporting the trend continuation.
The Preferred Trade Idea would be a break out of this Consolidation phase which is a wedge pattern

#040 Trust The Process SG30SGD Sell 1315SGT 28022025Selling.
I randomly opened the 60SMA on my screen's indicator list because it said that the indicator needs updating.
Yesterday night, I saw that price would go opposite to the 60SMA(when it's choppy. But I do not purposely try to make things work the same on every trade. I just see it, and take i

#030 Trust The Process SG30SGD Sell 0359SGT 26022025Unable to take SG30SGD on Oanda demo account with the leverage at 20:1.
Besides that, the position is 34 lots per position I think. No idea how they could it. I could be wrong. I am using 100k demo account.
Maybe with that kind of leverage, i could only take trades on higher time frame with bigger
#015 Trust The Process SG30SGD Buy 1127SGT 24022025Buying at the rebound of the major trendline.
Currently, my PNL is at -9.66R floating plus confirmed and exited orders.
Let's go.
Shall come back later.
---
Consistency.
What if I randomly took buy and sell positions? Would I still be able to be a consistent loser?
While waiting for orders to

#014 Trust The Process SG30SGD Buy 1111SGT 21022025Third buy. Lost twice. LOL.
I am thinking that I should take the opposite direction in order to lose, because I felt that price has already bottomed out. But then, that would be my deviating from my original plan.
I should just continue doing what I am doing. Trading with the trend if it's trendin

#012 Trust The Process SG30SGD 1626SGT 20022025I re-entered SG30SGD.
Price is obviously going up, so, I entered on the long side.
Can't wait to complete this shizz.
1627SGT 20022025

#010 Trust The Process SG30SGD(Oanda) 1600SGT 20022025I bought this product yesterday but I forgot to write a post on it.
Anyway, this pos retraced and we lost. hahaha!
1601SGT 20022025

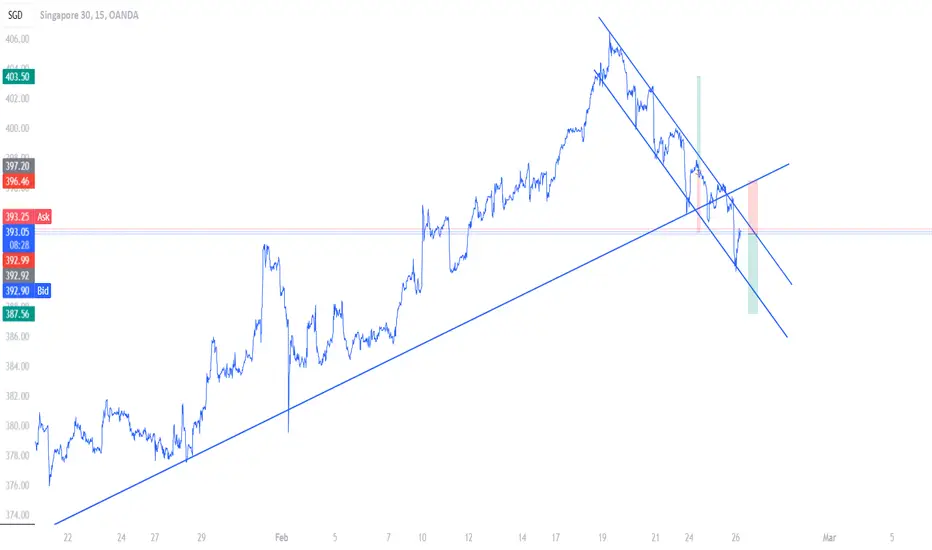
Asian stock market looking strongPlaced a buy order on the Singapore 30 last week as price has continued to show strong bullish momentum.
Price not only broke past its bullish order block at 291.95 but it also give us a breakout on its downward fan showing that it is going to continue to push to the upside.
Buyers should look to

Result for the "..." ExperimentNice drawing that almost makes sense. Interestingly enough, these shapes were there before the coincidences eventually made sense. Related idea: ...

See all ideas
Displays a symbol's price movements over previous years to identify recurring trends.