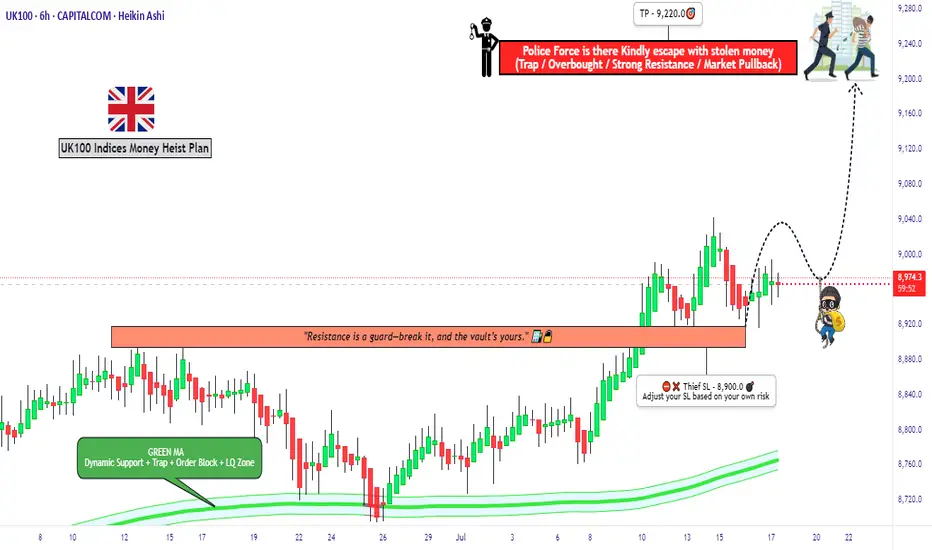
"UK100 Bulls Vault Open! Grab the Loot & Escape Early"🏴☠️💰"UK100 / FTSE100 Market Heist Blueprint" – A Thief Trading Operation for High-Profit Target Extraction 💼📈
🌍 Hola! Hi! Bonjour! Ola! Hallo! Marhaba!
To all the Market Robbers, Smart Thieves, and Strategic Money Makers — welcome to another Thief Trading Heist Plan™.
Ready your gear and charts — the UK100 / FTSE100 index is our next vault.
🔥Heist Objective: Swipe the Bullish Loot Before the Police Trap Hits! 🔥
Based on sharp Thief-style technical and macro-fundamental analysis, the market is showing bullish exhaustion and early signs of trap reversal zones. Our goal is clear: extract max value from the bulls and escape before the heat catches on.
🚨The current price action is nearing a Red Zone — high-risk area filled with potential police traps (supply zones, resistance, and bear setups). Timing and smart entries are key.
🎯 Strategy Overview (Day/Swing Trade)
Entry Plan:
🟢 “The Vault’s Open!” – Start accumulating long positions now or set buy limits near recent 15m/30m swing lows. Layer your entries (DCA method) for better control and efficiency.
Stop Loss (SL):
🔐 SL below recent swing low on 4H timeframe (~8900.0)
Adjust based on your risk appetite, position size, and how many layered orders you've got lined up.
Target Zone (TP):
🏁 Primary Target: 9220.0
Always be ready to exit early if market signals shift. He who escapes lives to rob another day.
🧲 Scalpers Note:
Only operate long within this framework. Big capital players can jump in earlier; others can trail behind with the swing traders. Always use trailing SLs to lock in stolen loot and reduce exposure.
📰 What's Driving the Market?
Current bullish sentiment is backed by:
Fundamental strength
Sentiment & COT reports
Macro data & intermarket correlation
Geopolitical & institutional flow analysis
Stay updated through your reliable sources and plug into key market dynamics and positioning reports.
⚠️ Trading Precaution:
🚫 Avoid new positions during high-impact news
💼 Manage your trades with care
🔁 Use trailing SLs to secure profits during volatility
💥Boost the Robbery – Support the Crew💥
If this heist plan aligns with your mission, smash that Boost button. Support the thief movement, and let’s build a strong trading crew where money is made with precision, strategy, and no mercy. 💰🤑
🔒 Final Notes (Read Before You Rob):
📌 This is a strategic trade setup, not financial advice. Always tailor the plan based on your risk management, capital size, and market conviction.
📌 Markets evolve. Stay alert, adapt fast, and trade like a thief — unseen, smart, and always two steps ahead.
💬Drop your thoughts, results, or setups below — and if you're in, type "HEIST READY" in the comments.
Stay tuned, another plan is on the way... 🏴☠️📊🔥
UK100GBP trade ideas
uk100 crazy pump - time to SHORTTeam, those who SHORT UK100, make sure stop loss at 9175
Target 1 at 9135-32
Target 2 at 9109-16
Last few months, UK100 has been aggressively cutting rate due to expose in recession. But now they are out of the wood.
The market has been over pricing and over value.
We expect the market to come down.

UK100 short - head and shoulders H4Risk/ reward = 4.6
Entry = 8 998.5
Stop loss = 9 034.2
Take profit level 1 = 8 859.8
Take profit level 2 = 8 794
Still need confirmation,
Waiting for H4 candle to close at 23.00 and will need to validate volume.

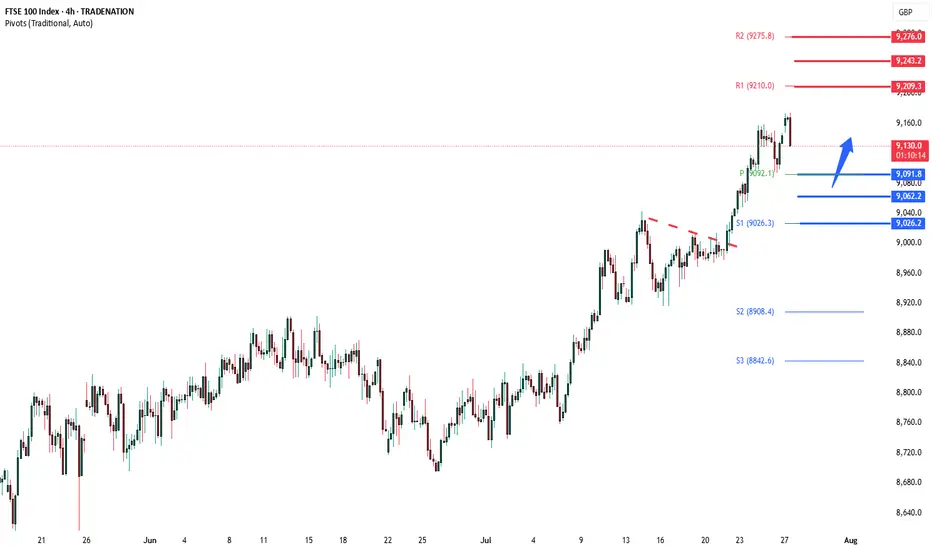
FTSE corrective pullback support at 9092The FTSE remains in a bullish trend, with recent price action showing signs of a corrective pullback within the broader uptrend.
Support Zone: 9092 – a key level from previous consolidation. Price is currently testing or approaching this level.
A bullish rebound from 9092 would confirm ongoing upside momentum, with potential targets at:
9210 – initial resistance
9243 – psychological and structural level
9276 – extended resistance on the longer-term chart
Bearish Scenario:
A confirmed break and daily close below 9092 would weaken the bullish outlook and suggest deeper downside risk toward:
9062 – minor support
9026 – stronger support and potential demand zone
Outlook:
Bullish bias remains intact while the FTSE holds above 9092. A sustained break below this level could shift momentum to the downside in the short term.
This communication is for informational purposes only and should not be viewed as any form of recommendation as to a particular course of action or as investment advice. It is not intended as an offer or solicitation for the purchase or sale of any financial instrument or as an official confirmation of any transaction. Opinions, estimates and assumptions expressed herein are made as of the date of this communication and are subject to change without notice. This communication has been prepared based upon information, including market prices, data and other information, believed to be reliable; however, Trade Nation does not warrant its completeness or accuracy. All market prices and market data contained in or attached to this communication are indicative and subject to change without notice.
BOOM📈 What If You Built a Position Here?
FTSE100. March–April lows.
Three consecutive BUY signals from ELFIEDT RSI + Reversion.
Each one stacking confidence.
Each one building conviction.
Each one right before the entire market exploded higher.
And it wasn’t just FTSE…
🟢 US500? Triggered.
🟢 DOW? Triggered.
🟢 Gold? Sold from the top.
🟢 DAX? Sniped the reversal.
⸻
This was the opportunity to build.
🔁 Layer in across global indices
📊 Trust structure + RSI confluence
📈 Let momentum handle the rest
No panic. No signals every candle.
Just clarity at the bottom — and then the run.
⸻
🧠 What This Teaches Us:
✅ Buy strength, not noise
✅ Use higher timeframe RSI exhaustion as foundation
✅ Let the system compound your edge
This isn’t “catching dips.”
This is building high-probability positions before the world sees it.
⸻
💬 DM “GLOBAL ENTRY” if you’re serious about adding this to your strategy
📲 Follow for multi-market, multi-timeframe setups with edge
🔒 Build better entries. Build better conviction. Build better trades.

Another one?📉 The Drop Looked Scary… But This Indicator Saw the Opportunity.
FTSE100 plunged. Traders panicked.
But our ELFIEDT RSI + Reversion script printed BUY — right at the bottom.
🟢 The Entry? Simple:
✅ RSI dipped far below its comfort zone
✅ Candle tagged our reversion level
✅ Buy signal confirmed in real-time
✅ Price snapped back like a slingshot
👉 Most traders wait for news.
👉 We act on structure, timing, and confluence.
This wasn’t luck.
This was the system — again.
⸻
🔍 HOW TO CATCH MOVES LIKE THIS:
1. Watch for RSI extremes into open volatility
2. Wait for overshoot into reversion band
3. Let the indicator confirm with a green arrow
4. Enter. Set stop just below signal candle
5. Let momentum do the work 💥
⸻
💡 You could’ve been LONG from the low.
💰 You could’ve caught 40+ points in minutes.
Want this on your chart?
🔓 DM “UK ENTRY” to unlock access.
📈 Follow for setups that actually work.

FTSE rally resistance at 9150The FTSE remains in a bullish trend, with recent price action showing signs of a corrective pullback within the broader uptrend.
Support Zone: 9045 – a key level from previous consolidation. Price is currently testing or approaching this level.
A bullish rebound from 9045 would confirm ongoing upside momentum, with potential targets at:
9150 – initial resistance
9172 – psychological and structural level
9200 – extended resistance on the longer-term chart
Bearish Scenario:
A confirmed break and daily close below 9150 would weaken the bullish outlook and suggest deeper downside risk toward:
9018 – minor support
8980 – stronger support and potential demand zone
Outlook:
Bullish bias remains intact while the FTSE holds above 9150. A sustained break below this level could shift momentum to the downside in the short term.
This communication is for informational purposes only and should not be viewed as any form of recommendation as to a particular course of action or as investment advice. It is not intended as an offer or solicitation for the purchase or sale of any financial instrument or as an official confirmation of any transaction. Opinions, estimates and assumptions expressed herein are made as of the date of this communication and are subject to change without notice. This communication has been prepared based upon information, including market prices, data and other information, believed to be reliable; however, Trade Nation does not warrant its completeness or accuracy. All market prices and market data contained in or attached to this communication are indicative and subject to change without notice.

FTSE 100 Wave Analysis – 23 July 2025- FTSE 100 broke resistance level 9030.00
- Likely to rise to resistance level 9200.00
FTSE 100 Index recently broke above the resistance level 9030.00, which stopped the previous minor impulse wave 1 at the start of July.
The breakout of the resistance level 9030.00 continues the active minor impulse wave 3 – which belongs to the intermediate impulse wave (3) from the end of July.
Given the clear daily uptrend, FTSE 100 Index can be expected to rise to the next resistance level 9200.00 (target price for the completion of the active impulse wave 3).
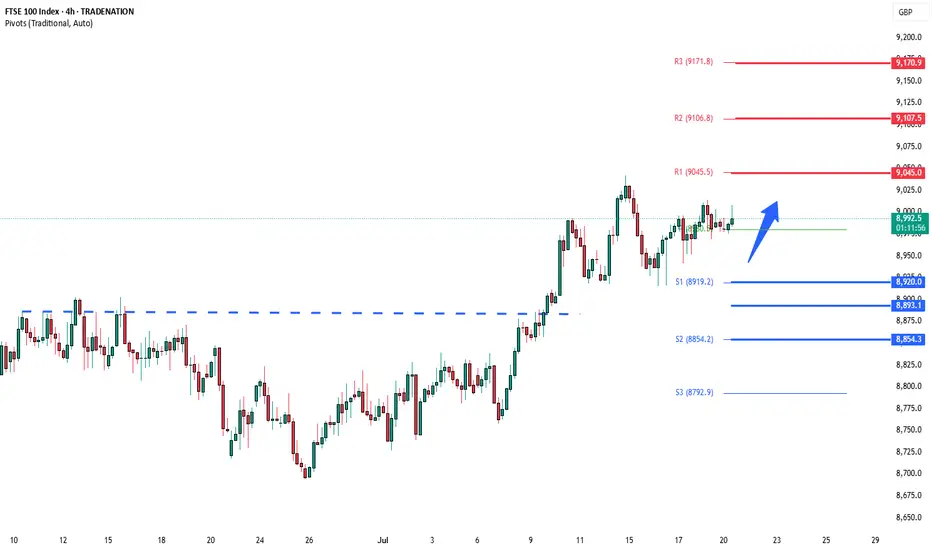
FTSE100 breakout zone now new support at 9030The FTSE remains in a bullish trend, with recent price action showing signs of a continuation breakout within the broader uptrend.
Support Zone: 9030 – a key level from previous consolidation. Price is currently testing or approaching this level.
A bullish rebound from 9030 would confirm ongoing upside momentum, with potential targets at:
9107 – initial resistance
9140 – psychological and structural level
9170 – extended resistance on the longer-term chart
Bearish Scenario:
A confirmed break and daily close below 9030 would weaken the bullish outlook and suggest deeper downside risk toward:
8980 – minor support
8920 – stronger support and potential demand zone
Outlook:
Bullish bias remains intact while the FTSE holds above 9030. A sustained break below this level could shift momentum to the downside in the short term.
This communication is for informational purposes only and should not be viewed as any form of recommendation as to a particular course of action or as investment advice. It is not intended as an offer or solicitation for the purchase or sale of any financial instrument or as an official confirmation of any transaction. Opinions, estimates and assumptions expressed herein are made as of the date of this communication and are subject to change without notice. This communication has been prepared based upon information, including market prices, data and other information, believed to be reliable; however, Trade Nation does not warrant its completeness or accuracy. All market prices and market data contained in or attached to this communication are indicative and subject to change without notice.

FTSE bullish consolidation resistance at 9045The FTSE remains in a bullish trend, with recent price action showing signs of a corrective pullback within the broader uptrend.
Support Zone: 8020 – a key level from previous consolidation. Price is currently testing or approaching this level.
A bullish rebound from 8920 would confirm ongoing upside momentum, with potential targets at:
9045 – initial resistance
9107 – psychological and structural level
9170 – extended resistance on the longer-term chart
Bearish Scenario:
A confirmed break and daily close below 8920 would weaken the bullish outlook and suggest deeper downside risk toward:
8893 – minor support
8854 – stronger support and potential demand zone
Outlook:
Bullish bias remains intact while the FTSE holds above 8920. A sustained break below this level could shift momentum to the downside in the short term.
This communication is for informational purposes only and should not be viewed as any form of recommendation as to a particular course of action or as investment advice. It is not intended as an offer or solicitation for the purchase or sale of any financial instrument or as an official confirmation of any transaction. Opinions, estimates and assumptions expressed herein are made as of the date of this communication and are subject to change without notice. This communication has been prepared based upon information, including market prices, data and other information, believed to be reliable; however, Trade Nation does not warrant its completeness or accuracy. All market prices and market data contained in or attached to this communication are indicative and subject to change without notice.
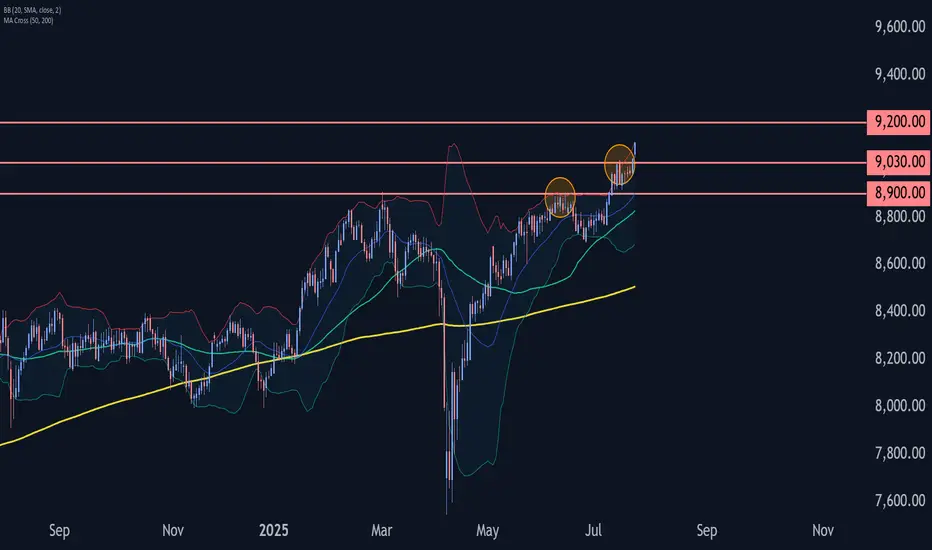
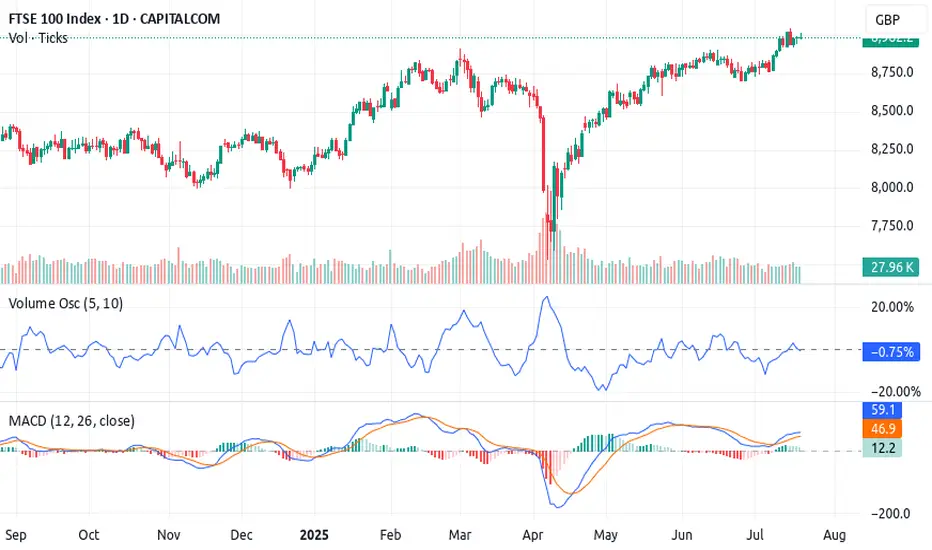
The 3-Step Rocket Booster Strategy – UK100 Bullish Breakout 🚀 The 3-Step Rocket Booster Strategy – UK100 Bullish Breakout Brewing
The UK100 Index is currently aligning perfectly with a high-probability setup I call the 3-Step Rocket Booster Strategy
— a momentum-based play designed to catch strong breakouts before the crowd reacts.
---
🔍 Strategy Breakdown:
✅ Step 1: Price above the 50 EMA
This signals short-term bullish momentum. The UK100 has cleared the 50 EMA decisively, with candles holding strong above it — suggesting buyers are stepping in aggressively.
✅ Step 2: Price above the 200 EMA
Now we’ve got long-term trend confirmation. The index is trending above the 200 EMA, meaning bulls have full control of the higher timeframe direction.
⚠️ Step 3: The Gap-Up with Volume Confirmation
Here’s the key — the "booster". We’re watching for a gap-up move , validated by a Volume Oscillator breakout . While
price has already lifted, the volume hasn’t exploded just yet — this is the final ignition phase before liftoff.
---
📈 Technical Indicators:
MACD: Bullish crossover active — momentum building
Volume Oscillator: Starting to curve upward, hinting at upcoming volume expansion
EMAs: 50 EMA > 200 EMA = confirmed bullish structure
Support Zones : Holding cleanly above recent resistance-turned-support, adding confluence
---
🟢 Trade Insight:
We are now sitting in the perfect entry zone — price is in the pocket before volume confirms . Once volume breaks out, we could see a parabolic move , especially if global market sentiment remains stable.
🎯 Potential Targets :
First target: Recent high (psychological + structural level)
Second target: Measured move based on gap range extension
Risk: A close below the 50 EMA invalidates the setup
---
🔁 Summary:
This setup ticks all three boxes of the 3-Step Rocket Booster Strategy .
The smart money is positioning before the volume shows up. The UK100 is a strong bullish candidate with low-risk entry and high reward potential — don’t ignore this one .
---
📌 Disclaimer: Always use proper risk management. Trade the setup, not the emotion.Use a simulation trading account before you trade with real money
Let me know if you’re tracking this setup too 👇
FTSE100 sedeways consolidation supported at 8920The FTSE100 pair price action sentiment appears Bullish, supported by the current rising trend. The recent intraday price action appears to be a sideways consolidation breakout.
The key trading level is at 8920 level, the previous consolidation price range. A corrective pullback from the current levels and a bullish bounce back from the 8920 level could target the upside resistance at 9040 followed by the 9090 and 9130 levels over the longer timeframe.
Alternatively, a confirmed loss of the 8920 support and a daily close below that level would negate the bullish outlook, opening the way for a further retracement and a retest of 8880 support level, followed by 8840 levels.
This communication is for informational purposes only and should not be viewed as any form of recommendation as to a particular course of action or as investment advice. It is not intended as an offer or solicitation for the purchase or sale of any financial instrument or as an official confirmation of any transaction. Opinions, estimates and assumptions expressed herein are made as of the date of this communication and are subject to change without notice. This communication has been prepared based upon information, including market prices, data and other information, believed to be reliable; however, Trade Nation does not warrant its completeness or accuracy. All market prices and market data contained in or attached to this communication are indicative and subject to change without notice.

FTSE100 overbought pullback supported at 8880The FTSE remains in a bullish trend, with recent price action showing signs of a corrective pullback within the broader uptrend.
Support Zone: 8880 – a key level from previous consolidation. Price is currently testing or approaching this level.
A bullish rebound from 8880 would confirm ongoing upside momentum, with potential targets at:
8900 – initial resistance
9040 – psychological and structural level
9090 – extended resistance on the longer-term chart
Bearish Scenario:
A confirmed break and daily close below 8880 would weaken the bullish outlook and suggest deeper downside risk toward:
8840 – minor support
8820 – stronger support and potential demand zone
Outlook:
Bullish bias remains intact while the FTSE holds above 8880. A sustained break below this level could shift momentum to the downside in the short term.
This communication is for informational purposes only and should not be viewed as any form of recommendation as to a particular course of action or as investment advice. It is not intended as an offer or solicitation for the purchase or sale of any financial instrument or as an official confirmation of any transaction. Opinions, estimates and assumptions expressed herein are made as of the date of this communication and are subject to change without notice. This communication has been prepared based upon information, including market prices, data and other information, believed to be reliable; however, Trade Nation does not warrant its completeness or accuracy. All market prices and market data contained in or attached to this communication are indicative and subject to change without notice.
FTSE INTRADAY continuation pattern breakout. The FTSE remains in a bullish trend, with recent price action showing signs of a corrective pullback within the broader uptrend.
Support Zone: 8880 – a key level from previous consolidation. Price is currently testing or approaching this level.
A bullish rebound from 8880 would confirm ongoing upside momentum, with potential targets at:
8900 – initial resistance
9040 – psychological and structural level
9090 – extended resistance on the longer-term chart
Bearish Scenario:
A confirmed break and daily close below 8880 would weaken the bullish outlook and suggest deeper downside risk toward:
8840 – minor support
8820 – stronger support and potential demand zone
Outlook:
Bullish bias remains intact while the FTSE holds above 8880. A sustained break below this level could shift momentum to the downside in the short term.
This communication is for informational purposes only and should not be viewed as any form of recommendation as to a particular course of action or as investment advice. It is not intended as an offer or solicitation for the purchase or sale of any financial instrument or as an official confirmation of any transaction. Opinions, estimates and assumptions expressed herein are made as of the date of this communication and are subject to change without notice. This communication has been prepared based upon information, including market prices, data and other information, believed to be reliable; however, Trade Nation does not warrant its completeness or accuracy. All market prices and market data contained in or attached to this communication are indicative and subject to change without notice.
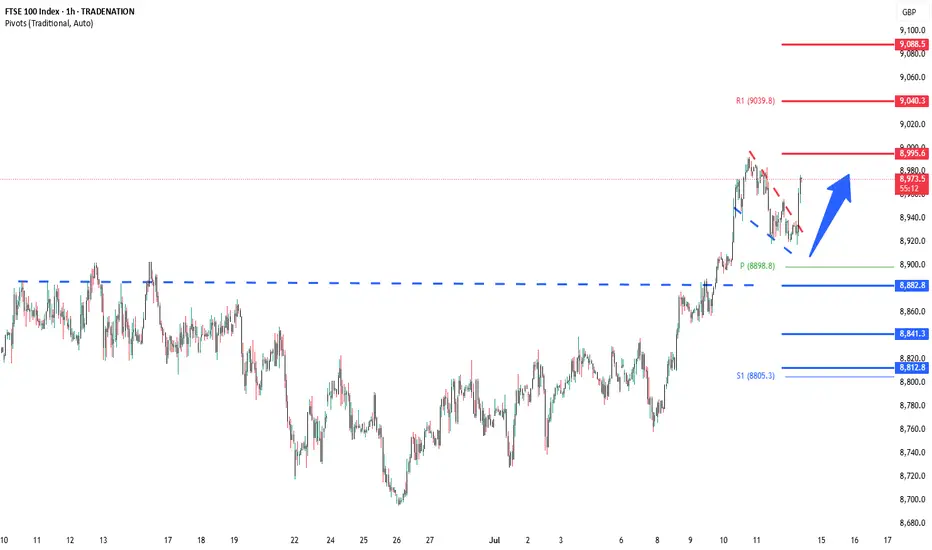
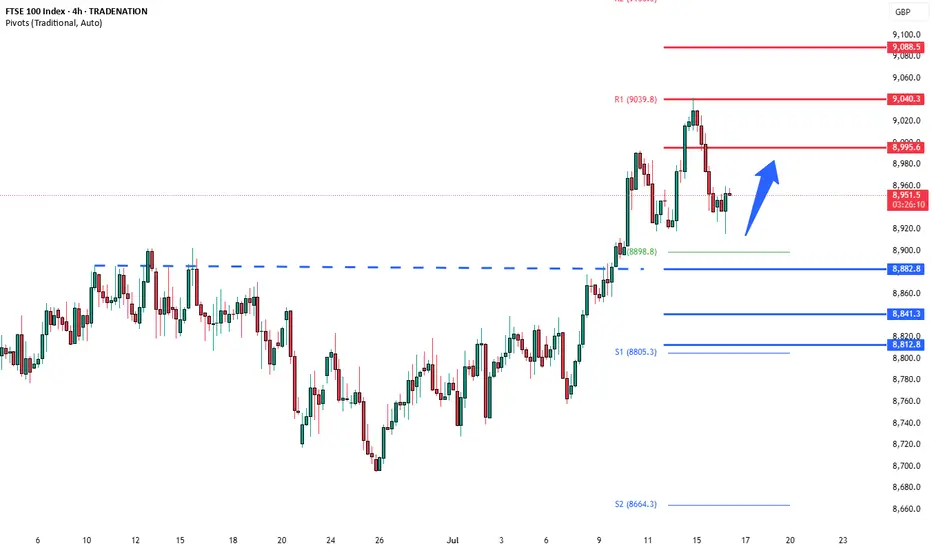
UK100 – Buy the Dip Near Support as Bottom FormsTrade Idea
Type: Buy Limit
Entry: 8,905
Target: 9,015
Stop Loss: 8,867
Duration: Intraday
Expires: 15/07/2025 06:00
Technical Overview
Price action is forming a potential bottom, suggesting that downside momentum is slowing.
The primary trend remains bullish, with no clear indication that the broader uptrend is ending.
The strategy favors buying on dips, supported by bespoke support at 8,905, offering a low-risk entry area.
If price moves above 9,015, it would confirm a rebound and support a move toward higher resistance levels in subsequent sessions.
No major events are expected in the next 24 hours, allowing technical dynamics to guide price action.
Key Technical Levels
Support: 8,915 / 8,620 / 8,390
Resistance: 9,290 / 9,485 / 9,770
Disclosure: I am part of Trade Nation's Influencer program and receive a monthly fee for using their TradingView charts in my analysis.

FTSE Potential Buy Zone Expecting reaction here. 2 trades set, first trade 1:1 RR, second trade 1:4 RR.

FTSE Potential Sell ZoneExpecting reaction here. 2 orders set. First trade 1:1 RR, second trade 1:5 RR.

FTSE100 overbought pullback supported at 8880The FTSE remains in a bullish trend, with recent price action showing signs of a corrective pullback within the broader uptrend.
Support Zone: 8880 – a key level from previous consolidation. Price is currently testing or approaching this level.
A bullish rebound from 8880 would confirm ongoing upside momentum, with potential targets at:
8900 – initial resistance
9040 – psychological and structural level
9090 – extended resistance on the longer-term chart
Bearish Scenario:
A confirmed break and daily close below 8880 would weaken the bullish outlook and suggest deeper downside risk toward:
8840 – minor support
8820 – stronger support and potential demand zone
Outlook:
Bullish bias remains intact while the FTSE holds above 8880. A sustained break below this level could shift momentum to the downside in the short term.
This communication is for informational purposes only and should not be viewed as any form of recommendation as to a particular course of action or as investment advice. It is not intended as an offer or solicitation for the purchase or sale of any financial instrument or as an official confirmation of any transaction. Opinions, estimates and assumptions expressed herein are made as of the date of this communication and are subject to change without notice. This communication has been prepared based upon information, including market prices, data and other information, believed to be reliable; however, Trade Nation does not warrant its completeness or accuracy. All market prices and market data contained in or attached to this communication are indicative and subject to change without notice.

FTSE 100 Wave Analysis – 10 July 2025
- FTSE 100 broke key resistance level 8900.00
- Likely to rise to resistance level 9100.00
FTSE 100 index recently broke above the key resistance level 8900.00 (which has been reversing the price from March, as can be seen below).
The breakout of the resistance level 8900.00 continues the active short-term impulse wave 3 of the intermediate impulse wave (3) from the end of June.
Given the clear daily uptrend, FTSE 100 index can be expected to rise to the next resistance level 9100.00 (target for the completion of the active impulse wave 3).

FTSE breaking out?Following a lengthy consolidation, the FTSE appears to be poking its head above the resistance trend of a triangle formation and resistance circa 8830-35 area today, potentially paving the way for a run to a new all-time high.
This comes as markets have taken the latest tariff threats from Trump in their stride. Equity indices were quick to recoup most of their losses, with US futures trading higher and the DAX hitting a new weekly high today, reaching its highest levels since early June. I
Investors presumably expect more deals to be done before the extended August 1 deadline. After all, Trump himself has said that he’s open to negotiations and that the August 1 deadline for implementation of new levies was “not 100% firm”.
By Fawad Razaqzada, market analyst with FOREX.com

FTSE100 resistance breakoutThe FTSE remains in a bullish trend, with recent price action showing signs of a resistance breakout within the broader uptrend.
Support Zone: 8785 – a key level from previous consolidation. Price is currently testing or approaching this level.
A bullish rebound from 8785 would confirm ongoing upside momentum, with potential targets at:
8900 – initial resistance
8930 – psychological and structural level
8960 – extended resistance on the longer-term chart
Bearish Scenario:
A confirmed break and daily close below 8785 would weaken the bullish outlook and suggest deeper downside risk toward:
8760 – minor support
8730 – stronger support and potential demand zone
Outlook:
Bullish bias remains intact while the FTSE holds above 8785. A sustained break below this level could shift momentum to the downside in the short term.
This communication is for informational purposes only and should not be viewed as any form of recommendation as to a particular course of action or as investment advice. It is not intended as an offer or solicitation for the purchase or sale of any financial instrument or as an official confirmation of any transaction. Opinions, estimates and assumptions expressed herein are made as of the date of this communication and are subject to change without notice. This communication has been prepared based upon information, including market prices, data and other information, believed to be reliable; however, Trade Nation does not warrant its completeness or accuracy. All market prices and market data contained in or attached to this communication are indicative and subject to change without notice.

FSTE100 LongFSTE100 is now net long on the regression break.
There is a trade here with a stop at the swing low of the previous regression.
I am not sure if I will take this trade.

5-Swing Elliott Wave Sequence in FTSE Supports Bullish BiasThe ongoing rally in the FTSE Index, originating from the April 7, 2025 low, continues to unfold as a five-wave impulse structure within the Elliott Wave framework. This signals sustained bullish momentum. From the April 7 low, wave 1 peaked at 7984.19. Wave 2 pullback followed which concluded at 7599.56. The index then surged in wave 3, reaching 8902.4. The subsequent wave 4 correction manifested as a double three Elliott Wave structure, as evidenced on the 1-hour chart. From the wave 3 peak, wave (w) declined to 8809.91. It was then followed by a wave (x) recovery to 8858.56. The decline in wave (y) reached 8741.4, completing wave ((w)) in a higher degree. The rally in wave ((x)) peaked at 8831.9 before the index resumed lower in wave ((y)). Within this decline, wave (a) ended at 8757.97. Wave (b) ended at 8792.43, and wave (c) concluded at 8706.91, finalizing wave ((y)) of 4.
The FTSE has since turned higher in wave 5, requiring a break above the wave 3 high of 8902.4 to negate the possibility of a double correction. The structure from the wave 4 low is developing as a five-swing sequence, reinforcing the bullish outlook. From wave 4, wave (i) reached 8818.44, wave (ii) corrected to 8726.92, wave (iii) advanced to 8828.16, and wave (iv) pulled back to 8738.99. The final wave (v) concluded at 8837.75, completing wave ((i)) in a higher degree. A wave ((ii)) pullback is anticipated, likely correcting the cycle from the June 26, 2025 low in a 3, 7, or 11-swing pattern before resuming higher, provided the pivot at 8706.91 remains intact. This structure underscores a robust bullish bias, with the index poised for further upside as long as key support levels hold.
