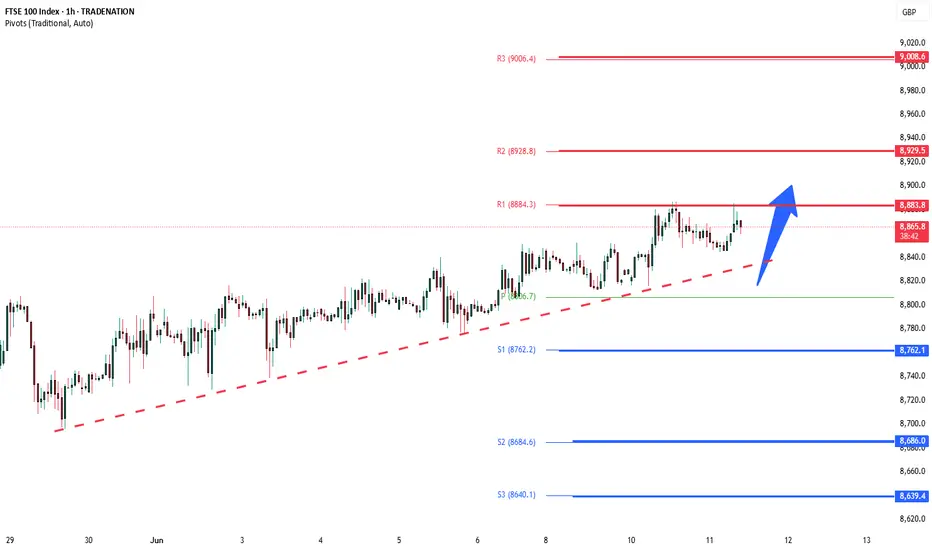
FTSE pivotal level at 8854The FTSE remains in a bullish trend, with recent price action showing signs of a corrective pullback within the broader uptrend.
Support Zone: 8695 – a key level from previous consolidation. Price is currently testing or approaching this level.
A bullish rebound from 8695 would confirm ongoing upside momentum, with potential targets at:
8854 – initial resistance
8900 – psychological and structural level
8960 – extended resistance on the longer-term chart
Bearish Scenario:
A confirmed break and daily close below 8695 would weaken the bullish outlook and suggest deeper downside risk toward:
8640 – minor support
8600 – stronger support and potential demand zone
Outlook:
Bullish bias remains intact while the FTSE holds above 8695. A sustained break below this level could shift momentum to the downside in the short term.
This communication is for informational purposes only and should not be viewed as any form of recommendation as to a particular course of action or as investment advice. It is not intended as an offer or solicitation for the purchase or sale of any financial instrument or as an official confirmation of any transaction. Opinions, estimates and assumptions expressed herein are made as of the date of this communication and are subject to change without notice. This communication has been prepared based upon information, including market prices, data and other information, believed to be reliable; however, Trade Nation does not warrant its completeness or accuracy. All market prices and market data contained in or attached to this communication are indicative and subject to change without notice.
UK100GBP trade ideas

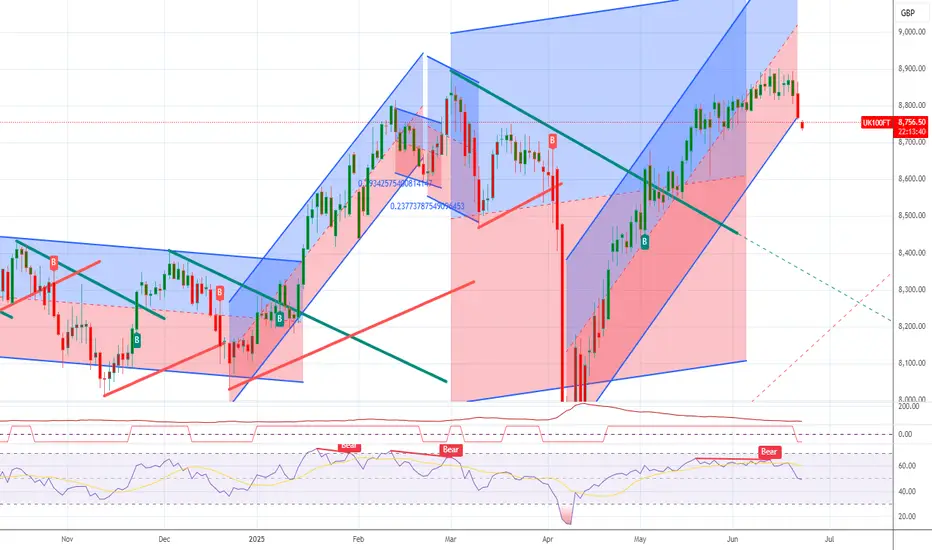
FSTE100 ShortUK100 is now net short on the regression break.
I am not taking this trade but keeping an eye on stock markets after the large run at has been achieved over the last 3 months.
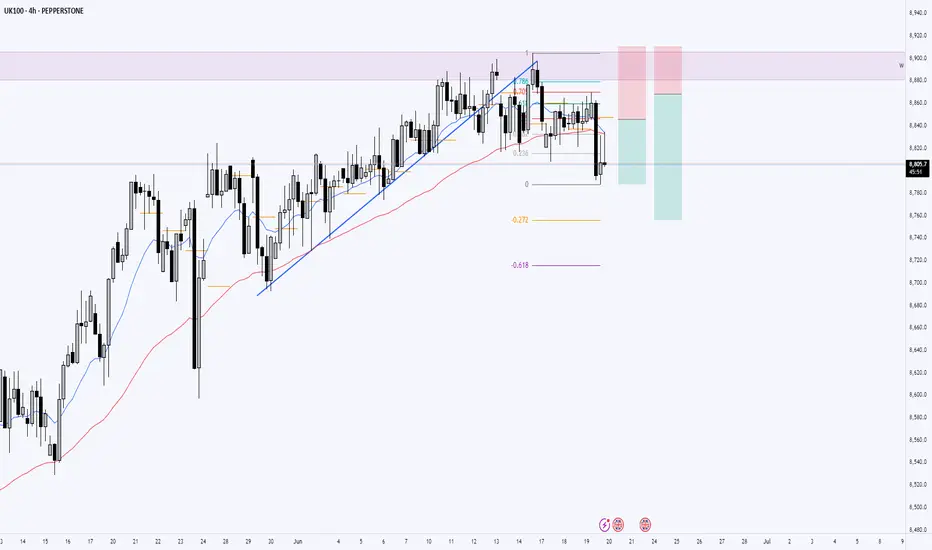
UK100 Bearish Setup Developing📉 Weekly Overview:
Price is currently held by a significant weekly resistance level. Last week formed bearish price action, indicating potential exhaustion from buyers and room for sellers to step in.
📉 Daily Chart:
Although no strong momentum candle yet, price has already broken internal bullish structure to the downside. EMA50 is starting to flatten, hinting at a potential momentum shift.
📉 4H Chart:
Clear sign of bearish transition – uptrend line is broken, price is now trading below the 50EMA, and we recently see strong seller momentum candles. This adds further confluence to bearish bias.
🔍 Plan:
Bias: Bearish
Entry: After bearish confirmation candle on 1H or 4H retracement to premium zone
Targets:
TP1: Previous 4H low
TP2: Daily support zone
Invalidation: Break and close above 4H 50EMA and recent structure high
FTSE INTRADAY bullish sideways consolidation Trend Overview:
The FTSE100 equity index remains in a bullish trend, characterised by higher highs and higher lows. The recent intraday price action is forming a continuation consolidation pattern, suggesting a potential pause before a renewed move higher.
Key Technical Levels:
Support: 8800 (primary pivot), followed by 8760 and 8700
Resistance: 8940 (initial), then 8977 and 9010
Technical Outlook:
A pullback to the 8800 level, which aligns with the previous consolidation zone, could act as a platform for renewed buying interest. A confirmed bounce from this support may trigger a continuation toward the next resistance levels at 8940, 8977, and ultimately 9010.
Conversely, a daily close below 8800 would suggest weakening bullish momentum. This scenario would shift the bias to bearish in the short term, potentially targeting 8760 and 8700 as downside levels.
Conclusion:
FTSE100 maintains a bullish structure while trading above the 8800 support. A bounce from this level would validate the consolidation as a continuation pattern, with upside potential toward the 8940 area. A breakdown below 8800, however, would invalidate this view and suggest deeper corrective risk.
This communication is for informational purposes only and should not be viewed as any form of recommendation as to a particular course of action or as investment advice. It is not intended as an offer or solicitation for the purchase or sale of any financial instrument or as an official confirmation of any transaction. Opinions, estimates and assumptions expressed herein are made as of the date of this communication and are subject to change without notice. This communication has been prepared based upon information, including market prices, data and other information, believed to be reliable; however, Trade Nation does not warrant its completeness or accuracy. All market prices and market data contained in or attached to this communication are indicative and subject to change without notice.

UK100 ShortManipulation in the Asian session, looking for price to retest higher supply then push down to the London and Asia low, this is a forecasted entry, entries will be based after 8am M5 candle opening.

FTSE 100 Wave Analysis – 19 June 2025
- FTSE 100 reversed from the resistance zone
- Likely to fall to support level 8700.00
FTSE 100 index recently reversed down from the resistance zone located between the strong resistance level 8900.00 (which stopped the weekly uptrend at the end of February) and the upper daily Bollinger Band.
The downward reversal from this resistance zone stopped the previous impulse wave i of the intermediate impulse wave 3 from May.
Given the strength of the resistance level 8900.00, FTSE 100 index can be expected to fall to the next support level at 8700.00 (the former low of wave 2 from last month).

UK100 [Consolidation Below Resistance] – Will Bulls Break Out?After a strong recovery from the April lows, UK100 has been trending upward, recently stalling just below the 8,912.17 resistance level. The price action is currently consolidating between the 8,809.57 support and the key resistance. The structure remains bullish overall, though the momentum has slightly weakened near the top.
Support at: 8,809.57 🔽 | 8,729.00 🔽 | 8,625.00 🔽
Resistance at: 8,912.17 🔼
🔎 Bias:
🔼 Bullish: A strong break and close above 8,912.17 could trigger a continuation toward fresh highs.
🔽 Bearish: A sustained drop below 8,809.57 and especially 8,729.00 may open downside moves toward 8,625.00 and 8,490.00.
📛 Disclaimer: This is not financial advice. Trade at your own risk.

FTSE sideways consolidation supported at 8800Trend Overview:
The FTSE100 equity index remains in a bullish trend, characterised by higher highs and higher lows. The recent intraday price action is forming a continuation consolidation pattern, suggesting a potential pause before a renewed move higher.
Key Technical Levels:
Support: 8800 (primary pivot), followed by 8760 and 8700
Resistance: 8940 (initial), then 8977 and 9010
Technical Outlook:
A pullback to the 8800 level, which aligns with the previous consolidation zone, could act as a platform for renewed buying interest. A confirmed bounce from this support may trigger a continuation toward the next resistance levels at 8940, 8977, and ultimately 9010.
Conversely, a daily close below 8800 would suggest weakening bullish momentum. This scenario would shift the bias to bearish in the short term, potentially targeting 8760 and 8700 as downside levels.
Conclusion:
FTSE100 maintains a bullish structure while trading above the 8800 support. A bounce from this level would validate the consolidation as a continuation pattern, with upside potential toward the 8940 area. A breakdown below 8800, however, would invalidate this view and suggest deeper corrective risk.
This communication is for informational purposes only and should not be viewed as any form of recommendation as to a particular course of action or as investment advice. It is not intended as an offer or solicitation for the purchase or sale of any financial instrument or as an official confirmation of any transaction. Opinions, estimates and assumptions expressed herein are made as of the date of this communication and are subject to change without notice. This communication has been prepared based upon information, including market prices, data and other information, believed to be reliable; however, Trade Nation does not warrant its completeness or accuracy. All market prices and market data contained in or attached to this communication are indicative and subject to change without notice.

UK100/FTSE100 - SHORT THE HELL OUT OF UK - Team, last week we kill few times SHORTING ON UK100/FTSE100
Here is a million strategy from Active Trader Room
SHORT NOW at the current price 8992-96
DOUBLE SHORT at 8912-36
Target 1 at 8870-62
Target 2 at 8855-47
Please note: once it hit first target ,take 50% profit
the rule is always pocket first and reduce the risk.
LET'S MAKE ANOTHER MILLIONS THIS WEEK

FTSE100 bullish sideways consolidation above 8800Trend Overview:
The FTSE100 equity index remains in a bullish trend, characterised by higher highs and higher lows. The recent intraday price action is forming a continuation consolidation pattern, suggesting a potential pause before a renewed move higher.
Key Technical Levels:
Support: 8800 (primary pivot), followed by 8760 and 8700
Resistance: 8940 (initial), then 8977 and 9010
Technical Outlook:
A pullback to the 8800 level, which aligns with the previous consolidation zone, could act as a platform for renewed buying interest. A confirmed bounce from this support may trigger a continuation toward the next resistance levels at 8940, 8977, and ultimately 9010.
Conversely, a daily close below 8800 would suggest weakening bullish momentum. This scenario would shift the bias to bearish in the short term, potentially targeting 8760 and 8700 as downside levels.
Conclusion:
FTSE100 maintains a bullish structure while trading above the 8800 support. A bounce from this level would validate the consolidation as a continuation pattern, with upside potential toward the 8940 area. A breakdown below 8800, however, would invalidate this view and suggest deeper corrective risk.
This communication is for informational purposes only and should not be viewed as any form of recommendation as to a particular course of action or as investment advice. It is not intended as an offer or solicitation for the purchase or sale of any financial instrument or as an official confirmation of any transaction. Opinions, estimates and assumptions expressed herein are made as of the date of this communication and are subject to change without notice. This communication has been prepared based upon information, including market prices, data and other information, believed to be reliable; however, Trade Nation does not warrant its completeness or accuracy. All market prices and market data contained in or attached to this communication are indicative and subject to change without notice.

FTSE INTRADAY sideways consolidation Overall trend remains bullish, supported by rising price action.
Recent Movement: Price is in a sideways consolidation phase after a strong uptrend.
Key Levels
Support:
8760 – Key level from prior consolidation.
8680, then 8640 – Next supports if 8680 breaks.
Resistance:
8830 – First upside target.
8930, then 9000 – Further resistance levels on continued strength.
Trading Scenarios
Bullish Scenario:
A pullback to 8760 followed by a bounce could lead to a move towards 8830, then higher to 8930 and 9000.
Bearish Scenario:
A confirmed break and daily close below 8760 would weaken the bullish case. In that case, expect a potential drop to 8680, then 8640.
Conclusion
The FTSE remains bullish, but a short-term pullback is possible. A bounce from 8760 would confirm trend strength. Watch 8680 closely — holding above favors bulls; a break below shifts sentiment to bearish.
This communication is for informational purposes only and should not be viewed as any form of recommendation as to a particular course of action or as investment advice. It is not intended as an offer or solicitation for the purchase or sale of any financial instrument or as an official confirmation of any transaction. Opinions, estimates and assumptions expressed herein are made as of the date of this communication and are subject to change without notice. This communication has been prepared based upon information, including market prices, data and other information, believed to be reliable; however, Trade Nation does not warrant its completeness or accuracy. All market prices and market data contained in or attached to this communication are indicative and subject to change without notice.

UK100 Long (Late-Update)I missed this break a couple of days ago on FSTE.
I have not taken this trade and will not take it now.

FTSE INTRADAY resistance retest Overall trend remains bullish, supported by rising price action.
Recent Movement: Price is in a sideways consolidation phase after a strong uptrend.
Key Levels
Support:
8760 – Key level from prior consolidation.
8680, then 8640 – Next supports if 8680 breaks.
Resistance:
8830 – First upside target.
8930, then 9000 – Further resistance levels on continued strength.
Trading Scenarios
Bullish Scenario:
A pullback to 8760 followed by a bounce could lead to a move towards 8830, then higher to 8930 and 9000.
Bearish Scenario:
A confirmed break and daily close below 8760 would weaken the bullish case. In that case, expect a potential drop to 8680, then 8640.
Conclusion
The FTSE remains bullish, but a short-term pullback is possible. A bounce from 8760 would confirm trend strength. Watch 8680 closely — holding above favors bulls; a break below shifts sentiment to bearish.
This communication is for informational purposes only and should not be viewed as any form of recommendation as to a particular course of action or as investment advice. It is not intended as an offer or solicitation for the purchase or sale of any financial instrument or as an official confirmation of any transaction. Opinions, estimates and assumptions expressed herein are made as of the date of this communication and are subject to change without notice. This communication has been prepared based upon information, including market prices, data and other information, believed to be reliable; however, Trade Nation does not warrant its completeness or accuracy. All market prices and market data contained in or attached to this communication are indicative and subject to change without notice.
FTSE 100 Surges Towards Record HighFTSE 100 Surges Towards Record High
Today saw the release of new data on the UK labour market.
According to official statistics, the number of payrolled employees in the UK fell by 55,000 (0.2%) between March and April 2025. Over the broader period from February to April 2025, the number declined by 78,000 (0.3%).
In response to the drop in employment, the UK’s FTSE 100 index (UK 100 on FXOpen) jumped sharply, rising close to the 8,900 mark — near its all-time high reached in early March this year.
Market participants likely interpreted the weakening labour market as an additional argument in favour of interest rate cuts by the Bank of England. Such a move would be seen as supportive of the economy and a bullish factor for equities.
Technical Analysis of the FTSE 100 (UK 100 on FXOpen)
From a technical perspective:
→ The FTSE 100 continues to trade within an ascending channel (shown in blue);
→ Today’s bullish momentum broke through the resistance line from below — a level that had previously capped the upward movement within the channel.
If the bulls can maintain the price above the 8,860 level, the likelihood increases for a continued uptrend and a potential new all-time high for the FTSE 100 index.
This article represents the opinion of the Companies operating under the FXOpen brand only. It is not to be construed as an offer, solicitation, or recommendation with respect to products and services provided by the Companies operating under the FXOpen brand, nor is it to be considered financial advice.

UK100/FTSE100 - ANOTHER SECRET STRATEGY OF 95% WINNING RATIOTeam, this morning we booked UK100/FTSE100 again from our short position
As mentioned, it should drop low at 8817
We are now re-short the UK100/FTSE100 again at 8838-45 ranges
We should focus on the target at 8818-8807
or possible 87-92-86
However, we ALSO add more short at 8856-65
These will be target at 8832-28
Let's kill the UK100/FTSE100 together.

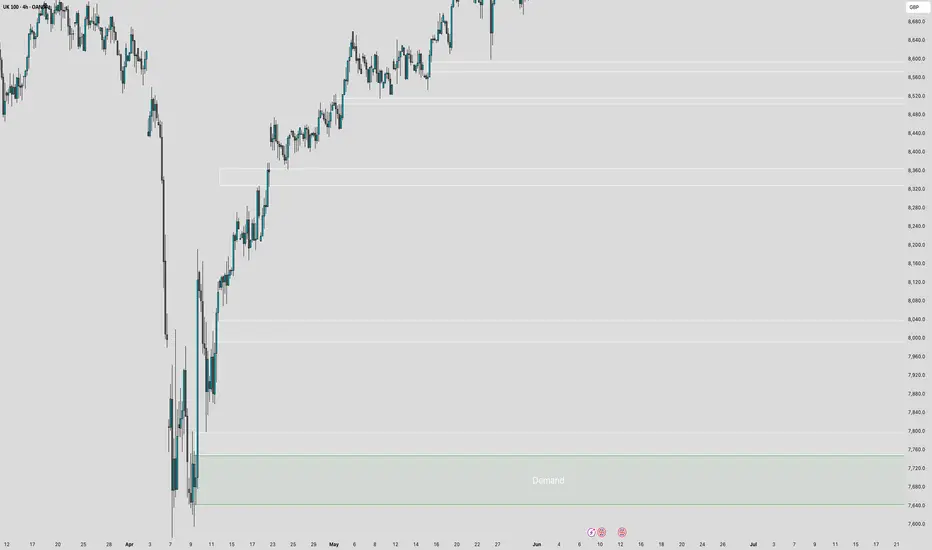
UK100G AnalysisLooking at the chart it's clear we are in a current uptrend, but we have quite a significant level just above our current position.
If we manage to break this level then I would expect a continuation to the upside and be looking for longs, If we fail to break this level then I expect that we will come back to collect some of these areas of imbalance marked on the chart. These are 1D and 4H levels that have not been mitigated fully and could provide liquidity for the next leg up.
We could still come back for some of this liquidity if we break that level but would give a much better indication of the price heading up, a failure to break could see us hit some of the recent lows again. Marked by the demand zone on the chart.
I'll be waiting to see what happens as it stands and using my usual ORB strat in my daily trades while I wait for a swing either way.
FTSE INTRADAY Bullish above support at 8760Overall trend remains bullish, supported by rising price action.
Recent Movement: Price is in a sideways consolidation phase after a strong uptrend.
Key Levels
Support:
8760 – Key level from prior consolidation.
8680, then 8640 – Next supports if 8680 breaks.
Resistance:
8830 – First upside target.
8930, then 9000 – Further resistance levels on continued strength.
Trading Scenarios
Bullish Scenario:
A pullback to 8760 followed by a bounce could lead to a move towards 8830, then higher to 8930 and 9000.
Bearish Scenario:
A confirmed break and daily close below 8760 would weaken the bullish case. In that case, expect a potential drop to 8680, then 8640.
Conclusion
The FTSE remains bullish, but a short-term pullback is possible. A bounce from 8760 would confirm trend strength. Watch 8680 closely — holding above favors bulls; a break below shifts sentiment to bearish.
This communication is for informational purposes only and should not be viewed as any form of recommendation as to a particular course of action or as investment advice. It is not intended as an offer or solicitation for the purchase or sale of any financial instrument or as an official confirmation of any transaction. Opinions, estimates and assumptions expressed herein are made as of the date of this communication and are subject to change without notice. This communication has been prepared based upon information, including market prices, data and other information, believed to be reliable; however, Trade Nation does not warrant its completeness or accuracy. All market prices and market data contained in or attached to this communication are indicative and subject to change without notice.

FTSE100 sideways consolidation capped at 8850Overall trend remains bullish, supported by rising price action.
Recent Movement: Price is in a sideways consolidation phase after a strong uptrend.
Key Levels
Support:
8680 – Key level from prior consolidation.
8625, then 8510 – Next supports if 8680 breaks.
Resistance:
8850 – First upside target.
8910, then 9020 – Further resistance levels on continued strength.
Trading Scenarios
Bullish Scenario:
A pullback to 8680 followed by a bounce could lead to a move towards 8850, then higher to 8910 and 9020.
Bearish Scenario:
A confirmed break and daily close below 8680 would weaken the bullish case. In that case, expect a potential drop to 8625, then 8510.
Conclusion
The FTSE remains bullish, but a short-term pullback is possible. A bounce from 8680 would confirm trend strength. Watch 8680 closely — holding above favors bulls; a break below shifts sentiment to bearish.
This communication is for informational purposes only and should not be viewed as any form of recommendation as to a particular course of action or as investment advice. It is not intended as an offer or solicitation for the purchase or sale of any financial instrument or as an official confirmation of any transaction. Opinions, estimates and assumptions expressed herein are made as of the date of this communication and are subject to change without notice. This communication has been prepared based upon information, including market prices, data and other information, believed to be reliable; however, Trade Nation does not warrant its completeness or accuracy. All market prices and market data contained in or attached to this communication are indicative and subject to change without notice.

UK100/FTSE100 - FOLLOW THIS STRUCTURE, SURELY YOU MAKE PROFITTeam, last night for the first time I make LIVE trading on video.
Everyday i did LIVE trading but not recording
last night we have SHORT EURUSD, LONG USDCHF, LONG US30 LONG NAS AND SHORT GOLD - 5/5 perfectly hit target
Today I want to show you the structure how we can deal with UK100/FTSE100
SHORT UK at 8817-26 - double up at 8846-62
lets set this LIMIT ORDER IN
Target 1 at 8792-96
Target 2 at 8776-8755
Lets kill the market tonight!

UK100/FTSE100 - TIME TO MAKE MILLION ON UK100/FTSE100Team,
Time to make millions on UK100/FTSE100
short slowly at 8811-14
Double the short at 8818-35
Target at 8797-93
EASY MONEY, no stress
If you see my videos. Every day we print money, yesterday we long USDCHF, SHORT EURUSD - We hardly trade those, but when we do, we kill them. Both also closed out today.
We also shorted the UK100 yesterday, and the target hit closed today.

FTSE INTRADAY sideways consolidation continuationrend: Overall trend remains bullish, supported by rising price action.
Recent Movement: Price is in a sideways consolidation phase after a strong uptrend.
Key Levels
Support:
8680 – Key level from prior consolidation.
8625, then 8510 – Next supports if 8680 breaks.
Resistance:
8850 – First upside target.
8910, then 9020 – Further resistance levels on continued strength.
Trading Scenarios
Bullish Scenario:
A pullback to 8680 followed by a bounce could lead to a move towards 8850, then higher to 8910 and 9020.
Bearish Scenario:
A confirmed break and daily close below 8680 would weaken the bullish case. In that case, expect a potential drop to 8625, then 8510.
Conclusion
The FTSE remains bullish, but a short-term pullback is possible. A bounce from 8680 would confirm trend strength. Watch 8680 closely — holding above favors bulls; a break below shifts sentiment to bearish.
This communication is for informational purposes only and should not be viewed as any form of recommendation as to a particular course of action or as investment advice. It is not intended as an offer or solicitation for the purchase or sale of any financial instrument or as an official confirmation of any transaction. Opinions, estimates and assumptions expressed herein are made as of the date of this communication and are subject to change without notice. This communication has been prepared based upon information, including market prices, data and other information, believed to be reliable; however, Trade Nation does not warrant its completeness or accuracy. All market prices and market data contained in or attached to this communication are indicative and subject to change without notice.

UK100/FTSE100 - time to short slowlyTeam, let's kill the UK100/FTSE100
last night, we got target hit both in 15 minutes during LIVE trading. Today we are going to short the UK slowly according to the strategy set out
Please note: Target 1 will be around 8778-8771
Once it hits, take 70% and bring a stop loss to BE
Target 2 - will unload the remaining 30% volume.
Please carefully look at the chart. There is a section where if the market goes against you, please double up at that section; that would allow us to make double the profit. However, when it pulls down to our original short, we can take those profits.

FTSE Coils Beneath Key ResistanceThe FTSE 100 finds itself at a crossroads. After an impressive V-shaped recovery from the April lows, the index has spent the past two weeks compressing beneath a well-established resistance zone. Tension is building and we’re left asking the critical question: will this be a great shorting opportunity or the start of a trend leg higher?
Is a Breakout or Fakeout Coming?
What makes this resistance area particularly significant is its origin. These are the same levels that capped the market back in February and March, just before a sharp sell-off triggered by sweeping tariff policies introduced by Donald Trump. That sell-off reset sentiment sharply, and now, with prices having clawed their way back, the FTSE is once again knocking on the door but hesitating.
On the daily chart, the price action has formed a tight sideways range. The 50-day and 200-day moving averages are both marginally rising, but they’re essentially flat, a signal that the market is in pause mode rather than trending. Volume, too, has returned to average levels, offering no strong clues from participation. This isn’t momentum building, it’s pressure tightening. The spring is coiling.
Zooming into the hourly chart reveals more detail… The FTSE is forming a wedge or price funnel, with swing highs gradually dropping while swing lows climb. This narrowing formation reflects indecision on both sides and underlines just how tightly wound this market has become.
Breakouts from these types of patterns can be significant, but they can also be deceptive. With a major resistance zone in play, traders should be on guard for false moves that lure in breakout chasers only to reverse and trap them. Patience is key. The real tell will be in the confirmation: a decisive daily close beyond the range, accompanied by a surge in volume, could mark the moment when tension finally gives way to trend.
Until then, the FTSE remains in limbo coiling, waiting, and keeping traders on edge.
UK100 Daily Candle Chart
Past performance is not a reliable indicator of future results
UK100 Hourly Candle Chart
Past performance is not a reliable indicator of future results
Disclaimer: This is for information and learning purposes only. The information provided does not constitute investment advice nor take into account the individual financial circumstances or objectives of any investor. Any information that may be provided relating to past performance is not a reliable indicator of future results or performance. Social media channels are not relevant for UK residents.
Spread bets and CFDs are complex instruments and come with a high risk of losing money rapidly due to leverage. 85.24% of retail investor accounts lose money when trading spread bets and CFDs with this provider. You should consider whether you understand how spread bets and CFDs work and whether you can afford to take the high risk of losing your money.
