Long GiltsAll bonds have been accumulating for 2-3 years. I think the GILTS will outperform other developed country bonds and is a good investment for the coming year.
UK10YBGBP trade ideas

Bond prices under pressureThe price on the US 10-year Treasury note fell to almost 96.0 on Friday, after payrolls report came stronger than expected, reinforcing the view that Fed would need to slow down rate cuts.
The price on the UK 10-year gilt fell to 89.6, the lowest since August 2008, and broke down the support at 91.0.The pressure in the UK bond market has been further amplified by mounting investor concerns over the nation’s debt levels and the government's ability to restore public finances while implementing its budget plans.
This rise reflects a broader increase in bond yields fuelled by concerns over Trump’s policies and a hawkish outlook from the Fed.

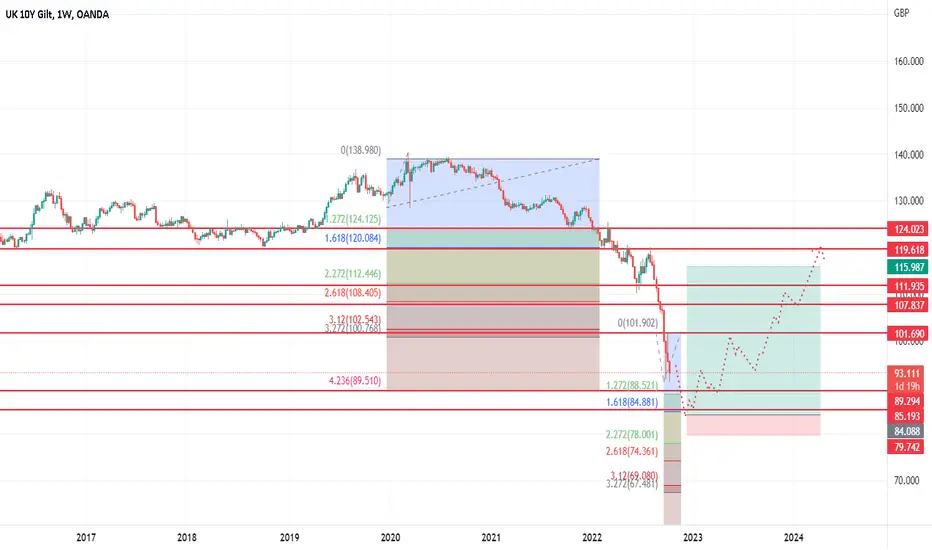
UK Bond Steps and ForcesThis is my perspective on the forces that might apply on the UK 10Y Gilt. It can climb along the red rectangles to fall down to the big green or if the first red rejects it or the bottom arc attracts it, we might see support in that area. The vertical green is a special one where unusual or special circumstances and price action might occur, either higher volatility or sudden shift in sentiment.
Treat everything as potential support and resistance but also stepping stones in case the market follows the main scenario highlighted with the purple path arrow. The second one with checkmarks is secondary and depends on the activity at the first vertical long red in case we reach it.
Arcs are special forces of attraction and or repulsion. They can be broken depending on the momentum or type of activity. If the price slows down near them it can just slide through them, but if candlestick patterns of potential reversals and inflections are formed, I will take a good look at them when deciding how and if to approach the market or adjust/manage previously opened positions.

UK Bond Next StepsThe rectangles are potential zones of support/resistance. They also indicate potential tendencies of the sentiment of the market through the pairs of similar color and their relative position (going up or going down). Icons are relative price predictions in time, similar to targets that can be hit. Around the marked time stamps potential pivot points or exceptional events can occur.
This is a project similar to previous ones (Matrix Style) and is also looking at candlestick patterns near the shapes, rebounds or bounces with candlestick shadows, or small coincidences in the price action relative to the elements in the snapshot. This is for the swing trading enthusiasts that seek to maximize gain and minimize risk. For better understanding the general context and approach, the linked idea with previous results can be analyzed.
Always trade with a plan, manage risk, asses all probabilities, and may the force of profits be with you!

Uk gilts trend UPUK gilts after quite bad market from recent years has showed some change... it means inflation in uk is already in control.. and no more rate hikes on way. For moment Uk gilts is a Buy!

Gilt Limited Edition MatrixIn this simulated project: pivot points, rebounds, or bounces are expected where the price meets the shapes. The icons are potential price predictions or time stamps for potential exceptional events. Blue curved path can become support or resistance. If the price goes down where there are no drawings, a potential entry signal might appear before that at any of the elements in the drawing. Rectangles are potential turnaround points.

Bearish GiltBearish Biased on this one unfortunately. Don't know what the future holds but I drew some shapes to help us navigate this mess.


Uk bonds trend upUk bonds has showed a good trend up.. from a long term trend down.... time to improve... up

UK gilts being soldUk gilts has been sold for the last couple of days... for moment we got news BCE will offer more gitls into markets in january,,,, for moment... critical levels for gilts.. moment sell

British bonds on way upBritish bond are getting some relief from bad times .. but not much better.,.. for moment itsz up

Estimate of the GILT low - Based on fib crash norms. Through this whole project of explaining my observations and theories on crash norms we've mainly looked at the more pessimistic point because we've been looking at topping and braking signals, but I did also do a lot of work on bottoming signals as well. As often as I am called a perma-bear, I put a lot of effort into finding rules to optimise "Buying the dip".
The strongest signals I found for lows were lows will tend to be a slight overshoot of the 423 extension from a small topping swing. Especially if you can clearly see the price action triggering the 161 break and capitulation signal (And it could not be more obvious than it is here).
We can usually estimate how far the spike out will go once we have our failed reversals (Which we have in wicky candles at the lows now) - we can fib these and use the 161 extensions.
Support comes around the 161 extension and then once the 423 is reclaimed it will hold a retest and an uptrend begin.
This is how a low is usually made and what I'd expect to see if this is going to turn.
It's very rare a move extends all the way to the 423 and does have not have a sizable bounce or full correction. Every time this happens a fib fairy dies - and often hyper capitulation can come. So 85 level or so could be critical for the GILTs.
Out of The Frying Pan, Into The FireIn terms of the global macroeconomic picture, the past two weeks have been nothing short of a firestorm. Last week, the UK government announced plans for unfunded tax cuts and additional government borrowing in the ‘mini budget’. This caused a drastic reduction in market confidence. Consequently the Pound crashed to under $1.04, historically low levels against the U.S. dollar. The volatility currently playing out in financial markets is unprecedented and akin to what we are accustomed to in the world of cryptocurrency.
In order to try and stop the sell-off of the pound, yesterday the Bank of England reversed course and announced that it will engage in market operations. This will involve purchasing long-dated UK government bonds (known as gilts) in an attempt to halt the fire sale which was jeopardising major financial players such as Pension Funds.
With these market operations, it is now likely that UK inflation levels will rip even higher than the eye-watering levels they are already currently at. The question now becomes, what will be the next central bank to blink and how will this continuous market chaos impact Crypto and other markets?
Over the past few days, crypto and wider markets have been holding up relatively well given the state of the wider economic picture. However, with a recession looming the possibility of another leg down looks increasingly likely. In recent weeks we have seen a direct correlation between inflation levels and the price of certain cryptocurrencies. When U.S. inflation data came in on the 13th of September at 8.3%, 0.2% higher than expected, the price of Bitcoin nuked 5% in a matter of minutes.
Some market forecasters assume that the Federal Reserve will eventually have to pivot and loosen up its policy, inviting in higher inflation but preserving the global financial system. However, little in the Fed’s communication so far implies that this is either likely or going to happen soon. Ultimately, either decision will have stark consequences for all financial markets, including cryptocurrency. As it stands, a market reprieve and return to an ‘up-only’ bull market seems unlikely in the foreseeable future.

U.K. 10 Year Gilt UK10Y-GB
We are overall at key area but just like EUR I see no fundamental reasons short/medium term on why and who would realistically going into Gilt at this moment of time. Inflation running hot, could estimated by this yr at 13-15%, recession, housing crises and last of all political instability.

A Simple High Probability Swing Trade Set Up for UK Gilt FuturesSince the January of 2021, UK Gilt futures has been trending down sharply. One of the main reason why I always enjoy trading bond market is that its trend is very clear and also persistant. The price often follows a textbook style of breakouts and retracements, occurring at clear support and resistance levels. Recently, the price has made a new low and aims to test the next support area of 115~116. This indicates that the down trend is still very valid and we are only looking to enter sell positions. The price is currently at the impulse stage, which means that there is no immediate action for us to take now. We are looking to sell the pull backs from the previous support level of 120 area. We expect the price to retrace back with a bearish flag pattern. Once the sell limit orders are hit, our first target is the next support level of 115, and our second target is the 112 area. This is a good passive trading set up where you can combine with your intraday trading to diversify your portfolio.
We will update this post after the price comes near the entry zone.


NOT GILTYLooks bull and bottomy af
Retail is NOT buying bonds
I wonder if smart money is...
GRI 2022

DeflationWhat if it IS transitory
Look at inflation hedges
Not doing great
This looks like a buy
TARD AT YOUR OWN RISK

GILTS DOWN BEFORE UPLooks like it wants about 123
HOOOOOODDDDDDDDLLLLLLLLL
Lol
NOT TRADING ADVICE
GRI 2022

NOT GILTYBear and bull cycles
Through the magic of geometry
Looks like bull is winning
But we'll know in a few months
GRI 2022
NOT TRADING ADVICE

GILTS MACROGilts are uk 10 year goverment bonds
They are short term bearish
And mid to longterm bullish imho
Let's see what happens
TRADE AT YOUR OWN RISK
G.R.I. Dec. '21

UK10YBGBPGoing lower then higher
Action reaction chart
Forks off major pivots
One macro fork one daily fork
G.R.I. Dec '21
NOT TRADING ADVICE

GILTS, unified global charting - time and geometry Gilts are uk 10 year gov bonds
They usually move inverse to GBPUSD which i may chart next
This is a difficult chart cycles wise
In terms of forks the longerterm uptrend is clear and i think we get a macro upmove as shown
NO ADVICE GIVEN
