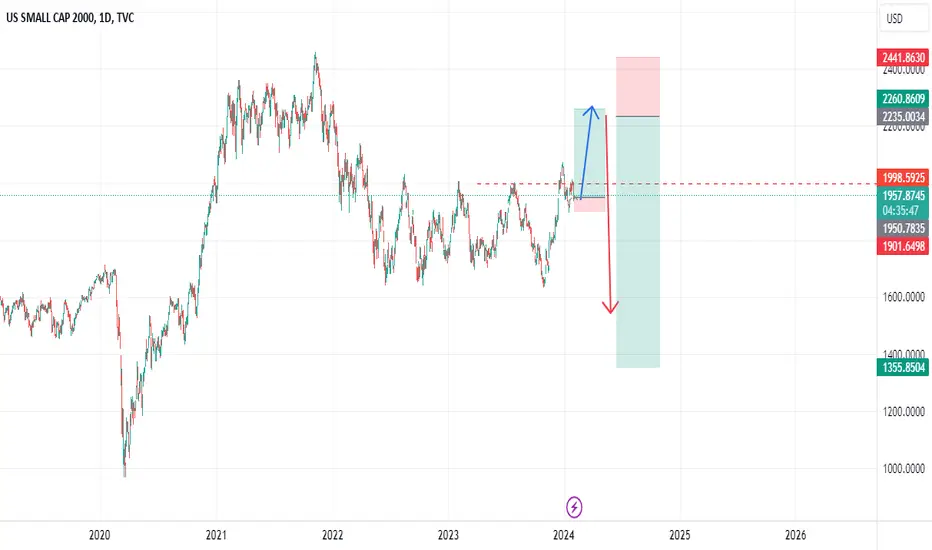
Russel 2000 - 30% up we go RTY is éate compared to the other U.S indexes... it's a stretch but in order to catch up we have Target1 just below ATH
Target 2 Stop Hunt aboce
Target 3 magic extension .... same as Dax chart in History i.e: +30%
US2000USD trade ideas

Russell 2000 approaching possible strong selling pressure?Hi guys,
Russell 2000 has consolidated on the previous range resistance that has now acted as support and is now heading for a crack at its all time high.
Currently Russell is just below a daily order block highlighted by the red box which was tested once on the way down in bear market. The zone also is the golden fib zone between 0.5 and 0.618, so very likely to have some sell opportunities.
It looks likely that this index is going to be very volatile and face huge amounts of resistance on the way up if it is to make an all time high. Patience will be key to make quality trades with this index but opportunities will be there.
The red zone may present more than one sell opportunity with buy back at previous support or resistance , which allows for plenty of swing trade opportunities.
Safe Trading all

Here we go, the bear market (winter is coming)Expecting a long cold bear market to the end of 2025! Starting last week
Hopefully the economy will not crash during this time.
On March 7th, 2024: "In both hearings, Powell noted that the central bank’s policy-setting committee still isn’t convinced that continued progress toward their 2% inflation objective is “assured,” and that it won’t make sense to cut interest rates until it is confident."

$QQQE & $RUT show breadth is not as bad as they're saying$QQQW is the equal weight NASDAQ:NDX and it is at an all time high, forming a cup. The question is, "Will it form the handle & breakout"?
TVC:RUT is in an uptrend but facing trouble at resistance.
This shows that breadth is not as bad as they paint it to be. However, it could be a lot better.
AMEX:IWM

RTY - Russel 2000: Bearish Harmonic PatternRTY - Russel 2000: Bearish Harmonic Pattern
RTY index completed a bearish harmonic pattern.
The first price reaction was aggressive and good for this type of pattern.
We may see any correction again up to 2060 - 2070 before the price moves down further.
Next week, on Wednesday, March 20, the market will await the FOMC meeting and if they will make any change to the Monetary Policy statement related to a rate cut.
You may find more details in the chart!
Thank you and Good Luck!
❤️PS: Please support with a like or comment if you find this analysis useful for your trading day❤️

NUMBER GO UPEconomic Recovery: If there are signs of a robust economic recovery, such as increasing consumer spending, declining unemployment rates, and strong GDP growth, small-cap stocks, which are heavily represented in the Russell 2000 index, may outperform. Positive economic indicators could fuel investor optimism and lead to a breakout in the index.
Interest Rates: Low interest rates typically benefit small-cap companies, as they can access cheaper financing and loans. If central banks maintain accommodative monetary policies or signal a commitment to keeping interest rates low for an extended period, it could provide support for small-cap stocks and contribute to a breakout in the Russell 2000.
Favorable Regulatory Environment: Policies and regulations that support small businesses, such as tax incentives, deregulation, or infrastructure spending, could boost the prospects of companies in the Russell 2000 index. Positive regulatory changes may lead investors to anticipate higher earnings growth for small-cap stocks, prompting a breakout.
Technological Innovation: Small-cap companies often specialize in innovative technologies and niche markets. Breakthrough innovations or disruptive technologies within sectors represented in the Russell 2000 could drive investor interest and contribute to a breakout as investors seek exposure to growth opportunities.
Market Sentiment: Investor sentiment plays a significant role in market movements. If market participants become increasingly optimistic about the prospects of small-cap stocks, driven by positive earnings surprises, improving business conditions, or bullish market trends, it could lead to increased buying activity and a breakout in the Russell 2000 index.
Sector Rotation: Shifts in investor preferences and sector rotation can impact the performance of the Russell 2000 index. If there is a rotation from large-cap stocks to small-cap stocks due to changing market dynamics or sector-specific trends, it could drive up prices in the Russell 2000 and result in a breakout.
Global Events: Geopolitical events, global economic conditions, and market developments can influence investor behavior and market sentiment. Positive developments such as trade agreements, geopolitical stability, or strong global economic growth could create a favorable environment for small-cap stocks and contribute to a breakout in the Russell 2000 index.

Major Indices: Macro SR Fibonacci SchematicsHere we have every major American indices in the world including the S&P-500, Dow Jones, Nasdaq, and the Russell 2000. This list excludes major foreign indices. For this idea, we have 2 boxes per indices. This is so we have room to include all schematics in the blueprint (chart). Let us define each indices and then we can talk about what makes each individual box up.
1. S&P-500 = (Standard and Poor's 500) Largest publicly traded companies in the US. (Benchmark for the overall US stock market and economy)
2. DJIA = (The Dow Jones Industrial Average) Tracks 30 large, publicly owned blue chip companies. Indicator of the health of the US economy, especially in the Industrial sector.
3. NASDAQ Composite = Heavily weighted towards the tech sector. Includes 3,000 stocks/all stocks listed on the Nasdaq stock exchange.
4. RUSSELL 2000 = Measures performance of 2,000 smaller-cap American companies. There's a distinct difference from the small cap measurement of the Russell and big caps like the S&P.
Now, each set of boxes are entirely different. There are no schematics in more than one box AT ALL. EVERY SINGLE BOX is 100% unique. Now that we know this lets examine...
1. Both S&P boxes include the following. 2 sets of schematics, a set of fib circle pairs, and a set of Fib Forks for EACH BOX.
2. Both DOW JONES chart have a schematic each. The 1st box has a set of fib circles but not the 2nd. The 2nd has a set of Fib Forks and so does the 1st.
3. Both NASDAQ boxes have a schematic each. Also, each has a set of Fib Spikes AND Fib Forks.
4. Both RUSSELL boxes have a schematic each. Each has sets of Fib Forks with the important ones highlighted in either black, yellow, or white to show the variety and how each different set reacts differently.
One must see that the different thickness and colors of separate sets of schematics are to distinguish them from its surroundings. My own forged Market Theory is that there is a BASE SET of Fib Extensions in the background which makes up our structure. Then, in the foreground, we have our Fib Spikes and then we lay over our Fib Forks. Finally, we have a totally finished, CLUSTERED, Schematic. SO, every single schematic that I make is all just individual schematics clustered together.

Russell 2000 Spicy!: US Releases Today!After the economic turmoil generated in the markets by the Fed's statements this week, US indices have reacted with a slight correction. This afternoon, data on industrial production, retail sales and sovereign debt auctions will be crucial (short term, 15 and 30 years ahead), as well as the US government unemployment figures, which will impact the markets, including currencies.
In particular, if we look at the performance of the Russell 2000, although it follows a similar trend to other long-term indices , its movement is more pronounced in the short term than the other three US indices. In today's premarket, it shows a decline of 0.05%, similar to the Dow Jones. This is due to the fact that U.S. mid-sized companies have a more productive rather than technological composition, a characteristic that generates greater volatility versus the large corporations of the major indexes. For example, the Russell 2000 was hit harder in 2020 than its counterparts.
The top 10 companies in the Russell 2000 are:
• Shockwave Medical: Healthcare
• Emcor Group Inc: Industrials
• Iridium Communications: Telecommunications
• Saia Inc: Industrials
• Apellis Pharmaceuticals: Healthcare
• Inspire Medical Systems: Healthcare
• Crocs Inc: Consumer Discretionary
• Texas Roadhouse Inc: Consumer Discretionary
• Kinsale Capital Group: Financials
• Prometheus Biosciences: Health Care
The average of all Russell 2000 companies is $2.951 billion in May 2023, with the top company valued at $10.383 billion and small companies in the $200 million range. The index weights average as follows:
Industrials: 17.50%, Health Care: 16.81%, Financials: 14.86%, Consumer Discretionary: 13.90%, Technology: 10.64%, Energy: 6.74%, Real Estate: 6.42%, Basic Materials: 4.24%, Utilities: 3.77%, Consumer Staples: 3.45%, and finally Telecom: 1.66%.
From March 2023 to date, the index has shown a sideways movement set on the same downward and upward milestones as its counterparts, with a high of 2,457.00 points still far from being reached. At the moment, it is in a very strong resistance zone that was not overcome until October last year, being pierced on Monday without much strength and closing a price gap. The RSI is at 59.74%, indicating moderate strength from buyers. The checkpoint marks 1,764.71 points, with a more active trading zone around 1,800 points since 2022. We could expect a possible correction if the indices change trend to down and a push towards 2,351 points if the index maintains its strength.
Ion Jauregui - AT Analyst
The information provided does not constitute investment research. The material has not been prepared in accordance with the legal requirements designed to promote the independence of investment research and such should be considered a marketing communication.
All information has been prepared by ActivTrades ("AT"). The information does not contain a record of AT's prices, or an offer of or solicitation for a transaction in any financial instrument. No representation or warranty is given as to the accuracy or completeness of this information.
Any material provided does not have regard to the specific investment objective and financial situation of any person who may receive it. Past performance is not reliable indicator of future performance. AT provides an execution-only service. Consequently, any person acing on the information provided does so at their own risk.

What's Next for the Crypto Market?With all the hype around crypto ETF's and the Bitcoin Halving, the crypto market indicates there is a chance for a continued trend upwards that initiated last October. The economy however could go either way depending on the FED's decision to raise, hold or lower rates and the moralsuasion they will use to articulate their rationale. The major equity indexes in the US are trending up which has proven necessary for the crypto market to sustain it's momentum but they too are watching the FED closely. Some say the equity markets are over heated? Some say only a few stocks are and the majority are ripe for an upward move. Lot's of money still sitting on the sidelines and in the money markets that could help bolster equity rallies. What will cause that money to go risk on? Are the markets seeing what the FED is seeing?

Russell 2000 in the course of reducing the gap from the marketThe Russell 2000 index is in a positive direction and remains about 20% to reach all-time high while S&P 500 and NASDAQ have been in there high regions for some time.
The index looks good at the moment and the market expects cut in interest rates around June, but inflation is still weighing on the move.
As long as no special news is published from the FED, the gap between the small cap stocks and the rest of the market will narrow
don't forget... the only way to trade the stock market... look at my signature below
Otherwise it won't work...
TVC:RUT

RTY Futures small Short postionPrice will potentially go short before continuing long-term bullish move
Bearish shark pattern Russel 2000Hi Guys,
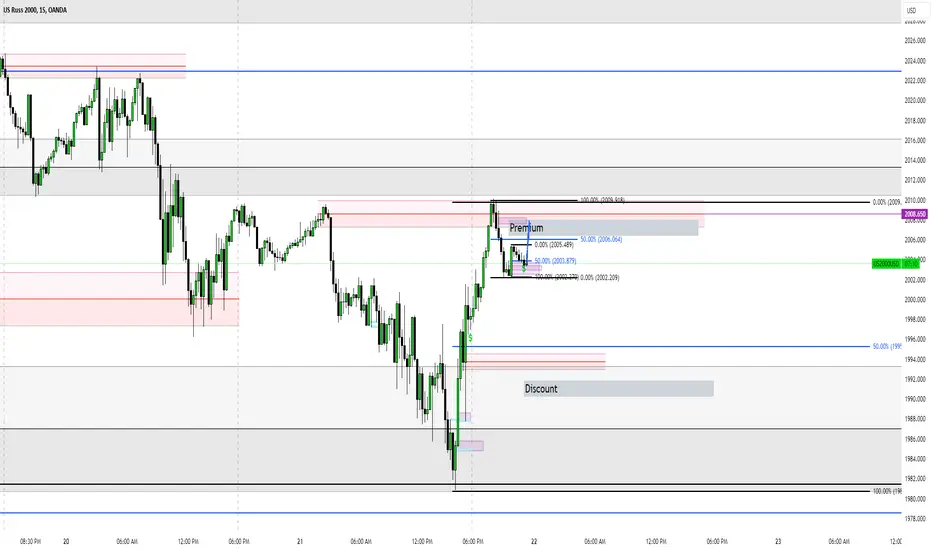
A potential bearish shark pattern is taking shape and almost at completion/ entry point. Entry level being 88.6 to 1.13 at point D .. I've taken the entry point on the chart as far as the shark pattern will still stay valid...i.e the BD line remaining between 1.618 and 2.24 ( I usually allow +- 0.10 on the fib ratios). Entry point aligns nicely with previous resistance.
Safe trading all

RTY SpeculativeLong 1930 - 1950
Stop losss 1911
Target 2020
Fundamental
-FWD PE 5Y trade at -1SD
-FWD 12M growth 29%
-Laggard play , expect rotation from large cap to mid/small cap
Risk factor
-No rotation with macro risk overwhelming
-Regional bank continue sell off and spark investor fear

Major chart breakout in RussellFollowing the premature breakout of a massive rectangle that lacked follow through in Russell in late December, the rally today appears to be the legitimate breakout. This could be a strong advance.

RUSSEL 2000 - Bullish Pennant - Value Area1. Zoomed out to provide perspective - Long term ranging market with a recent breakout. Now trading close to the previous resistance.
2. Market trading above the 50 and 200 EMAs - bias is to look for long opportunities in value areas.
3. As mentioned in point 1, market trading in a value area. If a long trade goes against us, we'll be able to understand quickly and a cheaply that our idea didn't work out. Conversely, if a long trade goes our way, there's a meaty reward ahead. In short, there's a risk / reward asymmetry presenting itself in this market.
4. Where is the trigger for a long trade?
a) Edge of a pennant pattern with a breakout leaded by an above average size bullish candle.
b) Preceded by another above average sized bullish candle
c) RSI depicts a shift of momentum to bullish.
5. Trade
a) Current daily candle
b) SL below the pennant pattern - $1887
c) TP - follow the trend and close position upon EMAs crossings or aim at the this market's all time highs range.
6. Risk management: No more than 1% of yr total equity at risk.
Cheers

Russel 2000 quick sell??Hi guys,
not much to go into here.
Simple sell at key resistance down to support. Clear stop and TP.

Russell 2000 in precarious positionHi Guys.
I am still bullish biased on the Russel. At the moment the index is being supported by the 50 ma and directly overhead has resistance by the 20 ma. The pullback to the current price is also a retest of the downward trendline it broke out of. Should the Russell make a bullish move from here and clear the most recent swing high that would look like a break of an inverse H&S but I see the more likely scenario of not being able to break the swing high until it moves slightly lower and makes a double bottom on the Daily which I am waiting to trade rather than the HS pattern which I dont like as a continuation pattern.
Also should price move south it may coincide with the completion of a bullish shark pattern with entry starting at the 88.6 level until the 1.13 level, wherever a proper entry reason arises for an individual's trading style/ methodoligies.
A more powerful move would follow a double bottom which has support in the area of the anchored VWAPs (Black and red lines on chart). the from both bear market high and lows which doesnt happen all that often and historically is powerful suport or resistance. You can see the bounce off the black AVWAP and 50 MA when the Russel pulled back from its massive run up from the lows.
We shall see what plays out ove the coming days / weeks.
Safe trading all.

Long Deep OTM Calls on RUT.I have a bunch of limit orders to buy everything lower and would far prefer to buy them lower but all the would be sell signals failed recently on SPX and Nasdaq.
RUT has lagged these heavily over the last while but I think we might be due to see one of the best moves we've seen in RUT for a while. I'd want to short into a spike but for now I am buying 2100 calls for mid/end of March.
I think there's a good chance of a strong rally in the coming weeks.
Potential Breakout in Small Caps The Russell 2000 small cap index has lagged the broader market so far in 2024, but now it may be showing signs of strength.
The first pattern on today’s chart is the lower low and higher high on Monday versus Friday. That kind of bullish outside candle may suggest that buyers are taking control.
Second, prices pushed above a falling trendline from the December 27 peak.
Third, RUT bounced in mid-January slightly above 1888. That was the peak before the Federal Reserve’s dovish meeting on December 13. It was also slightly above a 50 percent retracement of the rally that started on November 14 (when inflation hit 0 percent). Some traders may also view the recent pullback as a completed ABC correction.
Next, the 8-day exponential moving average (EMA) has crossed back above the 21-day EMA. MACD also flipped back to positive. Those points may reflect bullishness in the shorter term.
Turning to the longer run, the 50-day simple moving average (SMA) had a “golden cross” above the 200-day SMA earlier this month. The weekly chart below also shows how RUT has held potential support levels and may be challenging key resistance from August 2022.
TradeStation has, for decades, advanced the trading industry, providing access to stocks, options and futures. See our Overview for more.
Important Information
Past performance, whether actual or indicated by historical tests of strategies, is no guarantee of future performance or success. There is a possibility that you may sustain a loss equal to or greater than your entire investment regardless of which asset class you trade (equities, options, futures or cryptocurrencies); therefore, you should not invest or risk money that you cannot afford to lose. Online trading is not suitable for all investors. View the document titled Characteristics and Risks of Standardized Options at www.TradeStation.com . Before trading any asset class, customers must read the relevant risk disclosure statements on www.TradeStation.com . System access and trade placement and execution may be delayed or fail due to market volatility and volume, quote delays, system and software errors, Internet traffic, outages and other factors.
Securities and futures trading is offered to self-directed customers by TradeStation Securities, Inc., a broker-dealer registered with the Securities and Exchange Commission (“SEC”) and a futures commission merchant licensed with the Commodity Futures Trading Commission (“CFTC”). TradeStation Securities is a member of the Financial Industry Regulatory Authority, the National Futures Association (“NFA”), and a number of exchanges. TradeStation Crypto, Inc. offers to self-directed investors and traders cryptocurrency brokerage services under federal and state money services business/money-transmitter and similar registrations and licenses.
TradeStation Securities, Inc., TradeStation Crypto, Inc., and TradeStation Technologies, Inc. are each wholly owned subsidiaries of TradeStation Group, Inc., all operating, and providing products and services, under the TradeStation brand and trademark. TradeStation Crypto, Inc. offers to self-directed investors and traders cryptocurrency brokerage services. It is neither licensed with the SEC or the CFTC nor is it a member of NFA. When applying for, or purchasing, accounts, subscriptions, products and services, it is important that you know which company you will be dealing with. Visit www.TradeStation.com for further important information explaining what this means.

Russell showing whos in controlHi guys,
Just additional info on Russel 200 that some may find useful
I was pointing out the control buyers have at the moment on this index.
Further on that, it is the first time that Russell has pulled back from the range high that it has been at for over a year and made an impulsive move to the upside and not down. Also the clear support on the pullback from the anchored vwaps from both the bear market high and low converge to support price at the pullback as well as the 50ma and the gap below not filled.
As I mentioned before two levels of interest where some excellent selling opportunities may arise are the two order blocks ive highlighted that have confluence with fib levels.
Hope some of this info is useful .
Safe trading all.

Russel leaving no doubt Bulls are in total controlRegardless of macro environment or whatever else the price action on the Russel 2000 chart is a warning ... DONT short the indices YET... they still have some way to go.
Bullish pennant after bullish pennant in the move up from the bottom should leave no doubt in anyones mind.
A copy and paste of the flagpole of the large pennant puts the target just below its all time high.
Ive found through backtesting they are incredibly accurate for a gauging profit targets.
This is not to say that there wont be selling opportunities along the way.. in fact there is a daily order block just above its recent high where sellers will likely step in and further up an untested Weekly order block and they both align with fib ratios from the high to the low.

Russell ready to rocketThis is the most asymmetrical reward to risk trade I see right now of all the markets I follow. As I do the math, there is a potential reward of $10 for every $1 of risk. I dream of set ups like this. Of course, that does not mean it will be a winner. TVC:RUT $M2K_F

RUSSEL 2000 ready for an explosive move?RUT has created an interesting daily price chart:
1. it shows a pole/flag pattern with a potential to move another step upwards - but how much?
2. it shows an inverted Shoulder-Head-Shoulder pattern, which points to a potential move - eventually erractic ? - towards 2100 points.
3. the cyclical pattern let us expect a feelable trough only towards end of February.
Though, many see the RUT as weakest among the indexes, but expect the unexpected......
