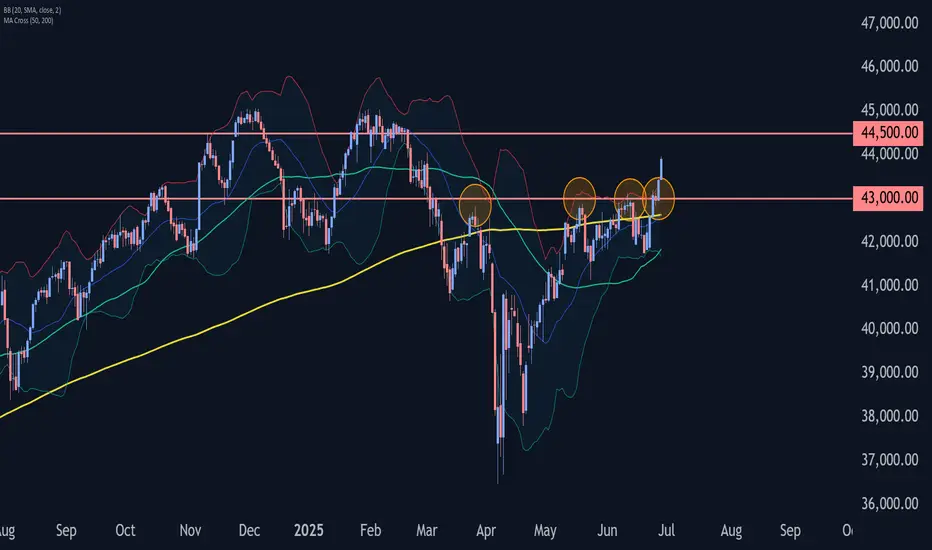
Dow Jones Wave Analysis – 27 June 2025
- Dow Jones broke pivotal resistance level 43000.00
- Likely to rise to resistance level 44500.00
Dow Jones index recently broke above the pivotal resistance level 43000.00 (which has been reversing the price from the end of March, as can be seen from the daily Dow Jones chart below).
The breakout of the resistance level 43000.00 accelerated the active impulse wave 3 of the intermediate impulse wave (C) from the end of May.
Dow Jones index can be expected to rise to the next resistance level 44500.00, which is the target price for the completion of the active impulse wave (C).
US30USD trade ideas
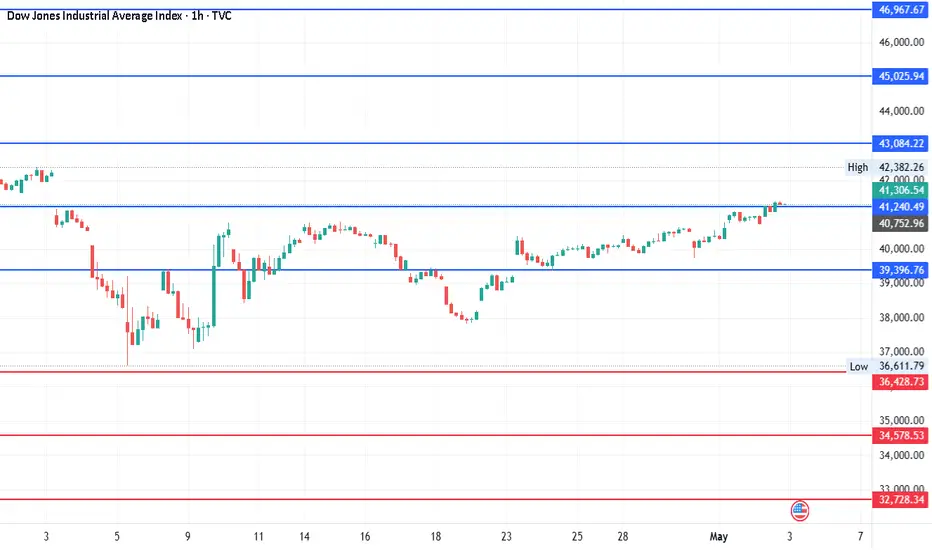
DJI - 2000 pts already moved out of 8000 pts since last posted?It has already moved around 2000 points since last posted on 22nd April. Expecting around 8000 points moved as per mentioned earlier and the levels are still the same. Introduced additional levels for the better understanding. So, another 6000 points move pending before any reasonable correction? let's see.
Upside: 41240.49, 43084.22, 45025.94 and 46967.67
Downside: 34578.53, 32728.34, 30786.61 and 28844.88
US30 (Dow Jones) Analysis – June 2025 Outlook📊 US30 (Dow Jones) Analysis – June 2025 Outlook
🔍 1. Fundamental Analysis
The US30 (Dow Jones Industrial Average) is currently navigating a complex environment shaped by macroeconomic shifts and geopolitical tensions. Below is an in-depth review of current factors influencing its price action:
🏦 Monetary Policy & Economic Indicators
Federal Reserve Stance:
After a series of rate hikes between 2022 and 2024, the Fed has adopted a more dovish tone in 2025.
Market consensus now expects the Fed to cut rates by Q3–Q4 2025 as inflation cools and growth moderates.
Inflation:
The May 2025 CPI came in lower than expected at 2.7% YoY, signaling disinflation.
Core CPI and PCE data also reflect a slowing pace of price increases, strengthening the case for easing.
Labor Market:
Non-farm payrolls have stabilized, but wage growth is slowing.
Unemployment remains low at 3.8%, but job creation is skewed toward lower-paying service sectors.
Growth Metrics:
ISM Manufacturing PMI remains below 50 (contraction), but Services PMI is resilient.
Consumer confidence dipped recently, reflecting uncertainty, yet consumer spending remains robust.
🌍 Geopolitical Climate
Iran–Israel Conflict Escalation (Mid 2025):
The recent Iran-Israel military clashes have rattled markets, briefly triggering risk-off flows.
The conflict has led to spikes in crude oil prices, pushing energy stocks higher but raising concerns about inflation re-acceleration.
US–China Relations:
Ongoing trade tensions over semiconductors and AI have led to sanctions on key Chinese tech firms.
Despite this, tech-heavy indices remain resilient due to domestic demand and AI sector optimism.
Global Monetary Policy Divergence:
While the Fed is dovish, the ECB has already started cutting rates, boosting global liquidity.
This divergence supports capital inflows into US equities, especially defensive and industrial sectors represented in the Dow.
📉 2. Technical Analysis (Smart Money Concepts)
The daily chart of US30, as annotated, reflects a clear transition from a bearish structure to a bullish regime, validated by Smart Money Concepts (SMC) methodology:
🔄 Market Structure Shift
Bearish Trend: Price was forming Lower Highs (LH) and Lower Lows (LL) into early 2025.
Change of Character (ChoCH): A significant bullish shift occurred with a closure above 42842, invalidating the prior LH and suggesting institutional buying.
Break of Structure (BOS): Followed by a clean higher high, reinforcing the bullish momentum.
🧱 Key SMC Levels & Zones
Buy Zone (Demand):
Between 41,600 and 41,800, this region aligns with:
A previous Higher Low (HL)
A visible Fair Value Gap (FVG)/Imbalance
Psychological support zone
Expected to be a strong institutional demand zone for a long setup.
IDM (Intermediate Demand Mitigation):
Minor liquidity grab possible before retest of buy zone.
An early sign of bullish intent may appear here.
Bearish Invalidation Level:
41,179 is the key structural level.
A daily closure below 41,179 would invalidate bullish bias and trigger a bearish BOS.
📈 Trend & Liquidity Outlook
Liquidity Pools:
Sell-side liquidity rests below recent HLs, particularly near IDM and the Buy Zone.
Buy-side liquidity above recent HH (~43,800) is the next target if price rebounds.
Trendline Support:
Ascending trendline from April continues to hold.
Acts as dynamic support intersecting the Buy Zone in late June.
Targets:
TP1: 43,000 (recent swing high)
TP2: 43,800–44,000 (liquidity magnet zone)
Final Supply Zone: 45,078 (historical resistance, visible on chart)
📌 Scenario Planning (SMC-Based)
Primary (Bullish) Scenario:
Price retraces into Buy Zone (41,600–41,800).
Forms bullish engulfing or displacement candle.
Entry long → Target 43,800+, SL below 41,179.
Alternate (Bearish) Scenario:
Price closes below 41,179 (breaks structure).
Bias flips to bearish.
Next support zone lies around 40,300–40,500.
NOTE: ONLY FOR EDUCATIONAL NOT A FINANCIAL ADVICE

US30 POTENTIAL SETUPUS30 Analysis
Fundamental Analysis:
The US30 (Dow Jones Industrial Average) continues to face turbulence as global and domestic factors interplay. Recently, several key macroeconomic and geopolitical developments have influenced sentiment:
FOMC Outlook: The Federal Reserve’s decision to pause interest rate hikes amidst easing inflation suggests a more dovish stance. However, labor market resilience and retail sales indicate lingering strength in consumer demand.
Geopolitical Risk – Iran-Israel Conflict: The renewed tensions in the Middle East—especially between Iran and Israel—have heightened risk sentiment. Oil prices are sensitive to the conflict, indirectly pressuring inflation and causing volatility in equity markets.
US Economic Indicators:
CPI (Consumer Price Index): Showed moderate deceleration, aligning with the Fed’s inflation target.
Unemployment Rate: Remains low, strengthening confidence in the soft-landing narrative.
Manufacturing and PMI Data: Indicate a slowdown, showing a mild contraction phase in industrial activity.
These mixed signals are feeding into a cautious yet opportunity-laden market environment for indices like US30.
Technical Analysis (SMC - Smart Money Concepts):
Current Market Structure:
The price recently broke structure (BOS) to the upside after a series of higher lows and equal highs.
It’s now in a pullback phase, showing a classic inducement pattern where early liquidity is grabbed below recent equal lows.
Key Zones:
Buy Zone: Marked between 41,460 to 41,357 (H1 FVG) , which lies just above the protected low at 41,150.
A sweep of equal lows followed by confirmation (e.g., BOS on lower timeframe like H4) would validate a long entry.
Risk Management:
Stop-loss: Below 41,150, signaling bearish intent if broken (CHOCH – Change of Character).
Take-profit Target: Upwards toward 42,911, aligning with previous highs and order block inefficiencies.
Bearish Scenario: A daily closure below 41,150 would invalidate the bullish setup and suggest a deeper retracement toward the next key support near 40,636.
NOTE: Not a financial advice only for educational purpose

#US30 Buy 43575.4#US30 Buy 43575.4
SL 43515.4
TP 43595.4
TP 43675.4
TP 43815.4
Trade at your own risk
Protect your capital
The Wizard 🧙♂️ SWFX

US30: Local Bearish Bias! Short!
My dear friends,
Today we will analyse GOLD together☺️
The price is near a wide key level
and the pair is approaching a significant decision level of 43,673.57 Therefore, a strong bearish reaction here could determine the next move down.We will watch for a confirmation candle, and then target the next key level of 43,576.88..Recommend Stop-loss is beyond the current level.
❤️Sending you lots of Love and Hugs❤️

DOW JONES Will Keep Growing! Buy!
Hello,Traders!
US30 is trading in an
Uptrend and the index broke
The key horizontal level
Around 43,200 and the
Breakout is confirmed so
We are bullish biased
And we will be expecting a
Further bullish move up
Buy!
Comment and subscribe to help us grow!
Check out other forecasts below too!
Disclosure: I am part of Trade Nation's Influencer program and receive a monthly fee for using their TradingView charts in my analysis.

US 30 Potential longUS30 – Wyckoff Spring Setup for NY Session | Intraday Execution Play
Price rallied in the London session with rising volume and structure breaks —
Now we’re anticipating a classic Wyckoff spring scenario just ahead of NY open.
📍 Key Expectations:
Sweep of intraday support around 43,482
Strong buyer reaction (spring confirmation)
Expansion into the 43,600+ zone — possible 1.5R+ continuation
⚠️ Volume buildup + stop placement below prior structure make this zone ripe for a fakeout → reversal.
I’m watching for a quick flush below the line → wick rejection → engulfing confirmation to trigger longs.
This is a trap trade — smart money baits shorts, I’m betting they get squeezed.
🔫 Entry: On confirmation after spring
📉 Invalidation: Below the spring low
🎯 Target: 43,610 zone and trailing after break of 43,570
Let them walk into the trap. Then pull the trigger.

Dow Jones Retesting 43,020 | Bullish Bias Intact Above 42,810US30 OVERVIEW
Dow Jones Holds Bullish Momentum | Eyes on Retest and Continuation
US30 (Dow Jones) remains under bullish pressure, supported by recent macro developments and improving sentiment.
The price appears to be forming a retest toward 43,020, which could act as a springboard for further upside.
As long as the index trades above 42,810, the bullish trend remains intact, targeting 43,350, and potentially 43,765.
However, a confirmed break below 42,810 would shift the outlook to bearish in the short term.
Resistance Levels: 43,350 → 43,765
Support Levels: 43,020 → 42,810
Previous idea:

PCEs & attacks on PowellWe are carefully monitoring the PCEs today, to see, "wins" this small battle in the rate-lowering war. Let's dig in.
Let us know what you think in the comments below.
Thank you.
77.3% of retail investor accounts lose money when trading CFDs with this provider. You should consider whether you understand how CFDs work and whether you can afford to take the high risk of losing your money. Past performance is not necessarily indicative of future results. The value of investments may fall as well as rise and the investor may not get back the amount initially invested. This content is not intended for nor applicable to residents of the UK. Cryptocurrency CFDs and spread bets are restricted in the UK for all retail clients.

Dow Jones (US30) — Bullish Momentum, But a Retest AheadUS30 — Preparing for a Retest Before Higher Push
Subtitle: Technical Outlook — 27 June 2025
📈 Current Market Condition
The US30 index has shown strong bullish momentum, breaking above prior resistance around 43,000 and extending towards 43,500. Price is currently above both the 50 EMA (blue) and 200 EMA (red), reflecting a bullish structure. However, the Stochastic indicator signals overbought conditions, suggesting the index may be due for a pullback or consolidation before attempting to break higher into the 44,500–44,750 resistance zone.
🔑 Key Technical Highlights
Structure: Price broke above consolidation zone 42,750–43,000, retesting higher levels.
50 EMA (blue): Positioned near 42,750, acting as dynamic support.
200 EMA (red): Below at 42,200, major trend support.
Stochastic: Overbought — risk of a short-term correction or sideways move before continuation.
Resistance: Major resistance at 44,500–44,750.
Support: Immediate support at 43,000–43,250, deeper at 42,500.
📝 Trade Plan
Bullish Breakout (Long)
Trigger: Retest and hold of 43,000–43,250 zone with bullish confirmation (e.g. bullish engulfing, hammer).
Target: 44,500 / 44,75
Stop-loss: Below 42,900
Bearish Rejection (Short)
Trigger: Strong rejection from 44,500 with bearish reversal pattern.
Target: 43,250 / 42,750
Stop-loss: Above 44,700
Dip Buy
Trigger: Price tests 42,750 (50 EMA) and shows bullish reversal.
Target: 43,500 / 44,500
Stop-loss: Below 42,500
⚠️ Risk Management Note
US30 is trading in extended conditions, so chasing price here carries risk of getting caught in a pullback. Use staggered entries and adjust position size relative to volatility. Watch out for upcoming macroeconomic releases that could trigger sharp moves.
If you found this analysis valuable, kindly consider boosting and following for more updates.
Disclaimer: This content is intended for educational purposes only and does not constitute financial advice.

DOW JONES INDEX (US30): Consolidation is Over
Dow Jones Index completed a bullish accumulation on a daily.
The price violated a key horizontal resistance cluster and closed above that.
Next goal for bulls is 43790.
❤️Please, support my work with like, thank you!❤️
I am part of Trade Nation's Influencer program and receive a monthly fee for using their TradingView charts in my analysis.

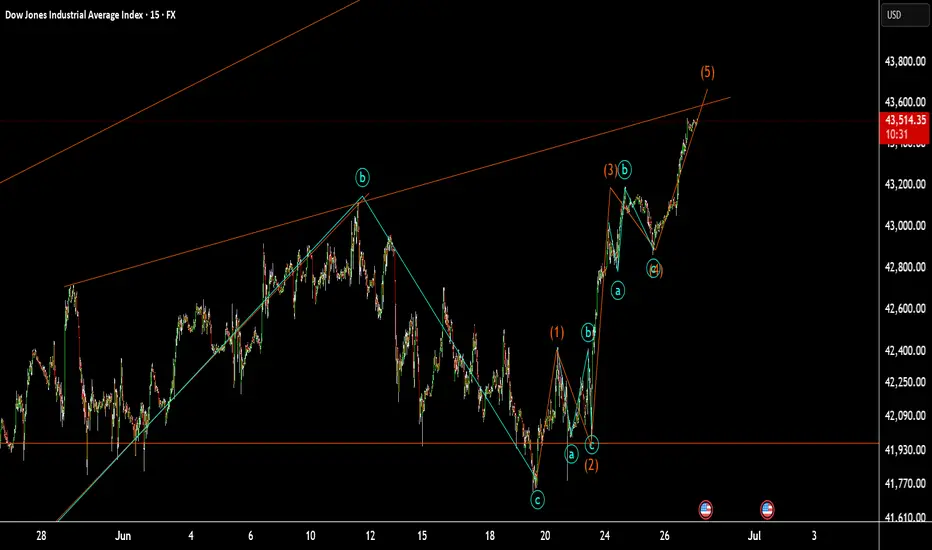
US30 at small resistanceUS30 at small resistance:
as I counter these wave we are in wave 5. it might be goes up to the maim trend Line in previous analysis.
US30 Testing Key Resistance ZonesUS30 has shown renewed bullish momentum with a strong breakout candle above the 42,800.00 resistance. After consolidating for several sessions, price surged upward, now hovering near the 43,800.00 zone—an important resistance level from prior highs.
Support at: 42,800.00 🔽 | 41,900.00 🔽
Resistance at: 43,800.00 🔼 | 44,362.79 🔼 | 45,011.92 🔼
🔎 Bias:
🔼 Bullish: A daily close above 43,800.00 opens the path to test 44,362.79 and potentially 45,011.92.
🔽 Bearish: Rejection from current level and a break below 42,800.00 may trigger a pullback toward 41,900.00.
📛 Disclaimer: This is not financial advice. Trade at your own risk.

US30 - ShortLooking for the Short on US30 final pull back before we see extension to the upside 45,000.

DOW JONES: Technical pullback possible but 43,700 target remainsDow Jones is bullish on its 1D technical outlook (RSI = 62.550, MACD = 276.720, ADX = 11.070), extending the bullish wave of the 1 month Channel Up. This is only the second such wave of this pattern and its first pulled back to the 0.5 Fiboancci retracement level after making a +3.75% rise. It is possible to see such a retrace start either now or tomorrow but on the medium term the bullish target on the 1.236 Fibonacci extension is intact (TP = 43,700).
## If you like our free content follow our profile to get more daily ideas. ##
## Comments and likes are greatly appreciated. ##

The Dow Jones index is at the channel’s ceiling.The Dow Jones index, upon reaching the channel’s ceiling, shows weakness and lacks the ability to break out from a price action and candlestick perspective. I expect the price to reach near the channel’s floor in a downward trend.
17:30
BLACKBULL:US30

DJI This is 2hrly chart of DJI
looking at the chart ,
I sense this structure of EW ...
and looks this whole move has been corrective wave...
going forward...
DJI is 43185
below 42950, I would be looking for 36.5k as my target with recent high as my sl ...
Just a View!!
Vedang:)
Discliamer: Chart is for study purpose only!!

DowJones bullish breakout supported at 42240Key Support and Resistance Levels
Resistance Level 1: 43200
Resistance Level 2: 43544
Resistance Level 3: 43900
Support Level 1: 42240
Support Level 2: 41740
Support Level 3: 41280
This communication is for informational purposes only and should not be viewed as any form of recommendation as to a particular course of action or as investment advice. It is not intended as an offer or solicitation for the purchase or sale of any financial instrument or as an official confirmation of any transaction. Opinions, estimates and assumptions expressed herein are made as of the date of this communication and are subject to change without notice. This communication has been prepared based upon information, including market prices, data and other information, believed to be reliable; however, Trade Nation does not warrant its completeness or accuracy. All market prices and market data contained in or attached to this communication are indicative and subject to change without notice.

US30 - Long 43,150Still looking for that 43,150 lets get a test of FVG then on bullish PA above we can plan trade. Stops would go below the order block.

Dow Jones Industrial Average Index - 4h Chart (FOREXCOM)4-hour chart of the Dow Jones Industrial Average Index (US30) shows the price movement from late June to early July 2025. The current value is 43,057.7, reflecting a slight increase of +78.0 (+0.18%). The chart highlights key price levels, including a resistance zone around 43,324.1 and a support zone near 42,875.8, with recent price action showing a breakout above the resistance level.


US30: Short setup brewingSitting in a rising wedge with bearish divergence after running into resistance at 43100, the US30 contract finds itself at an interesting juncture on the charts. If it can’t stage a definitive break above these levels, a short setup could be on the cards.
If the contract cannot break and hold above 43100, traders could look to initiate short positions targeting the 200-day moving average initially. If that were to give way, the target could be lengthened to 42000, where wedge support is currently found. A stop above 43100 would protect against reversal.
While MACD has staged a bullish crossover, the momentum signal is countered by what’s still bearish divergence between RSI (14) and price despite the latest bounce.
Given the proximity to month end—a period notorious for window dressing and false signals—the preference would be to wait for another retest and failure at 43100 before initiating the trade.
A de-escalation in trade tensions, lower crude prices and the prospect of a Fed rate cut as soon as July have been tailwinds for the contract over recent days. If it can’t continue to rally in this environment, it questions just what would be required to deliver further upside, just as negative tariff headlines potentially loom.
Good luck!
DS
