USB30YUSD - Close up view of the Potential highHere is the close up view mentioned in the previous bigger view. Looks like we are only days away from the sell at the 151.90 zone.
Then we can look for a quick retrace back down to the 142.50 zone to buy again
USB30YUSD trade ideas
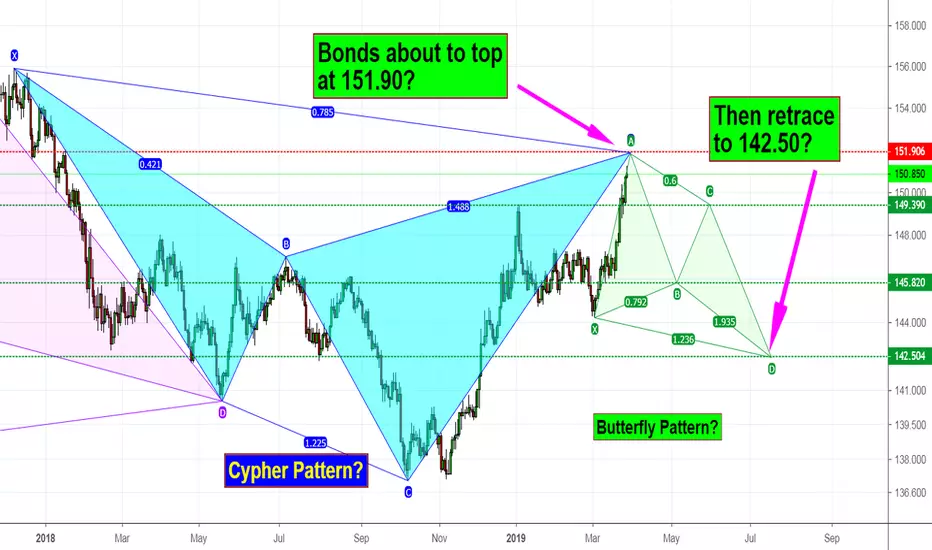
USB30YUSD - Bonds about to Top out soon?Interesting how nicely the Harmonic Patterns have been working for 30 year Bonds. The Huge Gartley (purple) was perfect.
Will we see the next Cypher Pattern (blue) work for us? It completes point D at 151.90 zone, and should provide us with a nice sell zone.
Then we need to look out for a possible Butterfly Pattern (green) for a fast correction back down to the 142.50 zone, providing a good buying opportunity again.
This is a large time frame chart. Please look for the next post with a detailed close up view.
Thanks
Old Fart

Correlations: US30/DE10/JP10 yr bonds with the S&P/DowThis was an experiment to find any relevant patterns or correlations between US Bonds/equities. Nasdaq was not included due to it's high %'s skewing the perspectives on the chart
Green vertical lines were "buy signals", and the red lines were sells. The result is that there definitely is some correlation here with the "oversold"/overbought" position on US 30yr bonds and US equities. What I'm seeing is more often than not it is an accurate indicator for a trend reversal, and also that it is not time for a buy "long term" yet. That signal comes (more often than not) when the 30 yr bond price is overbought on a weekly timeframe.
I'm expecting an equities bounce in the next few days, but I'll be setting my long term buy targets lower. S&P around 2200-2300 wouldn't surprise me before the end of 2019


USB30YUSD bond short on daily bearflagThis marked has printed a really nice bear flag on the Daily. The H4 chart shows that price has broken it and is now being tested from below. Also a light pullback on the weekly. I may look to enter on the break of the the last swing low as marked.


Nice set up to go short US T-Bond at 3 time framesDownturn momentum pick up in US T-Bond( USB30YUSD) just go short for short-term target at 144, stop loss at 146.66

Nice set up to go short US T-Bond at 3 time framesDown turn just pick up a gain in US T-Bond (USB30YUSD), thanks to mixed US job data is not good for CPI, go short now for short-term target at 140, stop loss at 144.7

Nice set up to go long US T-Bond at 3 time framesUS T-Bond (US30YUSD) may pull back for short-term target at 146, stop loss at 143.80


US 30 Year Bond is testing it's daily uptrend line and supportI posted this as neutral because it can go either way from here. I shorted the future 2 days ago but did not buy TMV in my 401k.
For those who are short, this is a take profit area if support holds. I will put a tight stop loss here. A long position can be taken here depending on the price action. If it breaks support and the uptrend line, short at an appropriate time. usb30yusd usually falls with dxy strength.

US-T BondI short it a little bit too early. I saw nice overbought conditions in the 15 min time frame. But essentially when the price its not in the upper band I am waiting for a higher high... (Secret rule ;) )

$ZB_F If M star confirms in US30Y bond, game changesIf not, weekly flag is waiting $DXY, $EURUSD #patience

30-YEAR T-Bonds - Down, But Not OutThe first support for the 30-Year is 152 (purple line) and the next is 146 (green line). A turn anywhere above 152 in the days to come will signal a bottom and a potential run to 162.

