OBOL/USDT Bullish continuationOBOL is creating higher highs and higher lows with clean structure. We have just created the last higher low at 0.1420 and I am expecting to see a new high created above structure.
My target is 0.1665
SL is 0.1345
Related pairs

OBOL/USDT – Bullish Breakout with Retest in PlayOBOL/USDT
Analysis Summary:
The chart shows a potential breakout from a horizontal consolidation range after a period of accumulation. A range breakout is highlighted, with a projected target based on the height of the range.
Key points:
Price is currently retesting the breakout zone, a common

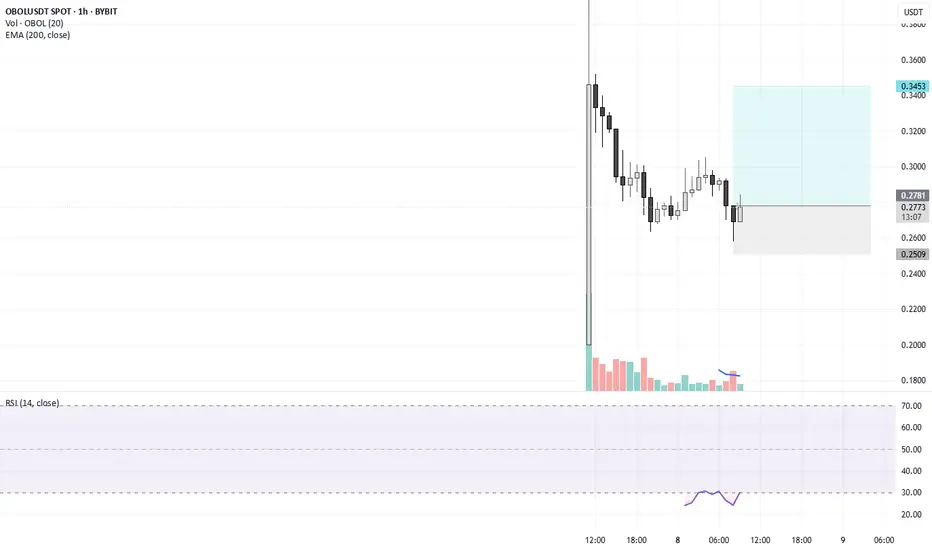
Post-Airdrop FOMO Fade Drives Selling PressureAnalysis: X posts suggest $OBOL’s recent price action is driven by a post-airdrop FOMO fade, with strong selling after the May 7, 2025, Token Generation Event (TGE). The price is below the 50-day EMA, and the Chaikin Money Flow (CMF) indicates capital outflows. A short targeting $0.215 is viable if

Fibonacci Retracement Points to Deeper CorrectionAnalysis: Applying Fibonacci retracement from the all-time high ($0.380077) to the all-time low ($0.284628), $OBOL is below the 0.236 Fib level ($0.305). The next support lies at the 0.382 Fib level ($0.25), aligning with major support noted in X posts. The lack of bullish volume and a bearish MACD
Volume Profile Shows Thin Support Below $0.29Analysis: The volume profile indicates low buying interest between $0.29 and $0.25, creating a “value gap” where the price could slide quickly. The price is below the Volume Weighted Average Price (VWAP), and the 20-day EMA is sloping downward, confirming bearish momentum. A break below $0.285 targe

Bearish Trendline Resistance Caps UpsideAnalysis: $OBOL is trading below a descending trendline formed since its all-time high of $0.380077 on May 7, 2025. Attempts to break above $0.30 have been rejected with low buying volume, signaling weak bullish conviction. The Stochastic Oscillator is in the overbought zone on the 1-hour chart, sug

OBOL USDTCP 0.2776
BUY: 0.026 TO 0.29
SELL 0.345 OR MORE
SL: 0.25
high volume
new project can b pump any time.
Oversold CRSI Signals Short-Term Bearish ContinuationAnalysis: Recent X posts note that the Composite RSI (CRSI) for $OBOL is in extremely oversold territory, typically a bearish signal post-FOMO airdrop. The price is below the 200-day SMA, and the MACD histogram is deepening, indicating sustained selling pressure. A drop to $0.235 is plausible if the

Short Opportunity on Retest of Broken SupportAnalysis: After breaking $0.29161, $OBOL may attempt a pullback to this level, now acting as resistance. The 4-hour chart shows high-volume bearish candles, and open interest suggests short positions are accumulating. A rejection at $0.295–$0.30 with volume >150M could confirm the short setup, targe

High-Volume Breakdown Signals Further DeclineAnalysis: The 29% price drop in 8 hours on Binance, coupled with surging trading volume, indicates strong bearish sentiment. The price is below the 50-day Simple Moving Average (SMA), and the RSI is declining without bullish divergence, suggesting no immediate reversal. Key support at $0.25 is the n

See all ideas
Summarizing what the indicators are suggesting.
Oscillators
Neutral
SellBuy
Strong sellStrong buy
Strong sellSellNeutralBuyStrong buy
Oscillators
Neutral
SellBuy
Strong sellStrong buy
Strong sellSellNeutralBuyStrong buy
Summary
Neutral
SellBuy
Strong sellStrong buy
Strong sellSellNeutralBuyStrong buy
Summary
Neutral
SellBuy
Strong sellStrong buy
Strong sellSellNeutralBuyStrong buy
Summary
Neutral
SellBuy
Strong sellStrong buy
Strong sellSellNeutralBuyStrong buy
Moving Averages
Neutral
SellBuy
Strong sellStrong buy
Strong sellSellNeutralBuyStrong buy
Moving Averages
Neutral
SellBuy
Strong sellStrong buy
Strong sellSellNeutralBuyStrong buy
Frequently Asked Questions
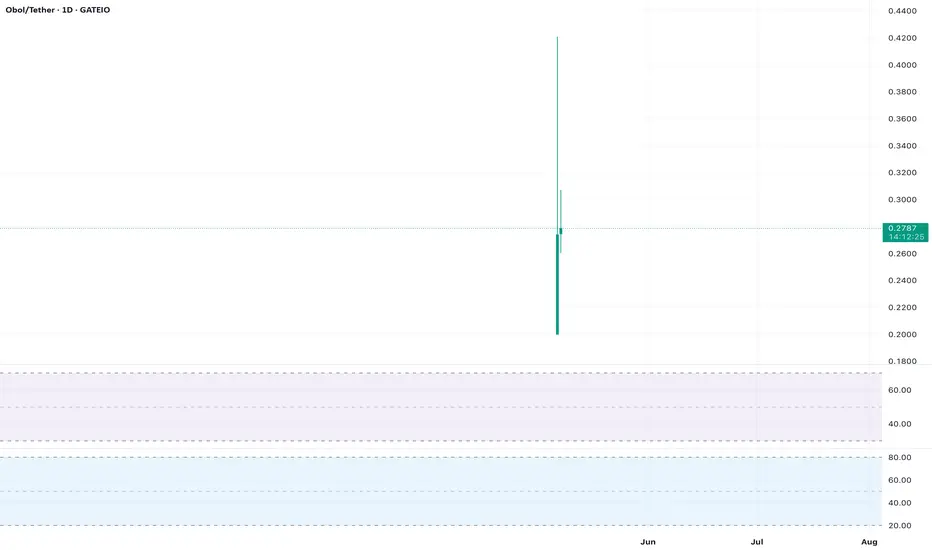
The current price of Obol Network / Tether USD (OBOL) is 0.0577 USDT — it has risen 91.06% in the past 24 hours. Try placing this info into the context by checking out what coins are also gaining and losing at the moment and seeing OBOL price chart.
Obol Network / Tether USD price has risen by 127.17% over the last week, its month performance shows a −65.14% decrease, and as for the last year, Obol Network / Tether USD has increased by 116.10%. See more dynamics on OBOL price chart.
Keep track of coins' changes with our Crypto Coins Heatmap.
Keep track of coins' changes with our Crypto Coins Heatmap.
Obol Network / Tether USD (OBOL) reached its highest price on May 12, 2025 — it amounted to 0.3380 USDT. Find more insights on the OBOL price chart.
See the list of crypto gainers and choose what best fits your strategy.
See the list of crypto gainers and choose what best fits your strategy.
Obol Network / Tether USD (OBOL) reached the lowest price of 0.0247 USDT on Jun 16, 2025. View more Obol Network / Tether USD dynamics on the price chart.
See the list of crypto losers to find unexpected opportunities.
See the list of crypto losers to find unexpected opportunities.
The safest choice when buying OBOL is to go to a well-known crypto exchange. Some of the popular names are Binance, Coinbase, Kraken. But you'll have to find a reliable broker and create an account first. You can trade OBOL right from TradingView charts — just choose a broker and connect to your account.
Obol Network / Tether USD (OBOL) is just as reliable as any other crypto asset — this corner of the world market is highly volatile. Today, for instance, Obol Network / Tether USD is estimated as 254.47% volatile. The only thing it means is that you must prepare and examine all available information before making a decision. And if you're not sure about Obol Network / Tether USD, you can find more inspiration in our curated watchlists.
You can discuss Obol Network / Tether USD (OBOL) with other users in our public chats, Minds or in the comments to Ideas.