OBOL/USDT Bullish continuationOBOL is creating higher highs and higher lows with clean structure. We have just created the last higher low at 0.1420 and I am expecting to see a new high created above structure.
My target is 0.1665
SL is 0.1345

OBOL/USDT – Bullish Breakout with Retest in PlayOBOL/USDT
Analysis Summary:
The chart shows a potential breakout from a horizontal consolidation range after a period of accumulation. A range breakout is highlighted, with a projected target based on the height of the range.
Key points:
Price is currently retesting the breakout zone, a common

Post-Airdrop FOMO Fade Drives Selling PressureAnalysis: X posts suggest $OBOL’s recent price action is driven by a post-airdrop FOMO fade, with strong selling after the May 7, 2025, Token Generation Event (TGE). The price is below the 50-day EMA, and the Chaikin Money Flow (CMF) indicates capital outflows. A short targeting $0.215 is viable if

Fibonacci Retracement Points to Deeper CorrectionAnalysis: Applying Fibonacci retracement from the all-time high ($0.380077) to the all-time low ($0.284628), $OBOL is below the 0.236 Fib level ($0.305). The next support lies at the 0.382 Fib level ($0.25), aligning with major support noted in X posts. The lack of bullish volume and a bearish MACD
Volume Profile Shows Thin Support Below $0.29Analysis: The volume profile indicates low buying interest between $0.29 and $0.25, creating a “value gap” where the price could slide quickly. The price is below the Volume Weighted Average Price (VWAP), and the 20-day EMA is sloping downward, confirming bearish momentum. A break below $0.285 targe

Bearish Trendline Resistance Caps UpsideAnalysis: $OBOL is trading below a descending trendline formed since its all-time high of $0.380077 on May 7, 2025. Attempts to break above $0.30 have been rejected with low buying volume, signaling weak bullish conviction. The Stochastic Oscillator is in the overbought zone on the 1-hour chart, sug

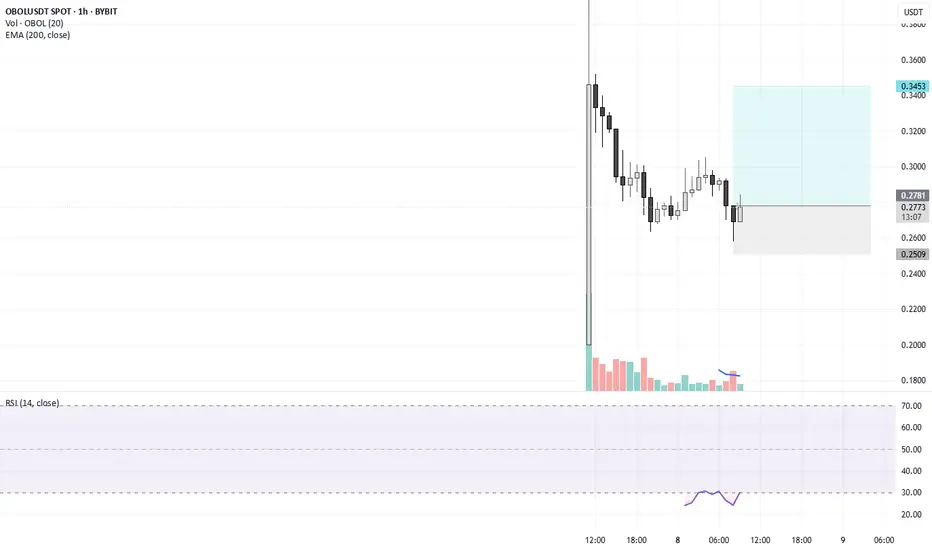
OBOL USDTCP 0.2776
BUY: 0.026 TO 0.29
SELL 0.345 OR MORE
SL: 0.25
high volume
new project can b pump any time.
Oversold CRSI Signals Short-Term Bearish ContinuationAnalysis: Recent X posts note that the Composite RSI (CRSI) for $OBOL is in extremely oversold territory, typically a bearish signal post-FOMO airdrop. The price is below the 200-day SMA, and the MACD histogram is deepening, indicating sustained selling pressure. A drop to $0.235 is plausible if the

Short Opportunity on Retest of Broken SupportAnalysis: After breaking $0.29161, $OBOL may attempt a pullback to this level, now acting as resistance. The 4-hour chart shows high-volume bearish candles, and open interest suggests short positions are accumulating. A rejection at $0.295–$0.30 with volume >150M could confirm the short setup, targe

High-Volume Breakdown Signals Further DeclineAnalysis: The 29% price drop in 8 hours on Binance, coupled with surging trading volume, indicates strong bearish sentiment. The price is below the 50-day Simple Moving Average (SMA), and the RSI is declining without bullish divergence, suggesting no immediate reversal. Key support at $0.25 is the n

See all ideas
Summarizing what the indicators are suggesting.
Oscillators
Neutral
SellBuy
Strong sellStrong buy
Strong sellSellNeutralBuyStrong buy
Oscillators
Neutral
SellBuy
Strong sellStrong buy
Strong sellSellNeutralBuyStrong buy
Summary
Neutral
SellBuy
Strong sellStrong buy
Strong sellSellNeutralBuyStrong buy
Summary
Neutral
SellBuy
Strong sellStrong buy
Strong sellSellNeutralBuyStrong buy
Summary
Neutral
SellBuy
Strong sellStrong buy
Strong sellSellNeutralBuyStrong buy
Moving Averages
Neutral
SellBuy
Strong sellStrong buy
Strong sellSellNeutralBuyStrong buy
Moving Averages
Neutral
SellBuy
Strong sellStrong buy
Strong sellSellNeutralBuyStrong buy