Post-Airdrop FOMO Fade Drives Selling PressureAnalysis: X posts suggest $OBOL’s recent price action is driven by a post-airdrop FOMO fade, with strong selling after the May 7, 2025, Token Generation Event (TGE). The price is below the 50-day EMA, and the Chaikin Money Flow (CMF) indicates capital outflows. A short targeting $0.215 is viable if $0.285 breaks. Entry: $0.288. Stop Loss: $0.30. Take Profit: $0.235, $0.215.
OBOLUSDT trade ideas

Fibonacci Retracement Points to Deeper CorrectionAnalysis: Applying Fibonacci retracement from the all-time high ($0.380077) to the all-time low ($0.284628), $OBOL is below the 0.236 Fib level ($0.305). The next support lies at the 0.382 Fib level ($0.25), aligning with major support noted in X posts. The lack of bullish volume and a bearish MACD crossover support a short setup. Entry: $0.29. Stop Loss: $0.31. Take Profit: $0.25, $0.215.

Volume Profile Shows Thin Support Below $0.29Analysis: The volume profile indicates low buying interest between $0.29 and $0.25, creating a “value gap” where the price could slide quickly. The price is below the Volume Weighted Average Price (VWAP), and the 20-day EMA is sloping downward, confirming bearish momentum. A break below $0.285 targets $0.235. Entry: $0.288. Stop Loss: $0.295. Take Profit: $0.235, $0.215.

Bearish Trendline Resistance Caps UpsideAnalysis: $OBOL is trading below a descending trendline formed since its all-time high of $0.380077 on May 7, 2025. Attempts to break above $0.30 have been rejected with low buying volume, signaling weak bullish conviction. The Stochastic Oscillator is in the overbought zone on the 1-hour chart, suggesting a pullback. A short entry below $0.29 targets $0.25. Entry: $0.289. Stop Loss: $0.31. Take Profit: $0.25, $0.22.

OBOL USDTCP 0.2776
BUY: 0.026 TO 0.29
SELL 0.345 OR MORE
SL: 0.25
high volume
new project can b pump any time.
Oversold CRSI Signals Short-Term Bearish ContinuationAnalysis: Recent X posts note that the Composite RSI (CRSI) for $OBOL is in extremely oversold territory, typically a bearish signal post-FOMO airdrop. The price is below the 200-day SMA, and the MACD histogram is deepening, indicating sustained selling pressure. A drop to $0.235 is plausible if the price fails to reclaim $0.30. Entry: $0.29. Stop Loss: $0.305. Take Profit: $0.235, $0.20.

Short Opportunity on Retest of Broken SupportAnalysis: After breaking $0.29161, $OBOL may attempt a pullback to this level, now acting as resistance. The 4-hour chart shows high-volume bearish candles, and open interest suggests short positions are accumulating. A rejection at $0.295–$0.30 with volume >150M could confirm the short setup, targeting $0.235. Entry: $0.295 (on retest). Stop Loss: $0.315. Take Profit: $0.235, $0.215.

High-Volume Breakdown Signals Further DeclineAnalysis: The 29% price drop in 8 hours on Binance, coupled with surging trading volume, indicates strong bearish sentiment. The price is below the 50-day Simple Moving Average (SMA), and the RSI is declining without bullish divergence, suggesting no immediate reversal. Key support at $0.25 is the next target, with a potential further slide to $0.215 if volume remains elevated. Entry: $0.288. Stop Loss: $0.31. Take Profit: $0.25, $0.215.

Bearish Momentum Confirmed Below $0.2916 SupportAnalysis: $OBOL has broken below the critical support at $0.29161 with high selling volume (>150M), as highlighted in recent X posts. This confirms a markdown phase with lower lows and bearish candlestick patterns on the 4-hour chart. The Moving Average Convergence Divergence (MACD) shows a bearish crossover, and the price is trading below the 20-day EMA, reinforcing downside pressure. A retest of $0.25 is likely if selling continues. Entry: $0.29 (on pullback to $0.295). Stop Loss: $0.305. Take Profit: $0.25, $0.235.
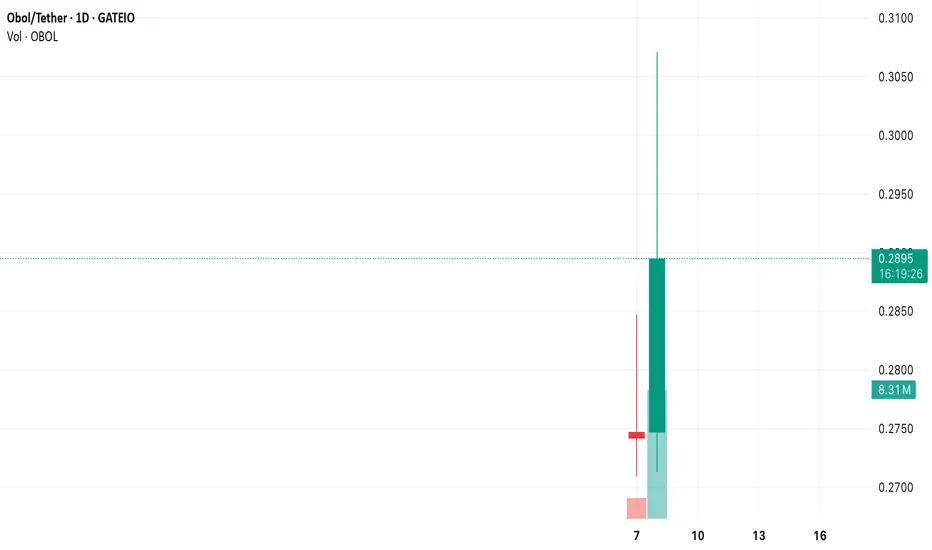
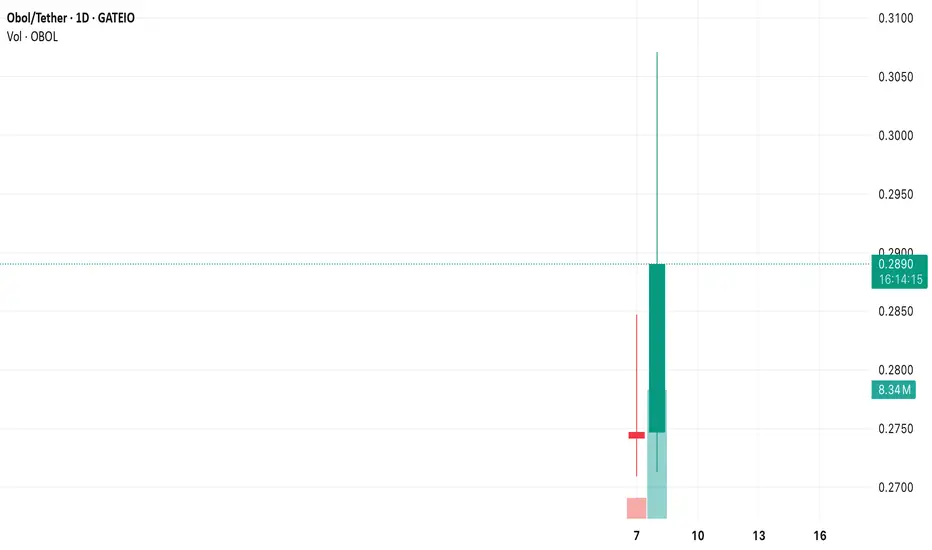
Accumulation Phase Near All-Time LowsAnalysis: $OBOL’s recent drop to $0.276294 (24-hour low on May 8, 2025) places it near its all-time low of $0.284628, suggesting a possible accumulation zone for long-term buyers. The Bollinger Bands show the price hugging the lower band, often a precursor to a bounce in low-liquidity assets. Open interest on exchanges like Binance indicates short positions may be overextended, increasing the likelihood of a short squeeze if positive catalysts (e.g., Obol Collective ecosystem updates) emerge. A breakout above $0.31 could target $0.44, a major resistance level. Entry: $0.29–$0.30. Stop Loss: $0.275. Take Profit: $0.35, $0.44.

Bullish Reversal Potential at Key Support ZoneAnalysis: $OBOL is currently trading near a critical support level at $0.2916, as noted in recent market commentary. This level has historically acted as a strong base, with high trading volume in the past 24 hours ( GETTEX:37M –$44M across exchanges). The Relative Strength Index (RSI) is approaching oversold territory (below 30), suggesting a potential exhaustion of sellers. A 4-hour candle close above $0.295 with volume exceeding 100M could signal a reversal, targeting resistance at $0.33975. The Exponential Moving Average (EMA) 50 is flattening, indicating weakening bearish momentum. Entry: $0.295. Stop Loss: $0.285. Take Profit: $0.34, $0.38.

OBOL's Fibonacci Retracement Levels: Support and ResistanceApplying Fibonacci retracement levels to OBOL's recent swing high and low reveals key support at the 38.2% level (around $0.2600) and resistance at the 61.8% level (around $0.3200). These levels can act as magnets for price action, providing potential entry and exit points.
OBOL's Bollinger Bands Squeeze: Impending Breakout?The Bollinger Bands for OBOL have been tightening, suggesting a period of low volatility. This "squeeze" often precedes a significant price move. Traders should prepare for a potential breakout, with the direction determined by the next move beyond the upper or lower band.

OBOL's Stochastic Oscillator: Overbought ConditionsOBOL's stochastic oscillator is currently in overbought territory, indicating that the token may be due for a pullback. Traders should be cautious of chasing the price at these levels and consider waiting for a dip or a move back into oversold territory for potential long entries.

OBOL's Volume Profile: Identifying Key LevelsAnalyzing OBOL's volume profile reveals significant trading activity around the $0.2800 level, suggesting it as a key support area. If this level holds, it could act as a springboard for another leg higher. Conversely, a breakdown below could lead to a deeper correction.

OBOL's MACD Divergence: A Bearish Signal?A divergence has formed between OBOL's price and its MACD, with the price making higher highs while the MACD makes lower highs. This bearish divergence could foreshadow a potential reversal in the uptrend. Traders should monitor this closely and consider reducing exposure if the divergence persists.

OBOL's Trading Range: Opportunities for Day TradersWith OBOL establishing a trading range between $0.2500 and $0.3500, day traders may find opportunities to capitalize on short-term price swings. Look for entries on pullbacks to the lower range boundary and exits on rallies towards the upper boundary, using stop losses to manage risk.

OBOL's Post-Listing Surge: A Technical OutlookThe OBOL token has experienced an initial surge following its listing on Gate.io, reflecting strong market sentiment. Traders are advised to watch for consolidation patterns around the $0.3000 level, which could signal a continuation of the uptrend or a reversal point. Keep an eye on trading volume as it can confirm the strength of the move.


OBOL Price Analysis Post-Gate.io ListingWith the recent listing of OBOL on Gate.io, the token has shown significant volatility, reflecting market interest and community engagement. The initial surge post-listing suggests strong demand, but the subsequent pullback indicates profit-taking. Moving averages (MA5: 0.2852, MA10: 0.2831) suggest a short-term consolidation phase. MACD indicators (MACD: 0.0009, DIF: -0.0145, DEA: -0.0154) show a potential bullish crossover, hinting at further upside potential. Traders should monitor key support levels around $0.2000 and resistance at $0.3105 for clues on the next move.

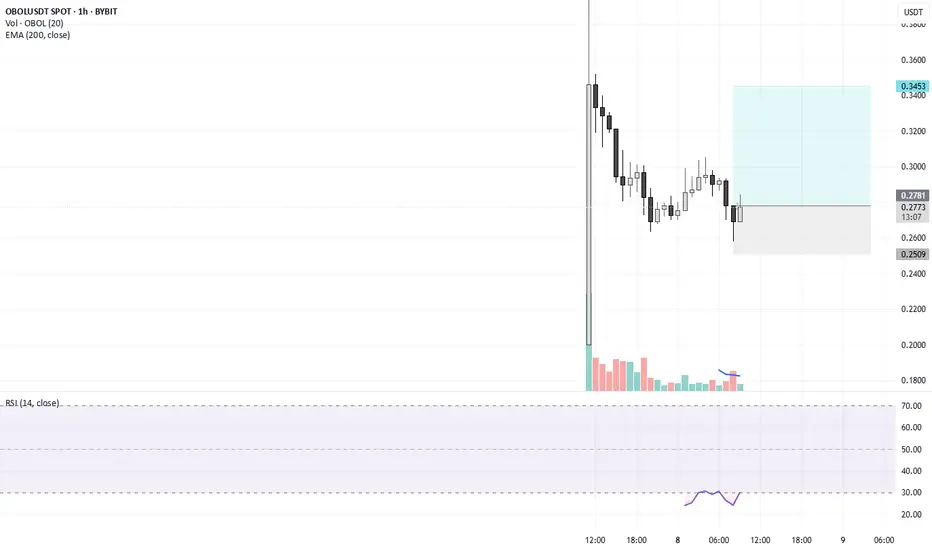
OBOL/USDT - Initial Volatility and Potential Uptrend on Gate.ioOBOL/USDT has shown significant volatility since its listing on Gate.io. The 1-hour chart reveals a sharp initial drop followed by a strong recovery, currently trading around $0.2999. The price is above the 5-period Moving Average (0.2852) and the 10-period Moving Average (0.2831), suggesting a potential short-term uptrend. The 24-hour high reached $0.4211, indicating strong buying interest at higher levels.
The MACD indicator (12, 26, 9) shows the MACD line slightly above the signal line, hinting at possible bullish momentum. However, traders should be cautious of the high volatility typical of newly listed assets. Monitoring key support and resistance levels, as well as further volume confirmation, will be crucial in determining the sustainability of this upward movement.