OCEANUSDT in the local uplinkHello everyone. Today we will consider OCEANUSDT. This coin differs from other coins in its schedule: after a long growth, OCEANUSDT is in the range and is saving up strength to go further. Already 4 times the coin has been hitting the 0.42 level. At the moment, the price is in the local ascending channel and goes to the upper limit of the range. Therefore, from the current price values, you can take a long with a target of 0.42.
OCEANUSDT trade ideas

OCEAN INTRADAY SETUP.. (NFI)Hello Traders!
OCEAN seems to take off, it may take 2 days around to reach the top target. (if market stay stable)
This is my view, share your valuable thoughts...!!

Ocean Long and Short possibilitiesHere I have shown two possiblities in the graph you can take advantage of both scinarios by longing or shorting. Happy trading


🟢 OCEANUSDT 🟢NO LIQUDITY SWEAP NO ENTRY.
STRUCTURE IS CHANGING ANYTIME.
EVERY CANDLE HAS LIQUIDITY.
PRICE ALWAYS NEED LIQUIDITY.
Nobody Knows Where is Price Going.
Hey traders, here is the analysi.
If you guys like my analysis please hit like?? and follow.
Thanks.
SMART MONEY CONCEPT.
identify Liquidity Or Become Liquidity
DISCLAIMER- This is not financial advice.

OCEANUSD - an upsite is limitedHello traders,
Let's review OCEANUSD 1D chart.
OCEAN still looks bullish and we expect a bit more upside, however it's limited now.
It's not the best entry for fresh longs therefore we look for a short position soon as buyers will be taking profit and exiting their longs.
- Our strategy is to acccumulate short between 0,465 - 0,50 usd
- Target for shorts: 0,2620 usd
- Please hit the like button and
leave a comment to show your support !
Good luck!

OCEAN shortOCEAN broke trough off the lower boundary of ascending channel. Bearish movement to support level at 0.363 is expected to happen.

OCEAN S&R in Multi time frame's>>>>>>I Have Tried My Best to Bring the best Possible outcome in this Chart.
Based on the OCEAN chart's,
We still wating for entry huge volume to does prove OCEAN can start short term upside rally price by short TP...
In case of break's downside channel's price can growth till 0.56-0.60 depend's of market support's.
But show some positive movement's in shorter time frame,
that possibilitie's start short updide rally.
It's Not a financial advise.
PLZ DYOR
With hopping success>>>>>

Ocean is moving 1hClear support and clear local resistance levels. A breakout impulse will mean that a target of 9% can be achieved soon. 0.3750 is a breakpoint, and we need a candle to close above it on the 4-hour timeframe. Currently, BTC is also positive, and the chance for movements like this is rising.
Also, I noticed these small impulses between July 12th-13th morning that held the level.

OCEANUSDTOcean in a massive bull flag
Back-tested the breakout successfully also.
100% move is on the cards

ocean retest and long targetsim looking to retest off the 0.382 fib which is also the bottom trendline @ 0.387 then target of 0.44cents

Oceanusdt bearish Hello trader, hope everyone is doing well and making profit.
Ocean protocol forming a bearish wedge in a small timeframe(1 hour) ,if the pattern breaks below the trend line go for the short entry.
.
.
.
.DYOR!!!!!

Ocean Looks Good For Short TermOceanusdt
Breakout and retest was already confirmed on 4h time-frame | Symmetrical Pattern |
I am expecting here a bullish move almost 15-30%
Let's see
Dyor


OCEAN Protocol Trend ContinuationOCEAN Protocol currently exhibits the potential for a trend continuation of its bullish momentum, suggesting the possibility of further upward movement in the near term. The price action indicates ongoing buying pressure and positive market sentiment, indicating a potential continuation of the upward trend.
Considering the potential trend continuation, a price target of $0.38 could be set for Ocean Protocol. This target represents the projected upside that could be achieved if the bullish trend persists.
Looking forward to read your opinion about it.

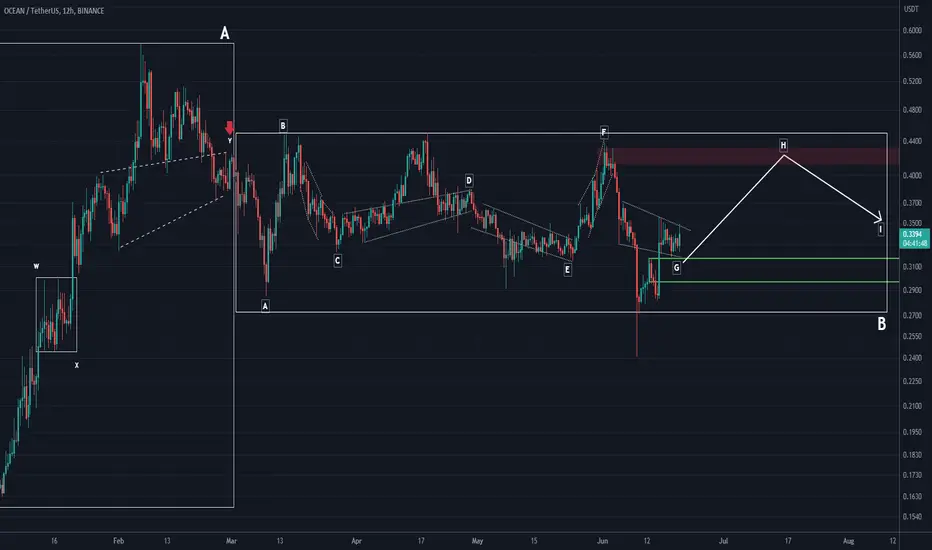
OCEAN ANALYSIS (12H)Hi, dear traders. how are you ? Today we have a viewpoint to BUY/LONG the ocean symbol.
It seems that the H wave is about to start from the symmetrical of the big B wave. The green area must be preserved.
For risk management, please don't forget stop loss and capital management
When we reach the first target, save some profit and then change the stop to entry
Comment if you have any questions
Thank You
oceanIt is now in a small support zone, if it breaks through, it can touch lower ranges in the medium term.

OCEANUSDT: TECHNICAL ANALYSIS.Hello traders,
Wave 4 is supposed to end at 0.2408-0.2140 zone. Then wave 5 is supposed to materialise
towards the resistance zone at 0.7020.
Thanks.

Ocean Performig bull flag pattern
What is a bull flag?
How to identify a bullish flag on forex charts
Bull flag trading strategy
How reliable is the bull flag?
Bull flag vs bear flag
HOW TO IDENTIFY A BULLISH FLAG ON Crypto Charts
It can be complex identifying a bull flag on a chart because the pattern entails several different components. Traders will need to correctly identify and understand these components to trade this pattern successfully. Key things to look out for when trading the bull flag pattern are:
Preceding uptrend (flag pole)
Identify downward sloping consolidation (bull flag)
If the retracement becomes deeper than 50%, it may not be a flag pattern. Ideally, the retracement ends at less than 38% of the original trend
Enter at bottom of the flag or on the breakout above the high of the upper channel boundary
Look for price to break higher with a length potentially equal to the size of the flag pole


ocean long incoming Entry: 0.3532
Profit: 0.6591 (86.61%)
Stop: 0.2929 (17.07%)
Risk-To-Reward: 5.07
hello Traders, here is the full analysis for this pair, let me know in the comment section below if you have any questions, the entry will be taken only if all rules of the strategies will be satisfied. I suggest you keep this pair on your watchlist and see if the rules of your strategy are satisfied. Please also refer to the Important Risk Notice linked below.

OCEAN is breaking out through important resistance OCEAN / USDT
Price is trying to break long downtrend in the confluence with local bull flag
If the Breakout out is confirmed…strong bullish wave can be followed

$Ocean- Bullish FlagA good EP for a bullish flag breakout fpr $Ocean.
Take note that this is a HTF so it might range withing that upper channel for days before making a break.
