OGN/USDT BULL FLAG BREAKOUT! LONG TRADE SETUP!!Hello everyone, if you like the idea, do not forget to support with a like and follow.
Welcome to this OGN/USDT TRADE setup. OGN looks good here.
OGN is breaking out from the bull flag in 1hr time frame. Buy some now and add more in the dip.
Entry range:- $0.62-$0.64
Target:- 20%
SL:- $0.60
Lev:- 10x
If you like this idea then do support it with like and follow.
Also, share your views in the comment section.
Thank You!
OGNUSDT trade ideas

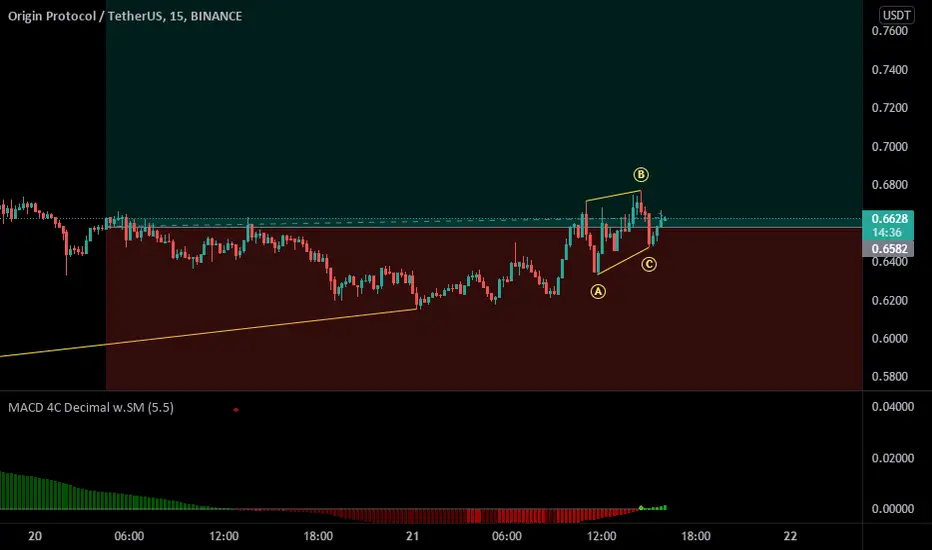
Will OGN continue its uptrend? - Here's the entry levelHere's a quick look at the OGN 2 hr chart. As we can see, the price broke out previously from the bull flag and is now trying push further to the upside. If you didnt catch the immediate breakout form the bull flag, Then the best entry would be when the price breaks above 0.66$ with good amount of volume. Definitely one to keep an eye on!
-------------------------------------------
The idea is: Buy when the price breaks above 14.4$ and take profits at the levels shown in the chart.
Targets:
1. 0.68$
2. 0.72$
3. 0.76$
-------------------------------------------
What Is a Wedge in the context of trading?:
"A wedge is a price pattern marked by converging trend lines on a price chart. The two trend lines are drawn to connect the respective highs and lows of a price series over the course of 10 to 50 periods. The lines show that the highs and the lows are either rising or falling and differing rates, giving the appearance of a wedge as the lines approach a convergence. Wedge-shaped trend lines are considered useful indicators of a potential reversal in price action by technical analysts.
Key Takeaways for Falling wedges:
1. Wedge patterns are usually characterized by converging trend lines over 10 to 50 trading periods.
2. The patterns may be considered rising or falling wedges depending on their direction.
3. These patterns have an unusually good track record for forecasting price reversals."
-------------------------------------------
If you like the content, then make sure to comment and like the post :D
Follow me for daily profitable trading setups
BTC dictates the market. If BTC falls, then Alts will fall as well. Trade safe!

OGNUSDT Inverse Head and ShouldersThe Head and Shoulders pattern is an accurate reversal pattern that can be used to enter a bearish position after a bullish trend. It consists of 3 tops with a higher high in the middle, called the head. The line connecting the 2 valleys is the neckline. The height of the last top can be higher than the first, but not higher than the head. In other words, the price tried to make a higher high, but failed. The closer the 2 outer tops are to the same price, the more accurate the pattern.
If the price breaks the neckline and closes below it, the pattern has completed. Conservative traders may look for additional confirmation. The target can be estimated by measuring the height of the pattern (from the neckline to the head) and projecting this downwards. Common stop levels are above the neckline or above the right shoulder. The Inverse Head and Shoulders is the bullish version of this pattern that can form after a downtrend. TradingView has a smart drawing tool that allows users to visually identify this pattern on a chart.

OGNUSDT UpdateOK Traders Here is the confirmation for those who not in the trade. Enter when it breaks and you already know the levels I am worried about. Don't Forget to Follow me and support me.
OGNUSDT AT SUPPORTPotential Reversal - AT SUPPORT
It's hit a big support at 0.6173 - none financial advice but it has a good chance of going up to capture 0.70

OGN Bullish Flag PatternHello Traders
OGN is very bullish.
Good fundamentals and huge buy volumes in last few weeks made a good rally.
Also it had a good correction and right now price seems created a bullish flag pattern that could push the price to 1.09 - 1.19 $ per token.
Like, Follow and Share Please.
Stay Safe.
Thanks For Reading.
-RC

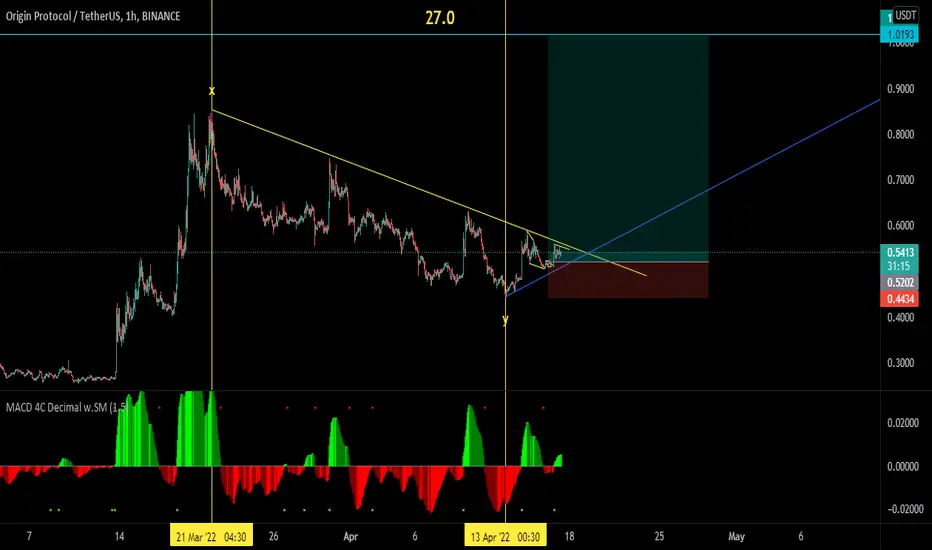
OGNUSDTThe Idea that has been shared yesterday has been removed due to the House rule violation. Pardon me for doing that. Ok here it is again. This is the move that I am looking for. It is clear now take a Buy and manage it down below is the levels that I am into.
0.7998
1.0193
1.7184
Feel free to ask anything if you have Questions. Because I love to share my thoughts with the community.

OGNUSDTIf OGNUST had a retracement we will buy @0.546 by 12% of our trading balance,
and our Stop-loss @ 0.501
and another buy limit order @ 0.52 by 25% from the trading balance. SL: 0.501
Target: 0.625

OGN CORRECTION INCOMING???OGN had bos on 4h timeframe and now it reacted pretty well from next high(supply zone)
I am waiting for retest and I will short it with sl being the redline above supply zone.
THIS IS VERY RISKY SINCE MARKET TURNED BULLISH SO BE AWARE!!!
THIS ISNT FINANCIAL ADVICE,JUST MY OPINION!!!

OGN SHORT TERM PULLBACK TO DEMAND ZONE?OGN had broke multiple structures wich confirms that it changed trend is heading to new highs.
Homever as I posted before ,after having break of strucutre there will mostly be pullback and retest of the demand zone that caused break of strcuture and after that there comes new highs.
This is nothing to worry about, this happens most of the times bos happens.
I posted this for people who want to buy ogn . DONT fomo, wait for your entry to be filled
NOT FINANCIAL ADVICE, JUST MY OPINION!!!

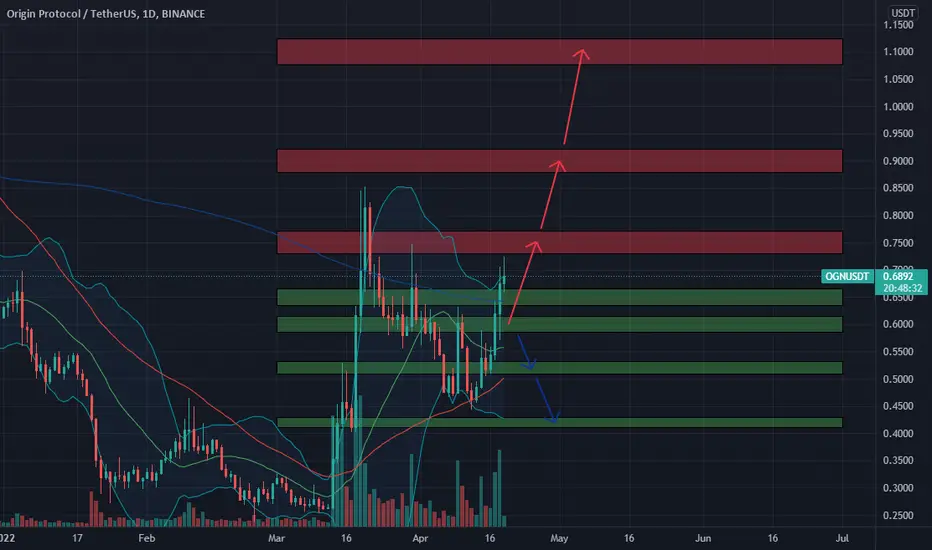
🆓Origin Protocol (OGN) Apr-19 #OGN $OGN
OGN may continue to increase strongly in the near future with the buying force being continuously pushed in. The $0.6 zone is the important support zone of this uptrend.
📈RED PLAN
♻️Condition : If 1-Day closes ABOVE 0.6$ zone
🔴Buy : 0.65 - 0.6
🔴Sell : 0.75 - 0.9 - 1.1
📉BLUE PLAN
♻️Condition : If 1-Day closes BELOW 0.6$ zone
🔵Sell : 0.6
🔵Buy : 0.52 - 0.42
❓Details
📈Red Arrow : Main Direction as RED PLAN
📉Blue Arrow : Back-Up Direction as BLUE PLAN
🟩Green zone : Support zone as BUY section
🟥Red zone : Resistance zone as SELL section
OGN (ORIGIN PROTOCOL) Review>>>>>>>Hello EveryOne
I try to review any crypto, which is in small positive signals
I examined
To determine if the motion is correct or fake
As I marked in the chart,OGN is moving in a medium-term downtrend
By to the high volume candlesticks today in the chart,
If OGN can break's the top-line of the descending channel (0.65 area) ,
For buying position We are waiting for the pullback and positive reaction to the roof area of the descending channel (0.59) we can set our TP's
It's not financial advise
PLZ DYOR
With hopping success>>>>>>>>>>>>>>

OGNUSDT SETUPOGNUSDT price retested the buying zone and bounce after printing a strong breakout. As we know markets are already in a pullback scenario, So One can accumulate OGN at these levels for a good upside move.

OGN : To 3.40 ? (Final Updated) Global view
Entry : Wait for pull back from support (0.5429/0.5283/0.5060)
or if 0.5700 holds
.
It looks so,
I'm grateful for every bounce it made
even though i only keep getting in& out
.
Apart from SHIB, This is another yummy one <3

$OGN WILL FLY 👀$OGN broke the bull flag with a big bullish candle supported by volume, we might see a +20% move starting from this week.
Origin was founded in 2017 by successful Silicon Valley entrepreneurs and has a team of experienced engineers from iconic tech companies like YouTube, Google, PayPal, and DropBox.


OGN GOING TO MOON!!!OGN just had break of structure on lower timeframes and change of chracter on higher timeframes,this is very bullish move and also if you take in consideration the choppy market it did it in makes it even more bullish.
I will be waiting for retest of the zone marked and will have my entry there as a swing position aiming for new high that is over 80% and with leverage i use its 400%.
Market slowly turning back to bullish,waiting for btc to test 39k demand zone and then go to the moon and new highs
I WILL BUY BELOW 0.475
NOT FINANCIAL ADVICE!

Long OGN opportunity EVERYTHING in Chart !
Goals :-
0.67
0.75
0.82
0.89
Closing under 0.55 bad for the coin

OGN - LONGHey Guys, my thoughts on OGN. Could be a nice opportunity for a long term trade. I get in after the breakout.
No financial advice!
DYOR!
Happy Trading

OGN BREAKOUT!! READY TO PUMP 230%!!Hi guys, This is CryptoMojo, One of the most active trading view authors and fastest-growing communities.
Do consider following me for the latest updates and Long /Short calls on almost every exchange.
I post short mid and long-term trade setups too.
Let’s get to the chart!
I have tried my best to bring the best possible outcome in this chart, Do not consider it as financial advice.
Welcome to this OGN/USDT update.
Long OGN/USDT
Entry range:- CMP and more up to $0.535
Target:- 230%
SL:- $0.44
This chart is likely to help you in making better trade decisions if it did consider upvoting this chart.
Would also love to know your charts and views in the comment section.
Thank you


#Bitcoin #OGN Broke the triangle coming soon 0.90$#Bitcoin #OGN Broke the triangle coming soon 0.90$
#BTC #Metaverse #NFT #crypto_group_btc
#BTC #Metaverse #NFT #crypto_group_btc
#BTC #Metaverse #NFT #crypto_group_btc

OGNUSDTOGN VS USDT Going Long. After that we will see another pullback. After that the major correction will be complete. then We can go for a Long Again