OGNUSDT trade ideas

Origin protocol has an all star team. Good time to enter? $OGNFA,
- Disrupting sharing economies like Uber, AirBnb
- All star team and investors. Includes Yu Pan from Paypal Mafia. Paypal Mafia has to be the most accomplished founding team ever
- Team includes engineers,leaders,managers from Paypal, Youtube, Dropbox and other acquired companies.
- Investors include Steve Chen(youtube), Alexis Ohanian(Reddit), Randall Kaplan (Akamai), Gil Penchina(Fastly,ebay), Garry Tan (Y combinator, coinbase)
- Goal to cut out centralised intermediaries that carve out hefty fees in order to enable true P2P sharing economies.
TA,
- MACD golden cross 4H
- 4H 200ema support
- Daily hammer rejection on 120EMA
- 0.786 FIB support
Good area to start buying but I'm waiting till there's clear signs of the short term trend reversal along with the break of 0.618 level of 0.4364.
Interesting to see if it respects the long term wedge support as well

OGNUSDT SETUP S/Rognusdt setup berada pada support 0.4. dan berusaha untuk naik dan mengejar target di high sebelumnya.

OGN is bouncing off key levels OGN (competes with shopify + is the backbone of all shared economy dapps) is a solid blue chip in the crypto space. they have a real product, with real partners. recently announced an on going data share collaboration with google and the team is solid. after a pump to $.65 this sell off brings them back to previous levels. I recommend getting in here between $.35-$.40. mark my words - OGN will reach at least $1.20


OGNUSDT ANALYSISI have 4 positive signal It broke the down trendline
If you hold this coin time to sell it because it is almost touching the resistance line( $ 0,4698)
Also you can buy it right now or you can wait for turning resistance line to the support line ( $ 0,4698) and wait for EngineeringRobo' s sell signal
Have a good trade . If you still didn't use EngineeringRobo please dm me .


✳️Origin Protocol [OGN/USDT] on August 08 #OGN $OGN #OGNUSDTOGN reacted very well after hitting the $ 0.25 zone but the current buying pressure is not too strong and this will be the thing you need to be careful about when OGN hits the $ 0.37-0.38 zone.
I think OGN will need more time to break out of the $ 0.37-0.38 zone and towards the $ 0.45 and even $ 0.55 zone this August.
If you want to buy OGN, a good buy zone to buy is $ 0.33-0.34

Deciding lineUnder the 50 MA this become short term bearish. Above the 50 MA it could be a bounce from support.


OGN/USDT | Holding Structure | Support Confluence |Trade Setup Today's analysis – OGN/USDT – Consolidating at daily support as it retraces from the local swing high.
Points to consider:
- Strong Counter-trend
- Daily/Trend Support Confluence
- 21 EMA Visual Guide
- Declining Volume
- Oscillators Below 50
OGN USDT retracing in a strong countertrend from its previous swing high as it reverts to trend support, historically seen to be a key pivotal level.
Price consolidating and respecting trend support as it coincides with daily support putting emphasis on the key level.
Further price development will allow the 21 EMA to act as a visual guide, assisting in trade management.
Volume is steadily tapering off indicating an influx being imminent, likely to coincide with the breakout.
Both the RSI and Stochastics trading below 50; an indication of lacking strength and momentum in the immediate market. Oscillators are likely to neutralise as the trade sets up.
Overall, in my opinion, price needs to hold trend support; a successful S/R flip of the 21 EMA validates a long trade to technical targets above with risk defined below daily support.
If you’ve read this far - thank you for following my work!
And as always,
Focus on you, and the money will too!


OGNUSDT analysisOGNUSDT is very bullish. However, it has to break an ATH. with Buy 2 and bull signals last week from crypto engineering, I believe this chart has momentum to break it ATH. There is money to be made until it reaches resistence.


OGN/USDT - Long - Potential 12%Look after your portfolio and it will look after you & If you liked this idea, please like and subscribe to my profile
PAIR: OGN/ USDT
T/F: 1 HOUR
LENGTH: Short
RISK - Low
ENTRY: 3105
TP1: 3332
TP2: 3500
SL: 2844
NOTES:
- Uptrend
- Support Break up candle
- Rejection candle
- Bouncing off RSI trendline
KEY:
BONUS TP - It could continue to rise to a significant high although it is either very long term or a high rist target. REcommended to follow by securing profits with trailing stop loss.
LENGTH:
SHORT = 1-2 DAYS
MEDIUM = Less than 1 week
LONG = Less than 1 month
RISK:
LOW = EG Stong support // Multiple bounces // Strong uptrend // Oversold // Breakout > Pullback > Support // Rejection Candles
MEDIUM = EG. Broken support // Trend Reversal // Consolidation
HIGH = EG. Not fully brokend Support // Overly mature uptrend
***Please note that all of my suggested Entries, TP's and SL's always ignore any precursor 0's***
Please always trade with caution, manage your trades and stop-losses This is not professional financial advice, just my thoughts and trades I am

OGNUSDT ANALYSISThe candles have been stuck in the Rising Wedge since May 16. Therefore;
- if you have OGN, you should sell it at the resistance level(0.47) and will buy again when they crush the stop line of the rising wedge.
- if you don't have OGN, you should buy it when they crush the stop line of the rising wedge.
And take help at the Robo's signals.


DAY TRADING SIGNAL MIN 2% ENJOY OGNUSDTHello guys another day trading opportunities for over 2% target profit.. enjoy.
Motrader.

Ogn wants to break up. Its very loaded from June 18th explosion.OriginToken made an explosion upwards on June 18th with significant volume. It retraced all the way back. Cheers to those who got it on the bottom. It seems as it still not done going up wards.
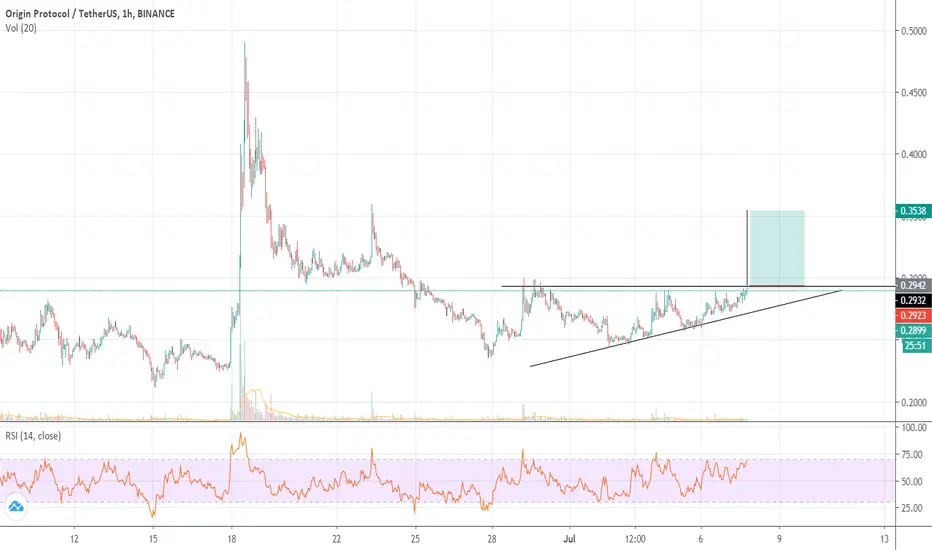
OGNUSDTOGNUSDT, the trend has been rising and is about to break the uptrend line above.
-Wait for an open-close candle. If it is above the uptrend line, you can buy it. But if it is below the uptrend line, you can sell some or more because of expecting more decreases.
-There is also another important strategy is 'BUY' at SUPPORT, 'SELL' it at RESISTANCE.
