OG not finished with the moveIt's 2 a.m. so I'll be short on this one and go sleep. Vision gonna envision some pretty dreams.
So. I do not usually trade fan tokens but in the phase we're at right now, I feel like searching for for the exact scenarios, and this BINANCE:OGUSDT is one of them.
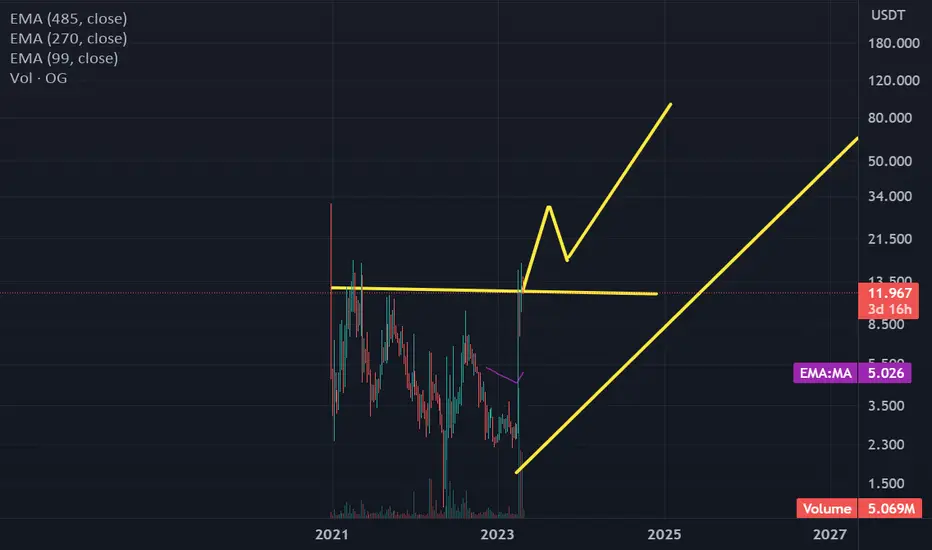
Pumpy-dumpy history, already gave me some add-ons to my PnL and is still repeating its own chart almost in the perfect way (such as BINANCE:WRXUSDT from one of my previous setups did).
Take a look on this chart. Now go left to April. We're now at the point of 16-17 April 23' and just looking for another 1-2 upward legs.
Less words.
Buy Zone is Green
Sell Zones are Red
Have a good trade. Or a good rest.
OGUSDT trade ideas

Long OG!As you see OG bounced 2 times from this area with some strong candles, we expect the price to bounce again, targets specified on the chart
entry: 3.86
last tp: 5 (+30%)
sl: 3.74 (-3%)
good luck everyone!


OGusdtAfter a huge rally of this fan token we are in a great level to buy the dip ,and i have 3 target for this token
1_7.2$
2_8.3$
3_10$
NFA
Do your own research
X (twiiter)account :@Avasco14

🔥 OG Low Volatility Accumulation Break OutOG saw an incredibly bullish move earlier this year, where it gained over 350% in a mere two days. However, since topping around 16$ OG has been falling with no end in sight.
This trade is based on the idea that OG is currently in a horizontal accumulation phase (purple area) and will soon, helped by Bitcoin, move back up towards the 2023 highs.
Most likely, Bitcoin will have to break out through 31,000$ in order to give investors the confidence to launch OG upwards.
Stop just below the most recent June lows, target at 15$. With a tight stop we managed to construct a very high risk-reward trade that most likely has a high expected return. A more defensive strategy would be to take partial profits around 9.5$.

OG Fan Token (OG) formed bullish Gartley| A good buy opportunityHi dear friends, hope you are well and welcome to the new trade setup of OG Fan Token (OG) with US Dollar pair.
Our last successful trade of OG was as below:
Now on 1-hr time frame OG has formed a bullish Gartley for the next price reversal
Note: Above idea is for educational purpose only. It is advised to diversify and strictly follow the stop loss, and don't get stuck with trade.

OGUSDTOGUSDT was trading in long term bearish channel and finally breakout from channel.
Will it continue its bullish trajectory?

BUY SETUP ON OGHi, dear traders. how are you ? Today we have a viewpoint to BUY/LONG the OG symbol.
For risk management, please don't forget stop loss and capital management
When we reach the first target, save some profit and then change the stop to entry
Comment if you have any questions
Thank You

Og Building up for Breakout Og building Up for Another breakout Formed Falling Wedge bIn h4 Timeframe Incase Of breakout expecting 65 to 70% bullish Wave

OGUSDTIGUSDT was trading in long term bearish trend and now OGUSDT current trading to very strong support zone .
Will it continue its bullish trajectory ?

OG. Day chart. Long ideaFrom the lower regions Long. Marked take profit and SL. Using tools Fibonacci retracement and SMC

OG Fan Token (OG) formed bullish Gartley for upto 51% rallyHi dear friends, hope you are well and welcome to the new trade setup of OG Fan Token (OG) with US Dollar pair.
Our last successful trade of OG was as below:
Now on a 4-hr time frame, OG has formed a bullish Gartley pattern for the next price reversal.
Note: Above idea is for educational purpose only. It is advised to diversify and strictly follow the stop loss, and don't get stuck with trade

OG/USDT playing around to fill my orders! (LONG)After a huge breakout and change of character I believe the downtrend is finished and price is testing the entry point.
Don't forget to manage the risk since the coin is pretty volatile and target is a sweet 27% profit!
NFA

OG Analysis: Critical Levels UnveiledThe OG/USDT pair has seen a significant change in the past 24 hours, with a 30% increase in value. This has led to the current price being 7.950. However, the Relative Strength Index (RSI) sitting at 65 indicates that the asset is getting closer to being overbought. That means, the asset is starting to look a bit pricey and could potentially face a price correction soon.
The Fibonacci levels are key to understanding the support and resistance levels. The current price is just above the 0.5 Fibonacci level at 7.84, which could indicate a strong support level if the price maintains above this point.
The Bollinger Bands give us another layer of understanding. The middle band, currently at 7.025, is serving as a strong support level as the price is above it. The upper band at 9.079, on the other hand, is a potential resistance level for the asset to overcome.
The Stochastic Oscillator value at 53 and the MACD at 0.473 suggest that the market sentiment is neutral with a slight tilt toward the buyers. This suggests a balanced market with a mild bullish sentiment.
However, the volume oscillator is currently negative at -11%, while the On-Balance-Volume (OBV) is at 72M. This shows that even though trading volume has decreased, the demand for the asset still remains high, indicating a potential continuation of the upward trend.
The Exponential Moving Average (EMA) at 7.030 is another support level that can potentially provide a buffer for any price drops. This level, along with the middle Bollinger band and 0.5 Fibonacci level, forms a robust support system for the asset.
Lastly, the 24-hour high and low values provide the extreme price levels that the asset has experienced in the last day. These values can serve as significant psychological levels of resistance and support respectively.
In summary, the key support levels are the middle Bollinger band (7.025), the EMA (7.030), and the 0.5 Fibonacci level (7.84). On the other hand, the resistance levels to keep an eye on are the upper Bollinger band (9.079) and the 24-hour high (9.679). This layered understanding of support and resistance levels will be crucial in making informed trading decisions.

OGUSDT- Long I shared OG short trade which completed 100% today.
We can give try to long position with Very close SL.
TP -SL on chart.
SL when 4h candle close below 9.450
Chart respecting our support and resistance line accurately have a look at short trade link below.

🔥 OG Optimal Fibonacci Reversal: 20%-40% Gain PotentialOG was a major winner at the start of April, where it made a 6x in a matter of a few days. Since then, this token has been trading highly volatile and giving ample of opportunities to traders.
After failing to make a new high on 23-04, OG has been in a selling-only mode. Going long here will most likely result in a losing trade. However, a strong short-term bearish trend after a pump like this gives us opportunities to scout for an oversold bounce.
I'm waiting for two things:
- The price reaches oversold on the RSI on either the 4H or 8H timeframe.
- The price reaches the yellow area around the 0.618 Fibonacci retracement, which is also a major support.
The above will give us traders an edge. Looking at the 0.5 (20%) and 0.382 (40%) Fibonacci retracements for potential targets.


OG Waves completed 🔴We did not expect this sudden drop due to the whales’ manipulation of Bitcoin yesterday, which made all currencies hit the speculators’ stop loss, which made the drop strong. What matters to us is the OG coin, which has not yet risen due to its big correction. Through my analysis, we see that the ABC wave impulse has This is why we hope the currency will rise in the next few days

OG Fan Token (OG) formed bullish Gartley for upto 23.50% pumpHi dear friends, hope you are well and welcome to the new trade setup of OG Fan Token (OG) with US Dollar pair.
Previously we caught nice pump of OG as below:
Now on a daily time frame, OG has formed a bullish Gartley move for next price reversal.
Note: Above idea is for educational purpose only. It is advised to diversify and strictly follow the stop loss, and don't get stuck with trade

i see OG will be 35$ on September 2023i see OG will be 35$ on September 2023
i see OG will be 35$ on September 2023
i see OG will be 35$ on September 2023
i see OG will be 35$ on September 2023
i see OG will be 35$ on September 2023
i see OG will be 35$ on September 2023
i see OG will be 35$ on September 2023
i see OG will be 35$ on September 2023
i see OG will be 35$ on September 2023
i see OG will be 35$ on September 2023
i see OG will be 35$ on September 2023
OG cup model ☕According to what we see, the hand of the cup is forming, preparing for the rise, the possibility of the token rising to a price of 14.5, and perhaps its continuation to the upside.

