|Symmetrical Triangle| Squeeze in Crude OilCrude oil is currently forming a symmetrical triangle pattern, a classic squeeze formation with price compressed into a tight range. Symmetrical triangles typically act as continuation patterns, favoring the prevailing trend, and in this case, on the daily chart, the trend is well established: a bullish trend with high volume. As the dominant trend is clearly bullish, and volume has remained relatively high throughout the consolidation, it supports furthermore the potential for continuation to the upside.
On the Bollinger band the squeeze is more visible, and suggests diminishing volatility, which is often followed by expansion. Unlike earlier price action before consolidation, recent sessions are exhibiting larger candlestick bodies accompanied by pronounced wicks on both ends. Meaning adding confluence to our potential breakout. These conditions create a buildup of potential momentum in the market, exactly what fuels explosive breakouts when key levels are breached.
Though such pattern can also serve as a reversal signal when broader macro conditions shift.
But, and this is a big but, beyond the chart, the geopolitical context is intensifying. The Israel-Iran conflict continues to escalate, and with the most recent reports of direct US involvement, that is the strikes on Iranian nuclear infrastructure, the risk on crude oil is rising. The possibility of Iranian retaliation, introduces serious potential for supply disruption, as any military response or blockade would likely trigger a sharp spike in the price.
This confluence of technical breakout potential and geopolitical instability makes this setup particularly potent. If we get a confirmed breakout above the triangle and a clean close above the 77–79 zone, combined with global uncertainty and potential supply shocks, could put the $84-85 target well within reach in the near term. Beyond that, should geopolitical tension escalate, oil could accelerate toward $90 or even $100.
In short, this is a high-stakes moment. If price does break out, it won’t just be a technical move, it will ride a wave of volume, volatility, and geopolitical narrative.
With all this in mind, one should be watching closely for volume confirmation, breakout structure, and any major headlines from the Middle East as the situation develops.
OIL trade ideas

Positive market: OIL rises sharply - Important area to watch forThe recent escalation of tensions in the Middle East has had a strong ripple effect across all commodities market. Just as we observed with Gold, it’s no surprise we’ve seen oil prices climb as well, given this uncertainty.
If you’ve seen my latest Gold analysis, you’ll understand how market sentiment has turned uneasy, and in times like these are what people trust when everything else feels risky. And naturally, with everything going on, Gold is seeing stronger demand again, and I expect the price to steadily climb and reach new highs because the momentum is unmistakable.
On Friday the 13th, oil prices spiked abruptly before pulling back slightly, showing just how sensitive the market is to potential supply disruptions. What’s fueling this rally is obvious, and it’s the fear around supply from such an important oil-producing area. This creates a great opportunity to take a position.
As you can see in my analysis, the price has recently broken above a key resistance zone and may come back for a retest. If this level holds as support, it would really confirm the bullish bias and make the move towards my anticipated target of 77,50 high probability, towards the next resistance zone level at 77,50 and 79,50.
If the price remains over this support zone, my bullish outlook stays the same. But, if it doesn’t hold above this level we could see a slight pullback before another definitve move up.
In such times, it’s important to watch price action closely especially near key technical levels, and let the market show your next move.

6/16/2025 3:33am PST - PreMarket Analysis - ChatGPTCRUDE OIL FUTURES – 15-Min Chart Analysis (June 16, 2025 – 06:23 UTC-4)
Ticker: OIL (MARKETSCOM)
Current Price: ~$70.97
Trend: Short-term bearish correction after major rally
EMA Signals: Bearish pressure building below 21 EMA, 50 EMA, and at 200 EMA support
🔍 Technical Indicator Summary:
1. Moving Averages
EMA 21 = $72.97
EMA 50 = $72.88
EMA 200 = $70.72 (currently holding as dynamic support)
➡️ Price is squeezed just above the 200 EMA while remaining under key short-term EMAs, signaling temporary bearish control but near potential bounce zone.
2. MACD (12,26,9)
Histogram: Weak bearish momentum (slightly below 0)
Signal line below MACD line but flattening
➡️ Signs of bearish momentum exhaustion. Neutral to slight bullish lean if crossover happens.
3. RSI (14)
RSI = 40.65
Signal line = 49.76
➡️ Approaching oversold territory but not deeply enough to be a reversal signal alone. RSI flattening, suggesting possible price compression before decision.
🔒 Key Price Levels
🔻 Support Zones:
$70.70 (EMA 200) — crucial dynamic support
$70.00 – key horizontal and psychological support
$69.17 / $68.98 – deeper structure supports if $70 fails
🔺 Resistance Zones:
$72.15 (near-term resistance)
$73.39 – local structural peak
$73.99 – key double top zone
🎯 Trade Setup (Next 24 Hours)
✅ Scenario 1: Bounce from EMA 200 (Bullish Reversal)
Conditions for entry:
RSI climbs above 45 and MACD bullish crossover confirmed
Price holds $70.70 and reclaims $71.50+ on healthy volume
Entry:
📈 Buy breakout above $71.50 (confirmation above local lower high)
🎯 TP1: $72.20
🎯 TP2: $73.30
🛑 SL: $70.40 (below 200 EMA and recent low)
❌ Scenario 2: Breakdown Below $70.70 (Bearish Continuation)
Conditions:
MACD histogram expands red again
RSI drops under 38
Price closes below $70.70 with increasing volume
Entry:
📉 Short below $70.60
🎯 TP1: $70.00
🎯 TP2: $69.20
🛑 SL: $71.30 (above minor consolidation)
📊 Probability Forecast (Next 24h):
Scenario Probability Rationale
✅ Bullish Reversal 60% - EMA 200 historically strong bounce zone
MACD flattening
Price holding horizontal + dynamic support |
| ❌ Bearish Continuation | 40% | - Price below all short-term EMAs
Macro structure still shows lower highs
Breakdown below 200 EMA could trigger quick selloff to $70 / $69.2 |
🧠 Strategic Insight:
Buyers are defending EMA 200; short-term bears running out of steam.
Wait for RSI & MACD confirmation — price may range 1–3 more candles.
Low-risk long possible if we see price reclaim $71.50 with volume.

OIL for long 1h *The content on this analysis is subject to change at any time without notice, and is provided for the sole purpose of assisting traders to make independent investment decisions.

Israel creates a risk-off environmentThe current geopolitical tensions continue to escalate and this is creating a risk-off environment, forcing investors to worry. Let's dig in.
MARKETSCOM:OIL
TVC:USOIL
Let us know what you think in the comments below.
Thank you.
77.3% of retail investor accounts lose money when trading CFDs with this provider. You should consider whether you understand how CFDs work and whether you can afford to take the high risk of losing your money. Past performance is not necessarily indicative of future results. The value of investments may fall as well as rise and the investor may not get back the amount initially invested. This content is not intended for nor applicable to residents of the UK. Cryptocurrency CFDs and spread bets are restricted in the UK for all retail clients.

Tightening Triangle Signals Major Move Ahead for Crude OilChart Overview (30-Minute Timeframe)
Instrument: Crude Oil Futures (OIL)
Current Price: ~$64.77
Recent Trend: Strong bearish drop followed by consolidation
---
🔺 Key Patterns & Structures Identified
1. Descending Triangle (Current Price Action)
The current price is tightly compressed within a descending triangle, with a horizontal support near $64.70 and a descending trendline from the recent highs.
Bearish bias is typical in this pattern, but a breakout to the upside is possible, especially with bullish volume or news catalysts.
2. Previous Breakdown
A sharp decline occurred from a resistance zone around $78.00 (highlighted in red).
This breakdown was decisive and fast, breaking through former support levels (green zone around $68–$69).
3. Support Zone Holding
The support at ~$64.70 has been tested multiple times but is still holding, suggesting buyer interest at this level.
4. Volume/Volatility Contraction
Price is consolidating in a tight range between ~$64.5 and ~$65.3.
This compression of volatility often precedes a significant breakout or breakdown.
---
🔁 Possible Scenarios
✅ Bullish Breakout
Trigger: Break above the descending trendline (~$65.3–$65.5).
Target: Revisit prior support zone at $68.00, possibly higher.
Confirmation: Strong bullish candle with increased volume.
❌ Bearish Breakdown
Trigger: Break below horizontal support at ~$64.70.
Target: Possible drop toward $62.00–$61.00, depending on momentum.
Confirmation: Strong bearish candle closing below support with high volume.

Crude Oil - Major VolatilityDue to what we are seeing between the US, Israel, and Iran - Oil prices have experienced heightened levels of volatility.
Since September '23, Oil has respected a clear series of lower highs, with each touch of the orange trendline marked by a red X. Every attempt higher has been faded — and nothing's changed yet.
The most recent move started with a bull div at the $55 double bottom — this front-ran the escalation between Israel and Iran, sending price rocketing into $77.
At the highs:
Bear div forms on RSI
RSI rejects clean off 70
Daily candles close below orange trendline
Peace talk headlines emerge
Price drops nearly 17% from the top
Now we’re back inside our white box, a strong demand zone from $64–$67.
Depending on how talks go between these countries will determine the next market stricture to develop for crude oil.
If talks go well we could see a breakdown of the $64 level into the $58-$61 range or if the war starts to escalate we could see this $64 level hold and head back up towards the trendline.

Crude Oil DTF Technical & Fundamental AnalysisCrude Oil DTF Technical & Fundamental Analysis
Oil prices surged by 6–10% within minutes, with Brent and WTI recording the largest daily gains since May 2022. This spike followed Israel's airstrikes on Iran’s nuclear and military facilities, which reportedly killed senior commanders and scientists. Iran, which plays a top oil player and gatekeeper of the Strait of Hormuz—a passageway for nearly 20% of global oil supply—has declared a state of emergency, and any retaliation that threatens tanker movement or damages infrastructure in key Gulf nations (Saudi Arabia, UAE, Iraq) could push oil prices toward $120+/barrel as a risk premium is being priced in.
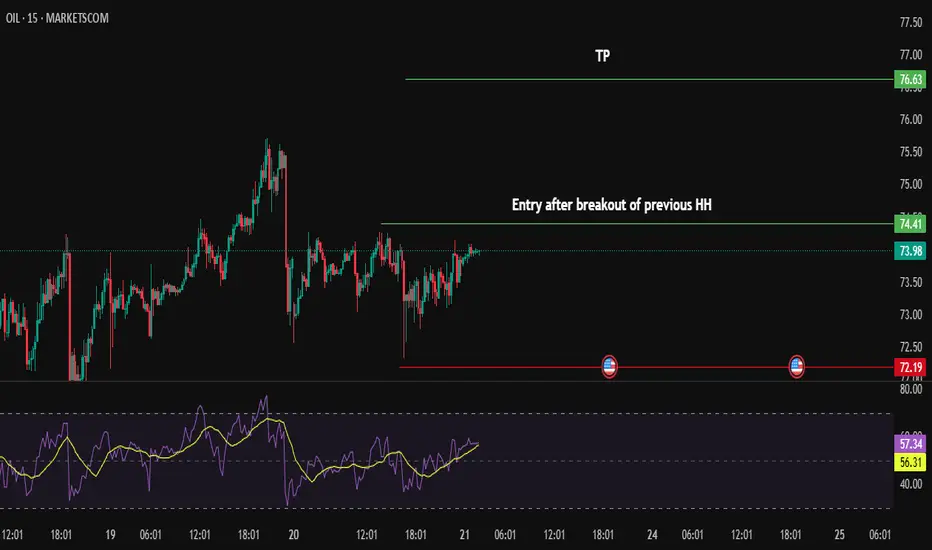
On the technical side (DTF): Price broke the major key support level at 67.00, followed by accumulation and heavy sell positioning. As expected, price hunted for liquidity and triggered sell-side stop losses. However, due to the sudden geopolitical news, price failed to break lower and instead spiked, breaking the next minor resistance level at 72.00, indicating a change of character.
Currently, we are watching for accumulation above the breakout, expecting a liquidity grab below the liquidity zone, then a move up toward distribution. Our area of interest lies at 73.40, after liquidity is formed and a minor key level is broken. Stop loss is set at 68.40 (below liquidity), and take profit at 84.20, the next minor key resistance.
Fundamental Outlook:
Middle East Tensions
-Israel launched airstrikes on Iran targeting nuclear and military sites (Tehran, Natanz, IRGC headquarters).
-Key IRGC generals and nuclear scientists reported killed.
-Iran declared a state of emergency and is expected to retaliate imminently.
Supply Risk – Strait of Hormuz
-Iran controls the Strait of Hormuz, a critical chokepoint for ~20% of global oil supply.
-Any military action or blockades here could immediately tighten global supply and trigger a surge toward $100–$120/barrel.
📌 Disclaimer:
This is not financial advice. Always wait for proper confirmation before executing trades. Manage risk wisely and trade what you see—not what you feel.

WTI oil has approached a key area of resistanceThe technical picture of WTI oil shows that the commodity is now near one of its key downside resistance lines. Could we get a break, or trendline will remain intact?
Let's dig in!
TVC:USOIL
MARKETSCOM:OIL
Let us know what you think in the comments below.
Thank you.
77.3% of retail investor accounts lose money when trading CFDs with this provider. You should consider whether you understand how CFDs work and whether you can afford to take the high risk of losing your money. Past performance is not necessarily indicative of future results. The value of investments may fall as well as rise and the investor may not get back the amount initially invested. This content is not intended for nor applicable to residents of the UK. Cryptocurrency CFDs and spread bets are restricted in the UK for all retail clients.

OIL Trade take long on OIL after the price engages in 4H FVG last Day
Price take PCL of 4H i see luck of creating FVG lower
take long stop loss below the swing low of 15min

What to expect from WTI oil in the near term?We are currently not doing anything with WTI oil, but monitoring it very closely.
Let's dig in!
TVC:USOIL
MARKETSCOM:OIL
Let us know what you think in the comments below.
Thank you.
77.3% of retail investor accounts lose money when trading CFDs with this provider. You should consider whether you understand how CFDs work and whether you can afford to take the high risk of losing your money. Past performance is not necessarily indicative of future results. The value of investments may fall as well as rise and the investor may not get back the amount initially invested. This content is not intended for nor applicable to residents of the UK. Cryptocurrency CFDs and spread bets are restricted in the UK for all retail clients.

Crude Oil Futures: Cup and Handle Pattern 4hCUP FORMATION
Start Date: April 27, 2025, 22:01
Bottom Date: May 4, 2025, 22:01
Bottom Price: $55.34 (exact)
Cup Duration: 15 days
Cup Depth: $8.66
Cup Shape: Rounded, symmetrical U-formation
Right Rim: $64.00 (May 12)
HANDLE FORMATION
Start Date: May 12, 2025, 10:01
Current Price: $61.68
Upper Boundary: Descending trendline from $64.00
Lower Boundary: Descending trendline near $60.40
Handle Depth: ~$3.30 (38% of cup depth)
Current Pattern: Downward-sloping consolidation
PATTERN MEASUREMENTS
Cup Low to Rim: $8.66 ($64.00 - $55.34)
Current Resistance: ~$63.00 (descending trendline)
Target Projection: $71.66 - $72.23 (breakout point + cup depth)
TECHNICAL CHARACTERISTICS
Smooth, rounded bottom (not V-shaped)
Handle forming in upper half of cup (bullish)
Handle depth less than 50% of cup depth (ideal)
Handle showing typical flagging pattern
Clear, well-defined pattern boundaries
The pattern will complete with a breakout above the descending resistance line, currently at approximately $64.00.

Oil expectation. 1HMarket in a bullish trend, breakout from trend line and rejection off support sets it up for strong bullish movement towards destination. Uptrade supported by long trend line towards destination resistance.

TA on WTI Oil - 2025.05.14Quick technical analysis on WTI oil.
Let us know what you think in the comments below.
Thank you.
77.3% of retail investor accounts lose money when trading CFDs with this provider. You should consider whether you understand how CFDs work and whether you can afford to take the high risk of losing your money. Past performance is not necessarily indicative of future results. The value of investments may fall as well as rise and the investor may not get back the amount initially invested. This content is not intended for nor applicable to residents of the UK. Cryptocurrency CFDs and spread bets are restricted in the UK for all retail clients.

OIlA "double bottom buy stop" strategy is a trading approach based on technical analysis. It involves identifying a specific chart pattern known as a "double bottom," which consists of two consecutive troughs at approximately the same price level separated by a peak. The strategy entails placing a buy stop order above the peak that separates the two bottoms. This order is triggered if the price surpasses that level, indicating a potential bullish reversal. Traders often use additional tools and indicators to confirm the pattern and manage risk effectively.

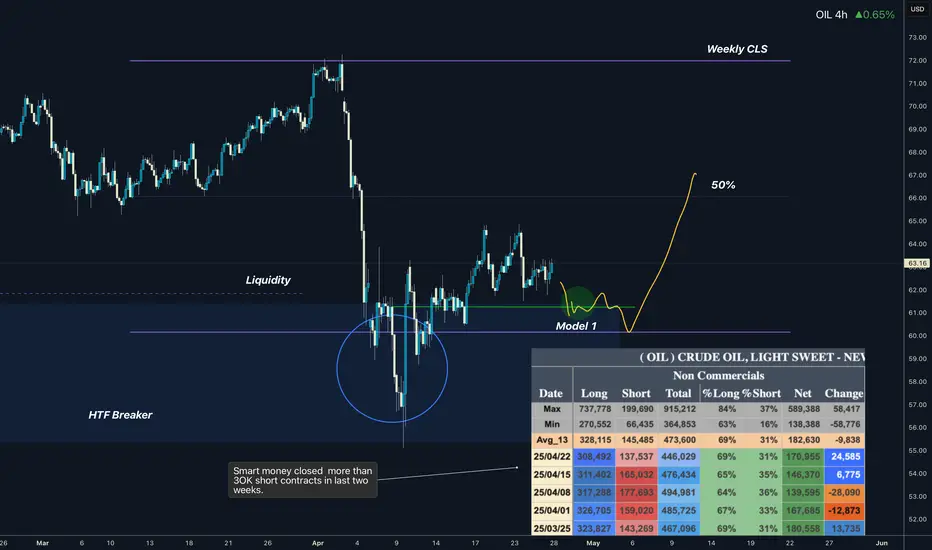
CRUDE OIL I Weekly CLS I KL - Breaker I |Model 1 to 50%Hey, Market Warriors, here is another outlook on this instrument
If you’ve been following me, you already know every setup you see is built around a CLS range, a Key Level, Liquidity and a specific execution model.
If you haven't followed me yet, start now.
My trading system is completely mechanical — designed to remove emotions, opinions, and impulsive decisions. No messy diagonal lines. No random drawings. Just clarity, structure, and execution.
🧩 What is CLS?
CLS is real smart money — the combined power of major investment banks and central banks moving over 7 trillion dollars a day. Understanding their operations is key to markets.
✅ Understanding the behaviour of CLS allows you to position yourself with the giants during the market manipulations — leading to buying lows and selling highs - cleaner entries, clearer exits, and consistent profits.
🛡️ Models 1 and 2:
From my posts, you can learn two core execution models.
They are the backbone of how I trade and how my students are trained.
📍 Model 1
is right after the manipulation of the CLS candle when CIOD occurs, and we are targeting 50% of the CLS range. H4 CLS ranges supported by HTF go straight to the opposing range.
📍 Model 2
occurs in the specific market sequence when CLS smart money needs to re-accumulate more positions, and we are looking to find a key level around 61.8 fib retracement and target the opposing side of the range.
👍 Hit like if you find this analysis helpful, and don't hesitate to comment with your opinions, charts or any questions.
⚔️ Listen Carefully:
Analysis is not trading. Right now, this platform is full of gurus" trying to sell you dreams based on analysis with arrows while they don't even have the skill to trade themselves.
If you’re ever thinking about buying a Trading Course or Signals from anyone. Always demand a verified track record. It takes less than five minutes to connect 3rd third-party verification tool and link to the widget to his signature.
"Adapt what is useful, reject what is useless, and add what is specifically your own."
— David Perk aka Dave FX Hunter ⚔️
OIL – Bearish Setup at FVG + Golden Pocket ConfluenceThis 4H chart of Crude Oil Futures highlights a clean bearish setup forming as price approaches a confluence zone of imbalance and premium pricing. After a sharp downward move, the current rally appears to be a retracement into areas of interest for potential distribution.
---
1. Context & Market Structure:
- The market experienced a significant bearish move, breaking multiple support levels with conviction.
- Price is currently retracing upward, creating the possibility of a lower high in line with bearish market structure.
- The ongoing move looks corrective, setting up a potential return to the dominant trend.
---
2. Fair Value Gaps (FVGs) & Key Supply Zones:
- Two FVGs are identified on the chart — both marked as areas where price moved too quickly, leaving inefficiencies behind.
- The lower FVG overlaps with the 0.618–0.65 Fibonacci golden pocket zone, providing a strong confluence for potential rejection.
- The upper FVG aligns with the 0.786 level, representing deeper premium pricing and added confluence for distribution.
---
3. Fibonacci Confluence Zones:
- 0.618–0.65 zone: Coincides with the lower FVG — this is the first area to watch for rejection.
- 0.786 level: Aligns with the upper FVG, making it an extended zone for bearish entries if price pushes higher.
- These Fibonacci levels serve as key retracement zones within the context of bearish continuation.
---
4. Anticipated Move:
- The red arrow illustrates the projected path: price reaching into the FVG and golden pocket confluence, then rejecting to the downside.
- The inefficiencies above act as supply zones where institutional selling may occur.
- The lower purple level (0.28) is a potential magnet for price if the retracement completes and bearish momentum resumes.
---
5. Trade Idea Narrative:
- This is a classic bearish setup where price retraces into premium and inefficiency zones during a downtrend.
- The ideal reaction would involve a shift in lower timeframe structure once the price hits the golden pocket + FVG zone.
- Patience and confirmation are key — watching for rejection patterns or breakdowns within the FVG before commitment.
---
Summary:
Crude Oil is retracing after a sharp drop and is approaching a high-probability reversal zone, where a Fair Value Gap overlaps with the golden pocket. This setup provides a strong narrative for potential bearish continuation, supported by structure, imbalance, and Fibonacci confluence.

OIL/ BUY 30m chart analysisChart Analysis Summary:
The price is currently around 61.46.
You've marked a demand zone between approximately 60.11 – 60.50, suggesting a strong buy interest in that area.
The chart shows a projected bullish move with a strong red arrow pointing toward 65.00+.
The projection includes a breakout, a possible pullback, then continuation to higher levels.
Trade Setup (Buy Setup):
1. Entry Point:
Look for buy entries in the demand zone, ideally around:
Entry: 60.11 – 60.50
(Wait for bullish confirmation — engulfing candle, bullish divergence, or other signals in that zone.)
2. Stop Loss (SL):
Just below the demand zone:
SL: 59.50
3. Take Profit 1 (TP1):
At the structure or resistance level shown before pullback:
TP1: 63.50
4. Final Target:
As indicated by your arrow projection:
Final TP: 65.50 – 66.00

WTI gets a boost, but is this really enough?We saw yesterday the positive reaction due to the pausing of tariffs. However, because of the economic uncertainties and OPEC+ production increases, the price of TVC:USOIL may see more downside.
Let's dig in.
MARKETSCOM:OIL
Let us know what you think in the comments below.
Thank you.
77.3% of retail investor accounts lose money when trading CFDs with this provider. You should consider whether you understand how CFDs work and whether you can afford to take the high risk of losing your money. Past performance is not necessarily indicative of future results. The value of investments may fall as well as rise and the investor may not get back the amount initially invested. This content is not intended for nor applicable to residents of the UK. Cryptocurrency CFDs and spread bets are restricted in the UK for all retail clients.

Great Depression incomingIt's in the chart
maybe itll go negative again?
But it should halve from here

OIL: Retest and drop or bear trap?MARKETSCOM:OIL
Hello
Looks like this patterns might decide Inflation or deflation.
I would guess deflation based on tariffs, due to the below reasons:
1. People have low purchasing power
2. Job losses
3. High prices due to tariffs.
4. Higher interest rates, so tough market conditions.
Fed should step in very soon to ease the market with interest rate reduction and then start stimulating the economy.
If Fed hands are tied for next few months and tariffs continue, it will be a biggest self inflicted economic tragedy in US and can be seen bad economic state out side of US.
Easy guess:
1. Tariffs are reduced and eventually removed on negotiations.
2. Fed will lower interest rates due to fear of deflationary recession, China is a biggest example.
3. Markets rally till end of the year.
4. Bull cycle comes to an end, starts the bear market in 2026 and 2027.
Hard guess:
1. Tariffs will move manufacturing companies away from US and adjust to the rest of the world.
2. US suffers lack of partners, hard to gain back trust.
3. Dollar will slowly move down.
Recessions and market crashes make millionaires, be always to grab an opportunity.
Happy investing

5 Top Oil and Gas Stocks to InvestThe oil and gas industry remains a powerhouse in the global economy, fueled by steady demand and shifting energy policies. With President Donald Trump’s inauguration in 2025 ushering in a pro-industry administration, the sector is poised for both opportunities and challenges. A relaxed regulatory environment and boosted U.S. liquefied natural gas (LNG) exports-reversed from a prior pause under President Joe Biden-are set to drive growth. However, within the sector, the outlook for gas appears more favorable than for oil. While gas demand is expected to rise, driven by LNG exports and power generation needs, oil faces a prolonged stage where its growth may lag behind inflation, though this could be offset by the profitability of producers. Tariff policies could also spark a global trade war, potentially hiking inflation or tipping economies into recession, impacting oil and gas demand. Despite this volatility, the energy sector leads the S&P 500 in year-to-date performance, making it a compelling space for investors. For those looking to gain exposure to the sector without looking into second-tier companies, the following five stocks stand out as leading options.
1. Exxon Mobil Corp. ( NYSE:XOM )
Dividend Yield: 3.4%
Exxon Mobil, a vertically integrated giant, spans the full oil and gas supply chain-from exploration to refining and retail. Its production has surged, notably doubling in the Permian Basin (the U.S.’s top oil patch) after acquiring Pioneer Natural Resources in 2023. The company also holds a stake in a major U.S. LNG export facility, slated to start operations in 2025. Trading at a discount to the S&P 500 based on enterprise value to EBITDA, Exxon offers a 3.4% dividend yield-well above the index’s average. Beyond fossil fuels, it’s investing in carbon capture, hydrogen, low-emission fuels, and lithium for electric vehicle batteries, positioning it for long-term resilience. However, as a major oil producer, Exxon Mobil may face headwinds if oil prices lag behind inflation, though its diversified operations and cost management could mitigate this risk.
2. Chevron Corp. ( NYSE:CVX )
Dividend Yield: 4.1%
Another supermajor, Chevron mirrors Exxon’s integrated model but stands out for its disciplined approach to capital. With world-class Permian Basin assets and a robust LNG portfolio, it’s well-equipped for volatile gas prices, which have climbed in 2025 due to cold weather and shrinking U.S. and European inventories. Chevron’s 4.1% dividend yield and aggressive share buybacks enhance its appeal. Its focus on cost efficiency and selective investments in lower-carbon solutions further solidify its position as a reliable pick for stability and growth. Nonetheless, Chevron’s significant oil assets expose it to the risk of oil price growth lagging inflation, though its strong balance sheet and efficiency provide a buffer.
3. Occidental Petroleum Corp. ( NYSE:OXY )
Dividend Yield: 1.9%
Occidental Petroleum blends traditional oil production with forward-thinking innovation. Berkshire Hathaway, holding a 28.2% stake as of December 31, 2024, underscores its potential, making it the sixth-largest position in the portfolio, just behind Chevron. The company hit record U.S. production in Q4 2024 and is a leader in carbon capture technology. However, risks linger: a federal court ruling (currently under appeal) has raised its environmental liabilities, and its 1.9% dividend yield is modest compared to peers. Additionally, its focus on oil production means it could be affected if oil prices underperform inflation, though its innovative approaches and cost controls may offer some protection.
4. Phillips 66 ( NYSE:PSX )
Dividend Yield: 3.7%
Spun off from ConocoPhillips in 2012, Phillips 66 thrives in refining, chemicals, and pipelines rather than upstream production. Its infrastructure assets, including a vast pipeline network, promise steady cash flow growth, yet the stock trades at lower multiples typical of refining businesses. With a 3.7% dividend yield and a legacy dating back to 1917, it’s a recognizable name with untapped potential. Some investors see room for value creation if its midstream assets were spun off, though even without that, Phillips 66 remains a strong contender. However, the refining business can be cyclical, and Phillips 66 may face challenges if demand for refined products weakens.
5. EQT Corp. ( NYSE:EQT )
Dividend Yield: 1.2%
EQT, a leading natural gas producer, operates in the Marcellus and Utica shales of the Appalachian Basin. As the U.S.’s largest LNG exporter, it’s primed to capitalize on rising gas prices-up in 2025 amid cold weather and speculation-and growing demand from AI-driven data centers and exports. Forecasts suggest U.S. natural gas demand could surge by double digits through 2030. While its 1.2% dividend yield is lower, EQT’s exposure to these trends makes it a growth-focused pick, though it’s sensitive to commodity price dips tied to global GDP. As a gas-focused company, EQT is well-positioned to benefit from the sector’s stronger gas outlook.
Why These Stocks Stand Out
Oil prices, slipping in 2025 due to high U.S. production and OPEC’s plans to restore output, face counterforces like China’s stimulus boosting demand and potential Iran sanctions tightening supply. Moreover, OPEC is maintaining record spare capacity, and when combined with non-OPEC producers, estimates indicate that global spare production capacities could reach up to 15 million barrels per day within six months, leveraging existing infrastructure. This substantial spare capacity, equivalent to nearly 25% of daily global oil production, could play a pivotal role in market dynamics, potentially stabilizing prices or responding to geopolitical or economic shifts. Gas prices, meanwhile, are expected to stay above historical averages. Global oil inventories sit at low levels, hinting at a possible undersupplied market if dynamics shift. These five companies-Exxon Mobil, Chevron, Occidental, Phillips 66, and EQT-offer a mix of dividends (ranging from 1.2% to 4.1%), innovation, and exposure to both oil and LNG markets. While a recession could dent energy demand, their strategic positioning makes them worth watching in this volatile yet promising sector. If it is stipulated by the strategy, it is better to pay attention to such companies. Investors should note that while gas offers promising growth, oil may face headwinds with prices potentially lagging inflation, though the profitability of producers can help navigate these challenges.
