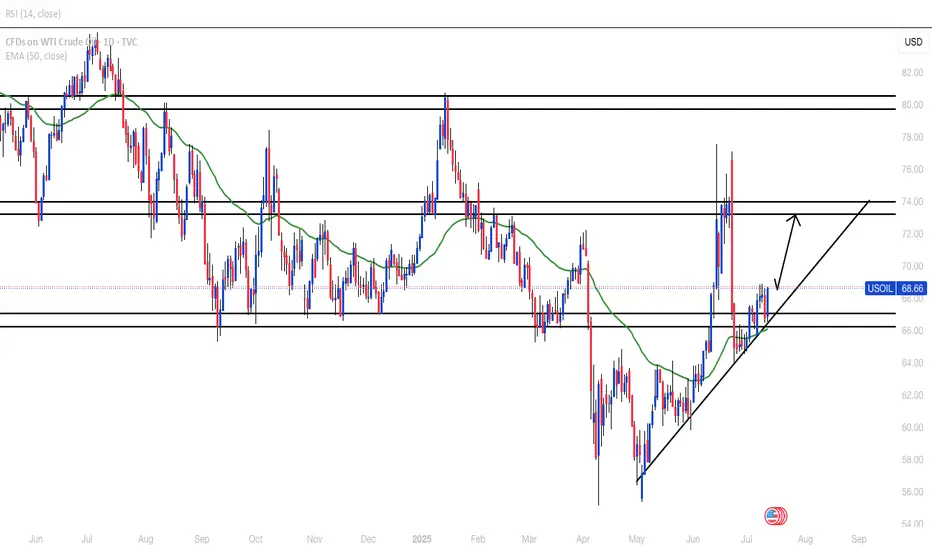
USOILBroke below strong daily support zone for about two months but came back above and looks to have retested the zone properly. Minor H4/H1 resistance around 66.70 that needs to be broken before possibly moving higher.
OILUSD trade ideas
USOIL: Local Bearish Bias! Short!
My dear friends,
Today we will analyse USOIL together☺️
The market is at an inflection zone and price has now reached an area around 68.669 where previous reversals or breakouts have occurred.And a price reaction that we are seeing on multiple timeframes here could signal the next move down so we can enter on confirmation, and target the next key level of 67.925..Stop-loss is recommended beyond the inflection zone.
❤️Sending you lots of Love and Hugs❤️

BRENT CRUDE OIL FORMED A BEARISH WEDGE. ANOTHER POSSIBLE DECLINEBRENT CRUDE OIL FORMED A BEARISH WEDGE. ANOTHER POSSIBLE DECLINE?📉
USOIL has been trading bullish within the last couple of days, supported by prospects of tighter supply and an improved demand outlook. US crude inventories dropped last week, which indicates firm demand despite the rising output.
Still, technically, oil looks bearish. It has formed a bearish wedge and is currently testing the former trendline from below. The most probable scenario is that wee see the bearish impulse towards 6,500.00 with further decline. Another option is that the rise will continue towards 6,900.00 level.

CRUDE OIL BEARISH BREAKOUT|SHORT|
✅CRUDE OIL broke the rising
Support line which is now a resistance
And the price made a retest an a pullback
So we we are bearish biased and we
Will be expecting a further
Bearish move down
SHORT🔥
✅Like and subscribe to never miss a new idea!✅
Disclosure: I am part of Trade Nation's Influencer program and receive a monthly fee for using their TradingView charts in my analysis.

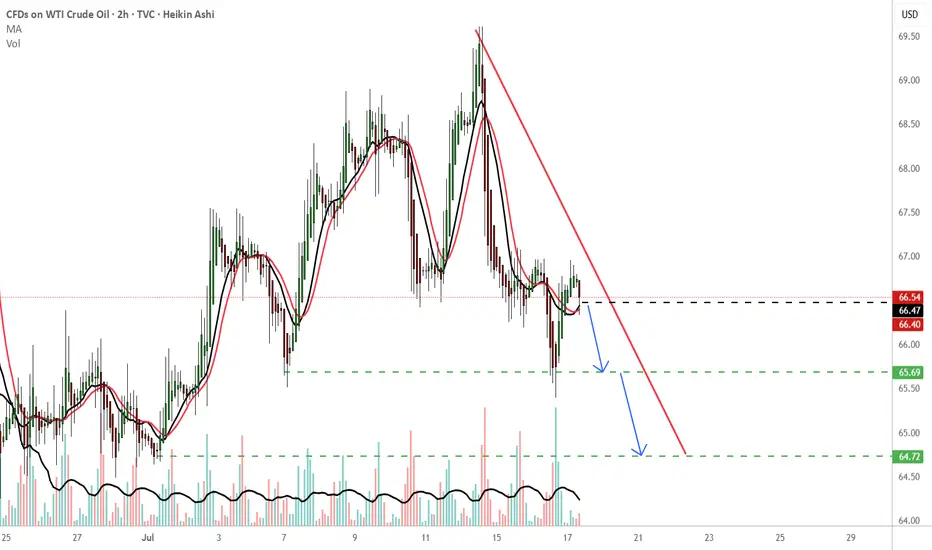
USOILShort short short !!!
-65.69 TP
-64.72 TP2
As long as it's bearish and doesn't close above the red line, assume bearish. The green dotted lines also can suggest demand zones which could suggest a change in direction (bullish soldiers) will enter the battlefield. Trade with focus and follow your trading plan.
THOUGHTS???????
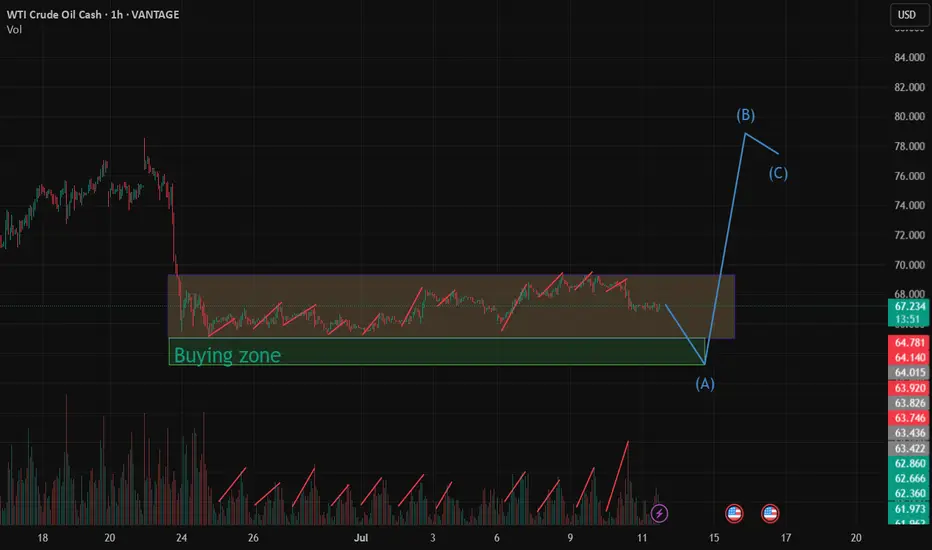
Does someone knows something that we don't?It seems to me we are getting in an accumulation phase on oil. Is there another war rally on the horizon or something else!? They can manipulate price but they can't manipulate volume that easily. Notice that every time price rises, volume rises with it and when price falls, volume decreases with it. My bet would be buying bellow the last lows, where a sea of stop loss rests, before ripping up the page.
Falling towards pullback support?WTI Oil (XTI/USD) is falling towards the pivot and could bounce to the 1st resistance.
Pivot: 63.73
1st Support: 56.03
1st Resistance: 71.20
Risk Warning:
Trading Forex and CFDs carries a high level of risk to your capital and you should only trade with money you can afford to lose. Trading Forex and CFDs may not be suitable for all investors, so please ensure that you fully understand the risks involved and seek independent advice if necessary.
Disclaimer:
The above opinions given constitute general market commentary, and do not constitute the opinion or advice of IC Markets or any form of personal or investment advice.
Any opinions, news, research, analyses, prices, other information, or links to third-party sites contained on this website are provided on an "as-is" basis, are intended only to be informative, is not an advice nor a recommendation, nor research, or a record of our trading prices, or an offer of, or solicitation for a transaction in any financial instrument and thus should not be treated as such. The information provided does not involve any specific investment objectives, financial situation and needs of any specific person who may receive it. Please be aware, that past performance is not a reliable indicator of future performance and/or results. Past Performance or Forward-looking scenarios based upon the reasonable beliefs of the third-party provider are not a guarantee of future performance. Actual results may differ materially from those anticipated in forward-looking or past performance statements. IC Markets makes no representation or warranty and assumes no liability as to the accuracy or completeness of the information provided, nor any loss arising from any investment based on a recommendation, forecast or any information supplied by any third-party.

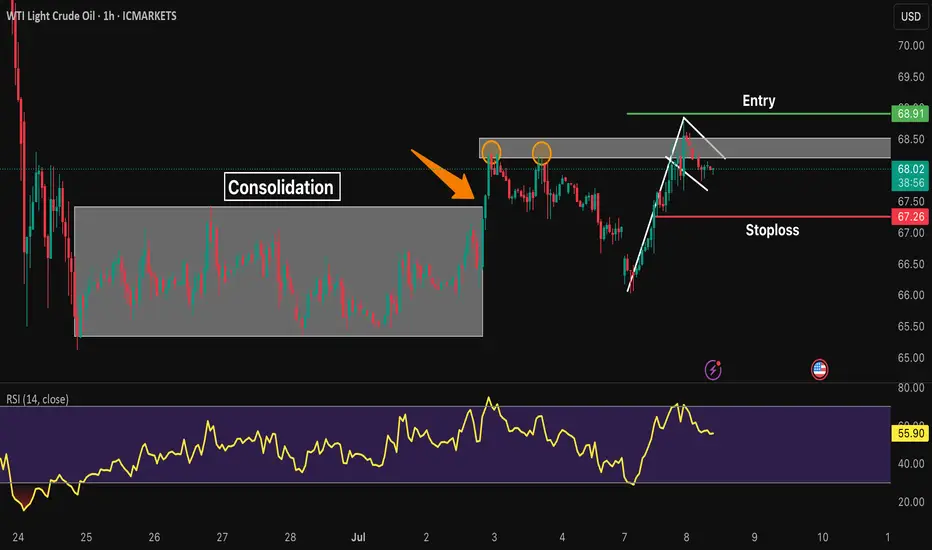
XTIUSD* Bullish Trend after consolidation box break.
* Bullish flag pattern is formed.
* Entry will be taken at the break of the pole.
* Stoploss is below the last HL.
Strong USOIL Setup: Long from Support + 4.34 R/RHey Guys, hope you're all doing well!
I've placed a limit buy order on USOIL from a key support level. Below are the relevant levels for your reference:
- 🔵 Entry Level: 67.424
- 🔴 Stop Loss: 66.803
- 🟢 Target 1 (TP1): 67.908
- 🟢 Target 2 (TP2): 68.456
- 🟢 Target 3 (TP3): 70.036
📊 Risk/Reward Ratio: 4.34
Your likes and support are what keep me motivated to share these analyses consistently.
Huge thanks to everyone who shows love and appreciation! 🙏

WTI OIL Best scalping opportunity at the moment!WTI Oil (USOIL) has been consolidating inside a ranged trading set-up, with the 4H MA100 (green trend-line) as its Resistance and the 4H MA200 (orange trend-line) as its Support.
We saw this previously from May 13 to June 01 and it presents the best scaling opportunity in the market at the moment. That previous Ranged Trading pattern eventually broke upwards as the Higher Lows trend-line held.
As a result, after you get your scalping profits within this range, look for a clear break-out above the 4H MA100 (candle closing) in order to go long (Resistance 1) or a break-out below the Higher Lows (candle closing) in order to go short (Support 1).
-------------------------------------------------------------------------------
** Please LIKE 👍, FOLLOW ✅, SHARE 🙌 and COMMENT ✍ if you enjoy this idea! Also share your ideas and charts in the comments section below! This is best way to keep it relevant, support us, keep the content here free and allow the idea to reach as many people as possible. **
-------------------------------------------------------------------------------
Disclosure: I am part of Trade Nation's Influencer program and receive a monthly fee for using their TradingView charts in my analysis.
💸💸💸💸💸💸
👇 👇 👇 👇 👇 👇

CRUDE OIL (WTI): Will It Rise More?
Quick update for my yesterday's analysis for WTI Crude Oil.
As I predicted yesterday, the price went up to the target.
We got one more strong bullish confirmation after a New York
session opening:
the price violated a resistance of a horizontal range on a 4H time frame.
I think that the market may rise even more and reach 69.25 level.
❤️Please, support my work with like, thank you!❤️

Bearish reversal off 38.2% Fibonacci resistance?WTI Oil (XTI/USD) is rising towards the pivot and could reverse to the 1st support which is a pullback support.
Pivot: 70.08
1st Support: 65.56
1st Resistance: 73.54
Risk Warning:
Trading Forex and CFDs carries a high level of risk to your capital and you should only trade with money you can afford to lose. Trading Forex and CFDs may not be suitable for all investors, so please ensure that you fully understand the risks involved and seek independent advice if necessary.
Disclaimer:
The above opinions given constitute general market commentary, and do not constitute the opinion or advice of IC Markets or any form of personal or investment advice.
Any opinions, news, research, analyses, prices, other information, or links to third-party sites contained on this website are provided on an "as-is" basis, are intended only to be informative, is not an advice nor a recommendation, nor research, or a record of our trading prices, or an offer of, or solicitation for a transaction in any financial instrument and thus should not be treated as such. The information provided does not involve any specific investment objectives, financial situation and needs of any specific person who may receive it. Please be aware, that past performance is not a reliable indicator of future performance and/or results. Past Performance or Forward-looking scenarios based upon the reasonable beliefs of the third-party provider are not a guarantee of future performance. Actual results may differ materially from those anticipated in forward-looking or past performance statements. IC Markets makes no representation or warranty and assumes no liability as to the accuracy or completeness of the information provided, nor any loss arising from any investment based on a recommendation, forecast or any information supplied by any third-party.

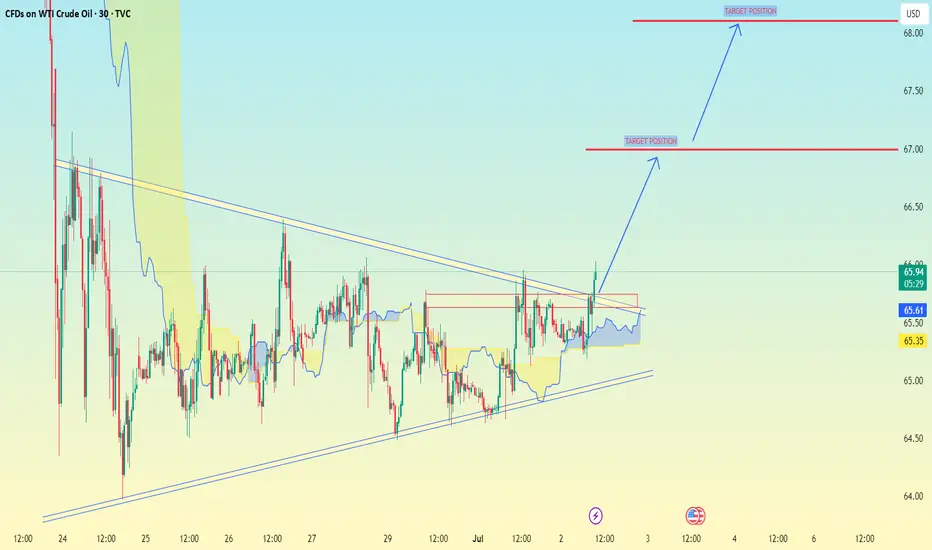
(WTI Crude Oil) on the 30-minute timeframe:(WTI Crude Oil) on the 30-minute timeframe:
You have a clear triangle breakout happening.
The chart shows two bullish target positions marked with blue arrows.
Based on your chart:
Current Price Zone: Around 66.20 - 66.25
Target Levels:
✅ First Target: 67.00
✅ Second Target: 68.00 - 68.10
---
Summary Trading Idea:
Breakout above resistance trendline confirmed.
First resistance and partial target at 67.00
Final target near 68.00 - 68.10, where the next significant resistance lies.
Let me know if you want stop-loss suggestions or a detailed entry strategy.
USOIL: Historic Full CyclesResearch Notes
Documenting historic examples of fractal loops for future references and research.
Fractal full cycles
70's; 80's; 90's
Late 90's & Early 00's
00's
10's
10's & 20's

USOIL long WTI crude oil is approaching strong support around $71, with oversold technicals and stabilizing demand outlook. Geopolitical tensions in the Middle East and potential U.S.–Iran friction may limit downside. A long position targets a rebound from this key level.
Elliot...

Crude oil under pressure after OPEC+WTI Crude oil had rejected the 20-moving average area, having reversed off the $68 price area after the OPEC+ announcement about the upcoming production increase. The short-term energy outlook forecast from eia.org had lowered the expected fair price for CL futures based on supply and demand estimation for 2025 - the average price is projected around $60 with a possibility to drive lower.
COT reports show the increasing short position for commercial traders, which had almost reached the new bottom - a potential short signal for the oil.
Given the weak sentiment (we’ve seen the massive drop of oil futures after the resolution of Israel-Iran situation) and overall downtrend, we can project the downside move as shown at the chart.
Don't forget - this is just the idea, always do your own reserch and never forget to manage your risk!

WTI Oil Heist: Bullish Breakout Plan for Big Gains!🚨 Ultimate WTI Oil Heist Plan: Bullish Breakout Strategy for Big Profits! 🚀💰
🌟 Hello, Wealth Chasers & Market Mavericks! 🌟
Hola, Bonjour, Hallo, Marhaba! 🗺️
Get ready to execute the Ultimate WTI / US Oil Spot Heist using our 🔥 Thief Trading Style 🔥, blending sharp technicals with powerful fundamentals! 📈💡 This swing trade plan targets the energy market’s bullish potential, but stay sharp—volatility lurks! 🚨 Follow the chart setup for a long entry, and let’s aim for those juicy profits while dodging the high-risk ATR zone where the market “police” might trap overzealous traders. 🏦⚠️
📊 The Heist Plan: WTI / US Oil Spot (Swing Trade)
Entry 📈:
The breakout is your signal! 🎯 Wait for the Moving Average crossover and a confirmed pullback at $68.00 on the 2H timeframe. Once it triggers, go long and ride the bullish wave! 🐂 Set an alert to catch the breakout in real-time. 🚨
Stop Loss 🛑:
Protect your capital like a pro! 💪 Place your stop loss below the recent swing low at $65.00 (2H timeframe, candle body wick). Adjust based on your risk tolerance, lot size, and number of positions. Rebels, beware—straying too far from this level could burn you! 🔥
Target 🎯:
Aim for $73.80 or exit early if momentum fades. Scalpers, stick to long-side trades and use a trailing stop to lock in gains. 💰 Swing traders, follow the plan and secure profits before the market consolidates or reverses. 🏴☠️
📊 Market Context & Key Drivers
The WTI / US Oil Spot market is currently consolidating with a bullish bias 🐂, driven by:
Fundamentals: Check macroeconomic data, seasonal trends, and intermarket correlations. 📉
COT Report: shows net-long positions increasing, signaling bullish sentiment. 📅
Sentiment & Quantitative Analysis: Market mood leans positive, but overbought risks loom near the ATR zone. ⚠️
Stay informed! 📰 Monitor news releases, as they can spike volatility. Avoid new trades during major announcements and use trailing stops to protect open positions. 🔒
📊 Pro Tips for the Heist
Scalpers: Go long with tight trailing stops to safeguard profits. 💸
Swing Traders: Stick to the plan, adjust stops based on risk, and exit before the high-risk ATR zone ($73.80+). 🚪
Risk Management: Never risk more than you can afford. Tailor your lot size and stop loss to your account size. 🛡️
Stay Updated: Market conditions shift fast—keep an eye on fundamentals and sentiment to stay ahead. 👀
📊 Why Join the Heist?
This Thief Trading Style plan is your ticket to navigating the WTI market with confidence! 💪 Boost this idea to strengthen our trading crew and share the wealth-making vibe. 🚀💥 Like, follow, and stay tuned for more high-octane strategies! 🤑🐱👤
Disclaimer: This is a general market analysis, not personalized investment advice. Always conduct your own research and consider your risk tolerance before trading. Markets are dynamic—stay vigilant and adapt to new developments. 📡
Let’s make this heist legendary! 🌟💰 See you at the next breakout! 🤝🎉

USOIL BEST PLACE TO SELL FROM|SHORT
USOIL SIGNAL
Trade Direction: short
Entry Level: 68.26
Target Level: 63.78
Stop Loss: 71.23
RISK PROFILE
Risk level: medium
Suggested risk: 1%
Timeframe: 9h
Disclosure: I am part of Trade Nation's Influencer program and receive a monthly fee for using their TradingView charts in my analysis.
✅LIKE AND COMMENT MY IDEAS✅

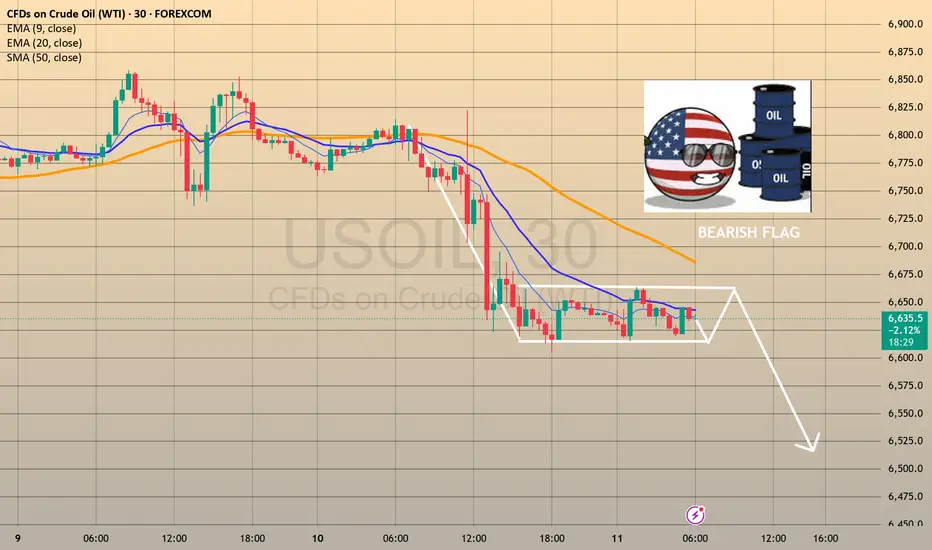
TRADING IDEA - US CRUDE OIL - BEARISH FLAG, CONCERNS ON GLOBAL EFOREXCOM:USOIL
The US Crude Oil prices went down yesterday, mostly because of the tariffs and concerns on demand.
Here is what the Bloomberg is writing: " OPEC+ is discussing a pause in its oil production increases from October is fueling concerns about a slowdown in global energy demand. In addition, the intensification of US tariffs risks slowing global economic growth and energy demand after President Trump ramped up tariffs on numerous countries this week, including a 50% tariff on Brazil."
So, despite the pause in oil production increase, which is supposed to be bullish factor the oil prices, we may see the slowdown in global economy and supposedly a recession because of Trump's tariffs. This is a long-term bearish factor for the oil. I think that we will see another bearish impulse here, according to what we observe on the chart.
There is a nice bearish flag and i am planning to short it with a target nearby 6,540.00 support level.
🔽 a pending sell stop order at 6615.3 with
❌a stop loss at 6680.9 and
🤑a take profit at 6544.0
Trade cautiously! Preserve your deposits!
US OIL LONG POSITION After the very strong dump in Oil from the major resistance Trendline and zone, but also held and showed signs of rejection from the DTF Support.
I decided to open a Long Position and it's still running, so we'll see how long it can run.

WTI Crude Oil volatility spikeWTI prices ticked higher as renewed Houthi attacks in the Red Sea raised supply and shipping risk concerns.
A drone and speedboat strike on a Greek-operated vessel killed four crew members, marking the second attack in a day and signaling a fresh escalation after a temporary Middle East truce.
The Red Sea remains a critical route for crude flows, and heightened tensions could support oil prices due to potential disruptions.
However, US inventory data is a key counterweight:
The API reported a surprise 7.1 million barrel build in crude stockpiles last week (vs. expected 2.8M draw).
This adds to an 11 million barrel increase in inventories year-to-date, which could limit upside momentum in WTI.
Traders now await the official EIA report later today, which could confirm or challenge API’s bearish signal.
Trading Implications:
Geopolitical premium is re-entering the market—bullish for WTI in the short term.
Inventory build limits gains—if confirmed by EIA, could lead to price pullbacks.
Key levels and positioning will hinge on EIA stock data and any further escalation in shipping threats.
Bias:
Short-term: Bullish with upside risk from Red Sea conflict
Medium-term: Capped by high U.S. stock levels unless demand outlook improves
Key Support and Resistance Levels
Resistance Level 1: 7120
Resistance Level 2: 7260
Resistance Level 3: 7375
Support Level 1: 6650
Support Level 2: 6460
Support Level 3: 6290
This communication is for informational purposes only and should not be viewed as any form of recommendation as to a particular course of action or as investment advice. It is not intended as an offer or solicitation for the purchase or sale of any financial instrument or as an official confirmation of any transaction. Opinions, estimates and assumptions expressed herein are made as of the date of this communication and are subject to change without notice. This communication has been prepared based upon information, including market prices, data and other information, believed to be reliable; however, Trade Nation does not warrant its completeness or accuracy. All market prices and market data contained in or attached to this communication are indicative and subject to change without notice.

Crude oil shock trend direction
💡Message Strategy
During the European trading session on Monday, the West Texas Intermediate (WTI) crude oil futures on the New York Mercantile Exchange recovered the previous losses and rebounded to around $67.50 per barrel. Although OPEC+ confirmed that the increase in oil production in August will be higher than expected, oil prices still rebounded.
From the daily chart level, the medium-term trend of crude oil fluctuated upward and tested around 78. The K-line closed with a large real negative line, which has not yet destroyed the moving average system and is still supported. The medium-term objective upward trend remains unchanged. However, from the perspective of momentum, the MACD indicator crosses downward above the zero axis, indicating that the bullish momentum is weakening. It is expected that the medium-term trend of crude oil will fall into a high-level oscillating upward pattern.
📊Technical aspects
The short-term (1H) trend of crude oil failed to continue to hit a new low and showed a rebound rhythm. The oil price crossed the moving average system, and the short-term objective trend entered a transition period. From the perspective of momentum, the MACD indicator crossed the zero axis, and the red column indicated that the bullish momentum was sufficient. At present, the price is running in a wide range, with a range of 65.50-67.80. It is expected that the trend of crude oil will repeatedly test the upper edge of the range within the range.
💰Strategy Package
Long Position:67.00-67.50,SL:65.50,Target:70.00

WTI USOIL WTI oil Prices are supported by supply cuts and production adjustments but tempered by inventory levels and economic concerns.
The market remains sensitive to geopolitical developments, OPEC+ policies, and US economic data.
#oil
