USOIL MARKERT ANALYSIS AND PRICE PREDICTIONUSOIL, is currently consolidating at the over sold position, the decision will favor the Bulls, The Bulls will drive the price up to the Bearish Institutional Renegotiation Zone at 79% Premium price of 69.15. There USOIL will consolidate again and drop down in price as the Bear will take over again. Lets go long with them. Entry is now,
Take profit and Stop loss Are clearly Stated on the chat.
GOOD LUCK GUYS!
OILUSD trade ideas

WTI Oil Inverse Head & Shoulders looking for a 4H MA50 break-outWTI Oil (USOIL) has formed an Inverse Head and Shoulders (IH&S) pattern, which is a technical bottom formation that signals the trend change to bullish.
So far the move is limited by the 4H MA50 (blue trend-line) which has 2 rejections already and is keeping the bullish break-out from happening.
If the market closes a candle above the 4H MA50, we will have a bullish confirmation signal. Our Target will be the 1.618 Fibonacci extension at $69.00 and not higher, because the long-term trend is limited by the wider Lower Highs trend-line of January.
-------------------------------------------------------------------------------
** Please LIKE 👍, FOLLOW ✅, SHARE 🙌 and COMMENT ✍ if you enjoy this idea! Also share your ideas and charts in the comments section below! This is best way to keep it relevant, support us, keep the content here free and allow the idea to reach as many people as possible. **
-------------------------------------------------------------------------------
Disclosure: I am part of Trade Nation's Influencer program and receive a monthly fee for using their TradingView charts in my analysis.
💸💸💸💸💸💸
👇 👇 👇 👇 👇 👇

WTI CRUDE OIL: Channel Down bottomed. Buy opportunity.WTI Crude Oil is heavily bearish on its 1D technical outlook (RSI = 38.039, MACD = -2.310, ADX = 38.046) as it is trading inside a Channel Down for more than 1 year. Last week's low has made a technical LL at the bottom of the pattern and the current consolidation indicates that this may be an attempt to initiate the new bullish wave. The 1D RSI recovered from being oversold previously and this potentially hints to a rebound over the 1D MA200. The last bullish wave crossed above the 0.618 Fibonacci marginally. Trade: long, TP = 71.00.
## If you like our free content follow our profile to get more daily ideas. ##
## Comments and likes are greatly appreciated. ##

Choose to go short at high levels for crude oilThe price of crude oil is still fluctuating within a range and lacks clear directional momentum. The outlook remains bearish until it breaks through the $63.70 mark or there are clear factors stimulating demand. In the short term, the trend of oil prices is likely to remain confined to the current range. In terms of trading suggestions, it is advisable to mainly go short and go long as a supplement.
Oil trading strategy:
sell @ 61.90-62.10
sl 62.80
tp 61.20-61.00
If you approve of my analysis, you can give it a thumbs-up as support. If you have different opinions, you can leave your thoughts in the comments.


USOIL(UPDATE)Hello friends
Given the recent price growth, you can see that the price has weakened and has caused lower ceilings and floors to form. Now the range to which we expect the price to fall has been determined, which is also an FVG gap.
*Trade safely with us*

XTI/USD - Potential TargetDear Fellow Traders,
How I see it:
If OIL structure holds - "Inverse H&S"
Buyers will fill Imbalance area indicated
or
Target = Trend Resistance
Feel free to ask if anything is unclear.
Thank you for taking the time to study my analysis.

WTIMaybe we are going to see a correctio on oil, at this stage of market it's really hard to say anything, volatility is crazy, news changing in a minute. This is only a possible idea

Crude Oil Holds Rebound Above $55Crude oil's sharp rebound from the $55 support—aligned with the 0.618 Fibonacci retracement of the 2020–2022 uptrend—faced immediate resistance at the long-standing support-turned-resistance zone around $63.80, established in 2021.
A decisive move above $63.80 may clear the way for further gains toward $66, $68, $69.60, and ultimately $73. On the downside, a drop below $58 would bring $55 back into focus.
A clean break below that level could trigger further downside toward $49 per barrel, which aligns with the lower boundary of crude oil's long-term uptrend.
With global powers competing for oil, key events this week include:
🔹 OPEC report amid tariffs and efforts to regain market share
🔹 US–China trade talks
🔹 Chinese GDP, IP, Retail Sales (Wed)
Written by Razan Hilal, CMT

US OilCrude Oil
- Completed " 12345 " Impulsive Waves
- Break of Structure
- RSI - Divergence
- Exp Fiat as an corrective pattern in Short Time Frame
- Order Block

WTI, Inverted Head and ShoulderInverted head and shoulder
Bullish Divergence
Buy on breakout and closing above 62.5
sl below right shoulder
Take profit on Resistance zone

USOIL Chart Overview:
WTI Crude is trading around 61.44, consolidating inside a key resistance zone near62.00. After a strong bullish impulse, price has stalled under this resistance, forming both bullish and bearish paths, highlighting a conflicting market structure
Key Discrepations Identified:
1. Bullish Momentum vs. Resistance Reaction
- Expected: Continuation to 64+ after breakout.
- Reality: Price is struggling below resistance, rejecting upper boundary multiple times.
- Discrepation: Bullish momentum is slowing, and repeated rejections are exposing potential reversal pressure.
2. Volume Strength vs. Breakout Potential
- Volume d…
- Visually this implies strength, but price is hovering in indecision, neither breaking up nor down convincingly.
- Discrepation: Chart setup shows both bullish continuation and bearish breakdown possibilities, confusing structure
4. Double Scenario Projection
- The projection shows both:
- A bullish breakout to 64.
- A rejection and selloff to 58.
- Discrepation: Market is giving mixed technical signals, suggesting traders should wait for confirmation before committing
Discrepation Summary Table:
| Element | Expectation | Observed Reality | Discrepation | Projection Conflict | Clear trend continuation | Dual projection shown | Market indecision + low conviction |
📉 Conclusion:
While WTI remains inside a short-term bullish structure, the presence of conflicting breakout signals, resistance rejections, and declining volume point toward a discrepation. Traders should watch the 62.00 resistance zone closely. A clear rejection or breakout will resolve this divergence, with downside targeting 58.00, and upside toward $64.00.
Let me know if you'd like a summarized version for a caption or post!

USOIL D1 I Falling from the 61.8% Based on the D1 chart, the price is approaching our sell entry level at 65.24, a pullback resistance that aligns with the 61.8 Fibo retracement.
Our take profit is set at 58.08, a swing low support.
The stop loss is set at 70.39, a pullbac resistance.
High Risk Investment Warning
Trading Forex/CFDs on margin carries a high level of risk and may not be suitable for all investors. Leverage can work against you.
Stratos Markets Limited (tradu.com):
CFDs are complex instruments and come with a high risk of losing money rapidly due to leverage. 63% of retail investor accounts lose money when trading CFDs with this provider. You should consider whether you understand how CFDs work and whether you can afford to take the high risk of losing your money.
Stratos Europe Ltd (tradu.com):
CFDs are complex instruments and come with a high risk of losing money rapidly due to leverage. 63% of retail investor accounts lose money when trading CFDs with this provider. You should consider whether you understand how CFDs work and whether you can afford to take the high risk of losing your money.
Stratos Global LLC (tradu.com):
Losses can exceed deposits.
Please be advised that the information presented on TradingView is provided to Tradu (‘Company’, ‘we’) by a third-party provider (‘TFA Global Pte Ltd’). Please be reminded that you are solely responsible for the trading decisions on your account. There is a very high degree of risk involved in trading. Any information and/or content is intended entirely for research, educational and informational purposes only and does not constitute investment or consultation advice or investment strategy. The information is not tailored to the investment needs of any specific person and therefore does not involve a consideration of any of the investment objectives, financial situation or needs of any viewer that may receive it. Kindly also note that past performance is not a reliable indicator of future results. Actual results may differ materially from those anticipated in forward-looking or past performance statements. We assume no liability as to the accuracy or completeness of any of the information and/or content provided herein and the Company cannot be held responsible for any omission, mistake nor for any loss or damage including without limitation to any loss of profit which may arise from reliance on any information supplied by TFA Global Pte Ltd.
The speaker(s) is neither an employee, agent nor representative of Tradu and is therefore acting independently. The opinions given are their own, constitute general market commentary, and do not constitute the opinion or advice of Tradu or any form of personal or investment advice. Tradu neither endorses nor guarantees offerings of third-party speakers, nor is Tradu responsible for the content, veracity or opinions of third-party speakers, presenters or participants.

WTI Oil D1 | Approaching a swing-high resistanceWTI oil (USOIL) could rise towards a swing-high resistance and potentially reverse off this level to drop lower.
Sell entry is at 62.71 which is a swing-high resistance.
Stop loss is at 66.00 which is a level that sits above the 61.8% Fibonacci retracement and a pullback resistance.
Take profit is at 58.18 which is a swing-low support.
High Risk Investment Warning
Trading Forex/CFDs on margin carries a high level of risk and may not be suitable for all investors. Leverage can work against you.
Stratos Markets Limited (tradu.com):
CFDs are complex instruments and come with a high risk of losing money rapidly due to leverage. 63% of retail investor accounts lose money when trading CFDs with this provider. You should consider whether you understand how CFDs work and whether you can afford to take the high risk of losing your money.
Stratos Europe Ltd (tradu.com):
CFDs are complex instruments and come with a high risk of losing money rapidly due to leverage. 63% of retail investor accounts lose money when trading CFDs with this provider. You should consider whether you understand how CFDs work and whether you can afford to take the high risk of losing your money.
Stratos Global LLC (tradu.com):
Losses can exceed deposits.
Please be advised that the information presented on TradingView is provided to Tradu (‘Company’, ‘we’) by a third-party provider (‘TFA Global Pte Ltd’). Please be reminded that you are solely responsible for the trading decisions on your account. There is a very high degree of risk involved in trading. Any information and/or content is intended entirely for research, educational and informational purposes only and does not constitute investment or consultation advice or investment strategy. The information is not tailored to the investment needs of any specific person and therefore does not involve a consideration of any of the investment objectives, financial situation or needs of any viewer that may receive it. Kindly also note that past performance is not a reliable indicator of future results. Actual results may differ materially from those anticipated in forward-looking or past performance statements. We assume no liability as to the accuracy or completeness of any of the information and/or content provided herein and the Company cannot be held responsible for any omission, mistake nor for any loss or damage including without limitation to any loss of profit which may arise from reliance on any information supplied by TFA Global Pte Ltd.
The speaker(s) is neither an employee, agent nor representative of Tradu and is therefore acting independently. The opinions given are their own, constitute general market commentary, and do not constitute the opinion or advice of Tradu or any form of personal or investment advice. Tradu neither endorses nor guarantees offerings of third-party speakers, nor is Tradu responsible for the content, veracity or opinions of third-party speakers, presenters or participants.


Heading into 61.8% Fibonacci resistance?WTI Oil (XTI/USD) is rising towards the pivot which has been identified as a pullback resistance and could reveres to the 1st support which is a pullback support.
Pivot: 65.90
1st Support: 54.96
1st Resistance: 71.31
Risk Warning:
Trading Forex and CFDs carries a high level of risk to your capital and you should only trade with money you can afford to lose. Trading Forex and CFDs may not be suitable for all investors, so please ensure that you fully understand the risks involved and seek independent advice if necessary.
Disclaimer:
The above opinions given constitute general market commentary, and do not constitute the opinion or advice of IC Markets or any form of personal or investment advice.
Any opinions, news, research, analyses, prices, other information, or links to third-party sites contained on this website are provided on an "as-is" basis, are intended only to be informative, is not an advice nor a recommendation, nor research, or a record of our trading prices, or an offer of, or solicitation for a transaction in any financial instrument and thus should not be treated as such. The information provided does not involve any specific investment objectives, financial situation and needs of any specific person who may receive it. Please be aware, that past performance is not a reliable indicator of future performance and/or results. Past Performance or Forward-looking scenarios based upon the reasonable beliefs of the third-party provider are not a guarantee of future performance. Actual results may differ materially from those anticipated in forward-looking or past performance statements. IC Markets makes no representation or warranty and assumes no liability as to the accuracy or completeness of the information provided, nor any loss arising from any investment based on a recommendation, forecast or any information supplied by any third-party.

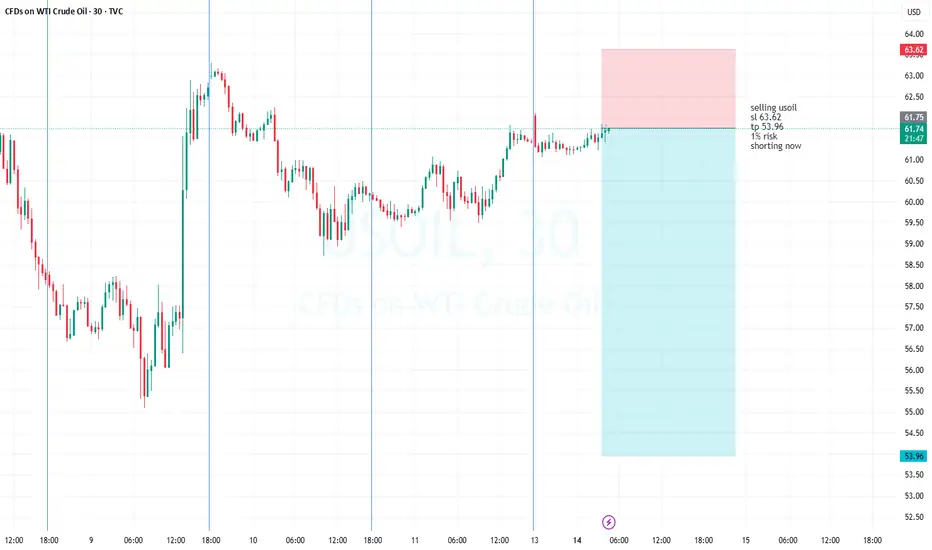
usoilselling usoil 61.21
sl 63.62
tp 53.96
driill baby drill
shorting now
1% risk each setup
like an follow , helps the page thanks

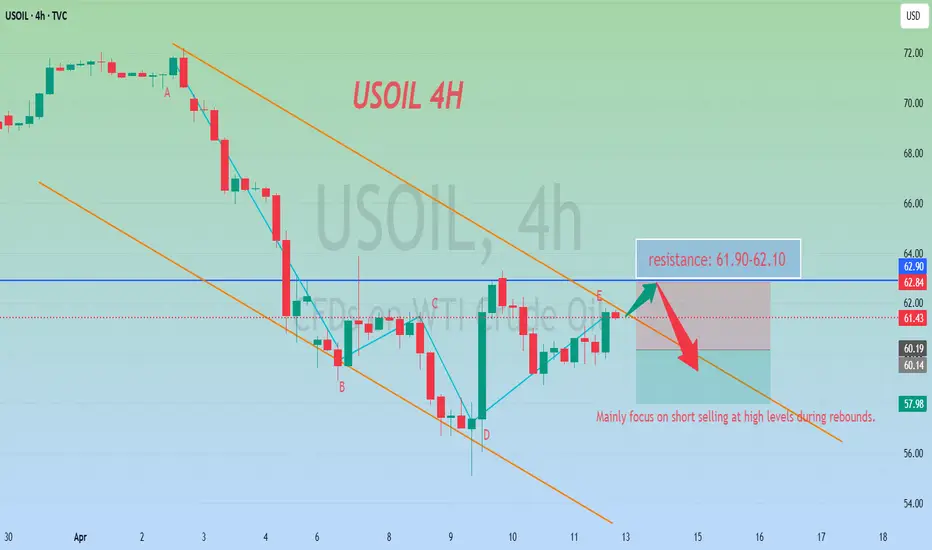
Strategic Analysis of Crude Oil for Next WeekBehind the current fluctuations in international oil prices lies the market's deep anxiety over the extreme uncertainty of global trade policies. Trump's "suspension + escalation" approach has, in the short term, stabilized relations with non - Chinese economies, but it has also dealt a blow to the global supply chain and energy consumption confidence.
In terms of the trading ideas for crude oil next week, it is recommended to mainly go short at high levels during rebounds and go long at low levels during pullbacks as a supplement. In the short term, pay attention to the resistance level in the range of 62.8 - 63.2. In the short term, focus on the support level in the range of 60.5 - 59.5.
Oil trading strategy:
sell @ 61.90-62.10
sl 62.80
tp 61.70-61.40
If you approve of my analysis, you can give it a thumbs-up as support. If you have different opinions, you can leave your thoughts in the comments.Thank you!
USOIL may continue to decline due to tariffsRestricted Economic Growth : The United States imposes tariffs, and other countries take countermeasures, intensifying global trade frictions and greatly increasing the risk of economic recession. NIESR predicts that if Trump imposes a 10% tariff on the world and a 60% tariff on China, the global GDP will shrink by 2% and the trade volume will decrease by 6% within five years 😕. The weak economy causes the demand for crude oil in various industries to decline, leading to a drop in the price of USOIL 📉.
Changes in Crude Oil Supply and Demand :
Demand Side: China imposes tariffs on U.S. crude oil, raising the import cost and reducing the import volume. The United States imposes tariffs on energy imports from Canada and Mexico, affecting the crude oil exports of these two countries to the U.S., reducing the demand for crude oil in the United States and putting pressure on the price of USOIL 😟.
Supply Side: After China reduces its imports of U.S. crude oil, it increases imports from other exporting countries, changing the global crude oil supply pattern and possibly strengthening the expectation of a supply surplus. The decrease in U.S. crude oil exports may lead to an increase in domestic inventory, exerting downward pressure on the price of USOIL 😣.
Influenced Market Sentiment :
The uncertainty of tariff policies and the escalation of trade frictions trigger market panic and speculation, intensifying the volatility of the crude oil market. Investors, being pessimistic, sell futures contracts, further driving down the price of USOIL 😨.
This upward movement has led to the clearing of many traders' accounts or significant losses 😫. You can follow my signals and gradually recover your losses and achieve profitability 🌟.
💰💰💰 USOIL💰💰💰
🎯 Sell@61.0 - 61.5
🎯 TP 59.0 - 58.0
Traders, if you're fond of this perspective or have your own insights regarding it, feel free to share in the comments. I'm really looking forward to reading your thoughts! 🤗

WTI Crude Oil Bearish Reversal Setup – Short from Resistance ZonEntry Point: 62.66 USD
Stop Loss: 65.26 USD
Target Point (Take Profit): 55.09 USD
Indicators:
EMA 200 (blue): 60.92 USD — long-term trend indicator
EMA 30 (red): 60.75 USD — short-term trend indicator
Analysis:
1. Bearish Setup:
The price is approaching a key resistance zone marked by the purple shaded area near 62.66.
The strategy is to short from this level, anticipating a drop to the 55.09 target area.
2. Risk/Reward:
Risk (SL - Entry): 65.26 - 62.66 = 2.60 USD
Reward (Entry - TP): 62.66 - 55.09 = 7.57 USD
Risk-to-reward ratio: ~1:2.9, which is favorable.
3. Support/Resistance Confirmation:
Multiple touches at the resistance zone (or

USOILUSOIL short term downside and then we will see some reaction below 60.
Disclosure: We are part of Trade Nation's Influencer program and receive a monthly fee for using their TradingView charts in our analysis.

USOIL BULLISH BIAS RIGHT NOW| LONG
USOIL SIGNAL
Trade Direction: long
Entry Level: 61.45
Target Level: 73.89
Stop Loss: 53.11
RISK PROFILE
Risk level: medium
Suggested risk: 1%
Timeframe: 1D
Disclosure: I am part of Trade Nation's Influencer program and receive a monthly fee for using their TradingView charts in my analysis.
✅LIKE AND COMMENT MY IDEAS✅
