USOIL: Bullish Correction Ahead! Buy!
USOIL
- Classic bullish correction formation
- Our team expects growth
SUGGESTED TRADE:
Swing Trade
Buy USOIL
Entry Level - 65.16
Sl - 62.68
Tp - 68.86
Our Risk - 1%
Start protection of your profits from lower levels
Disclosure: I am part of Trade Nation's Influencer program and receive a monthly fee for using their TradingView charts in my analysis.
❤️ Please, support our work with like & comment! ❤️
OIL_CRUDE trade ideas

Crude Oil Gets Trapped Back Inside 3-Year Down trending ChannelAfter failing to close above the upper border and the 78 resistance level, and amid renewed hopes for a Middle East ceasefire, oil prices dropped sharply back toward the neckline of the inverted head and shoulders formation—initially broken ahead of the recent war escalation—at 64.70.
A sustained move below that neckline could target crude prices toward the mid-zone of the established channel, near 63.40 and 61.40, where another rebound may take shape.
On the upside, if a clear recovery re-emerges above the 72-mark, the potential for a breakout above the 78-resistance could return, opening the door to revisit the 80 and 83.50 highs.
— Razan Hilal, CMT

The latest layout for crude oil today.With geopolitical risks gradually easing, oil prices have deviated significantly from macroeconomic and fundamental guidance. While Iran's situation has shown signs of mitigation, the single-day decline in oil prices was excessive. We believe current oil prices have reached a reasonable range: short positions can still be held, but chasing further shorting is no longer advisable.
On the daily chart, crude oil formed a large bearish candlestick with both no upper and lower shadows, directly breaking below support and continuing to decline. After breaking above the previous high, the breakdown of support indicates that oil prices are falling back again to seek a new trading range. Today, the focus remains on the sustainability of the bearish momentum.
you are currently struggling with losses,or are unsure which of the numerous trading strategies to follow,You have the option to join our VIP program. I will assist you and provide you with accurate trading signals, enabling you to navigate the financial markets with greater confidence and potentially achieve optimal trading results.
Trading Strategy:
sell@68.5-69.0
TP:64.5-64.0

WTI Oil: further downside?Front page news this morning focussed on the ceasefire between Israel and Iran, first announced by US President Donald Trump on his Truth Social platform. However, reports recently emerged of Iran firing missiles, seemingly violating the ceasefire, but no confirmation has been received yet. The point is that things remain somewhat uncertain as of writing.
The technical front, nevertheless, is interesting on WTI Oil (West Texas Intermediate), and ultimately points to a moderate pullback before heading lower.
Monthly descending triangle in play
The flow on the monthly chart reveals that price action completed a descending triangle in April this year, formed between US$95.00 and US$64.41. Following the breach of the lower boundary and refreshing year-to-date (YTD) lows of US$55.15, a determined pullback materialised and resulted in the unit testing the upper barrier of the pattern. As you can see, the test has held for now, with June poised to end the month considerably off its best levels.
Given that price has aggressively rejected the upper boundary of the triangle formation, and if we see WTI push to fresh YTD lows, this would unearth a possible bearish scenario in the direction of support from US$42.57.
Daily Fibonacci resistance
Across the page on the daily chart, you will note that recent flow touched gloves with support at US$64.55, a level complemented by a 1.272% Fibonacci projection ratio at US$64.76, a trendline support (extended from the low of US$55.40), and a neighbouring 61.8% Fibonacci retracement level at US$63.70. Given that the 1.272% Fibonacci projection ratio also represents an ‘alternate’ AB=CD support pattern, traders that are long from US$64.55 may aim for the 38.2% and 61.8% Fibonacci retracement ratios of US$69.53 and US$72.59. Consequently, both of these lines serve as potential resistance levels to watch.
H1 confluence
With monthly price suggesting further selling, and daily resistance on the table, the H1 chart shines the spotlight on two levels of resistance at US$68.35 and US$70.14. However, I am more drawn to the latter level as a potential resistance. This is because it converges closely with the 38.2% Fibonacci retracement ratio on the daily timeframe mentioned above at US$69.53, as well as a nearby 1.618% Fibonacci projection ratio on the H1 chart at US$69.13.
As a result, my focus will be on H1 resistance between US$70.14 and US$69.13.
Written by FP Markets Chief Market Analyst Aaron Hill

Oil prices could rise due to high geopolitical uncertaintiesOil prices could rise due to high geopolitical uncertainties
The price of OIL has been waiting all these days with hopes for negotiations between Iran and Israel.
Currently, diplomacy is dead, so for now, the market has to absorb the news that the US has attacked Iran.
The price of oil is normal to rise and it is also very risky because it reacts quickly and does not keep the bullish momentum.
The price may rise as I showed in the chart, but the risk remains high.
Please be careful.
You may find more details in the chart!
Thank you and Good Luck!
❤️PS: Please support with a like or comment if you find this analysis useful for your trading day❤️

USOILUSOIL will be bullish this week due to geopolitics and especially Iran/Israel War and Hormuz Strait closure.
Disclosure: We are part of Trade Nation's Influencer program and receive a monthly fee for using their TradingView charts in our analysis.

USOIL The Target Is UP! BUY!
My dear friends,
USOIL looks like it will make a good move, and here are the details:
The market is trading on 65.03 pivot level.
Bias - Bullish
Technical Indicators: Supper Trend generates a clear long) signal while Pivot Point HL is currently determining the overall Bullish trend of the market.
Goal - 68.89
Recommended Stop Loss - 63.01
About Used Indicators:
Pivot points are a great way to identify areas of support and resistance, but they work best when combined with other kinds of technical analysis
Disclosure: I am part of Trade Nation's Influencer program and receive a monthly fee for using their TradingView charts in my analysis.
———————————
WISH YOU ALL LUCK

Crude oil continues to correct, short-term ideas
💡Message Strategy
WTI crude oil prices recovered from a two-week low but remained about $12 below the previous Monday's high as upside was limited by Middle East peace and expectations that OPEC+ countries will agree to increase supply again this week.
📊Technical aspects
From the daily chart level, crude oil fluctuates upward in the medium term and tests around 75. The K-line closes with a large real negative line, which has not yet destroyed the moving average system and is still supported. The medium-term objective upward trend remains unchanged.
However, from the perspective of momentum, the MACD indicator crosses downward above the zero axis, indicating that the bullish momentum is weakening. It is expected that the medium-term trend of crude oil will fall into a high-level oscillation pattern.
The short-term trend of crude oil (1H) continues to fluctuate in a narrow range, and the oil price falls back to the lower edge of the range. Pay attention to the support strength of 64. In terms of momentum, the MACD indicator is at the zero axis position, and the long and short forces are equal. It is expected that the trend of crude oil will maintain a fluctuating consolidation pattern during the day.
💰Strategy Package
Short Position:65.50-66.50,SL:67.50,Target: 64.00-63.00
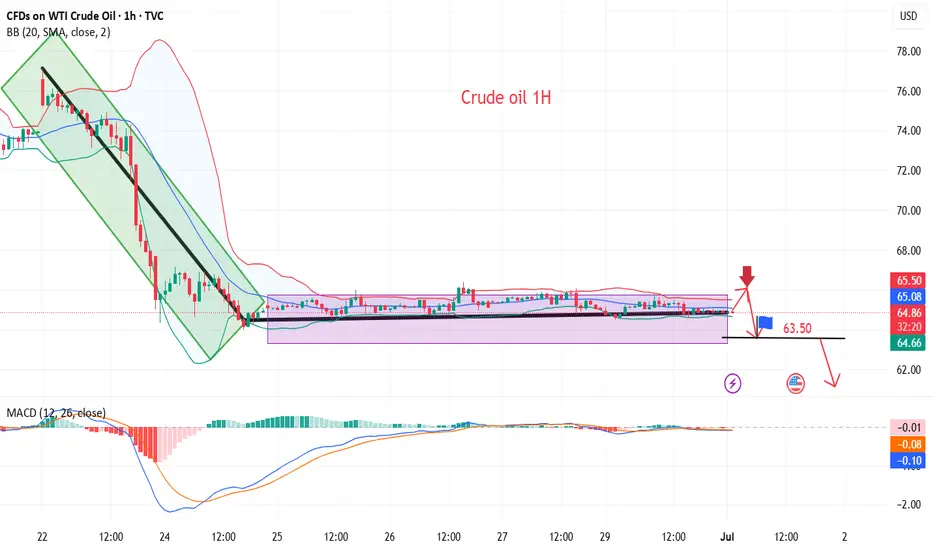
Market next move 🔄 Disruption Analysis: Contrarian View
⚠️ Original Viewpoint Summary:
The original analysis suggests a bearish breakdown from the rising channel, with a short-term target of 64.36, pointing to a move towards the support zone.
---
📉 Disrupted (Contrarian) Perspective:
🔁 Fakeout Scenario Possibility:
The sharp drop below the trendline may be a bear trap.
Price quickly bounced back into the channel region, showing buyer interest near the support.
🔎 Key Observations:
Wick rejection near the lower support suggests that demand is active around 64.50–64.36 zone.
The structure of higher lows is still valid unless there's a confirmed close below the support box.
Momentum indicators (not shown) may help validate whether this is a temporary pullback or a deeper correction.
📈 Alternative Projection:
If price holds above the support zone, it could rebound back to test 65.50–65.80 resistance.
A false breakdown followed by consolidation may lead to retest of the upper channel (near 66.00).
---
🧭 Revised Strategy Suggestion:
Avoid early shorts unless there is a confirmed candle close below 64.36.
Watch for bullish price action near support (hammer, engulfing) for a potential long re-entry.
Reevaluate if WTI forms a base around 64.40 — possible reversal setup.

BUY OPPORTUNITY IN WTI NOW!Price dropped low and currently trade at $65.15 per barrel a buy opportunity is envisaged from the current market price. This is a potential opportunity to capitalize on. Take advantage of it

Crude Oil Trades in Range with Bullish PotentialCrude Oil trades above key support at $64.6, hovering near $66.83. If buyers maintain control, the next upside target is $69.45.
However, a bearish breakdown below $62.42 would invalidate this bullish outlook.

Here is the latest analysis of the crude oil market trendOn Wednesday, international oil prices stabilized and rebounded after two consecutive days of correction, as the market reassessed the short-term easing of the Middle East situation and changes in crude oil supply. Brent crude oil futures rose by $0.75, or 1.1%, to $67.89 per barrel; WTI crude oil rose by $0.71 to $65.08. Previously, U.S. air strikes damaged key Iranian facilities. Although they did not completely destroy its capabilities, they triggered short-term market concerns about supply chain disruptions.
When geopolitical tensions temporarily eased, the market also turned its attention to inventory data. The latest data from the American Petroleum Institute (API) showed that for the week ending June 20, U.S. crude oil inventories fell by 4.23 million barrels, far exceeding the market expectation of a 2.5 million barrel decline, indicating that refinery demand remained strong. Under the dual effect of the mitigation of geopolitical risks and the bullish API inventory data, oil prices showed signs of stabilization, but the foundation for the rise was still fragile.
In the next few trading days, the safety of the Strait of Hormuz and the EIA official inventory report will become the key to whether the bulls can continue. In the current volatile pattern, it is necessary to remain cautious and pay close attention to changes in the technical support area and U.S. policy dynamics.
However, in terms of momentum, the MACD indicator has formed a bearish crossover below the zero axis, signaling a weakening of bullish momentum. This suggests that the medium-term trend of crude oil is likely to fall into a high-level consolidation pattern.
you are currently struggling with losses,or are unsure which of the numerous trading strategies to follow,You have the option to join our VIP program. I will assist you and provide you with accurate trading signals, enabling you to navigate the financial markets with greater confidence and potentially achieve optimal trading results.
Trading Strategy:
sell@67.0-68.0
TP:63.0-64.0

Could the Crude Oil reverse from here?The price is falling towards the support level which is a pullback support that is slightly above the 61.8% Fibonacci retracement and could bounce from this level to our take profit.
Entry: 66.77
Why we like it:
There is a pullback support level that is slightly above the 61.8% Fibonacci retracement.
Stop loss: 61.06
Why we like it:
There is a pullback support level that aligns with the 78.6% Fibonacci retracement.
Take profit: 72.33
Why we like it:
There a pullback resistance level that lines up with the 50% Fibonacci retracement.
Enjoying your TradingView experience? Review us!

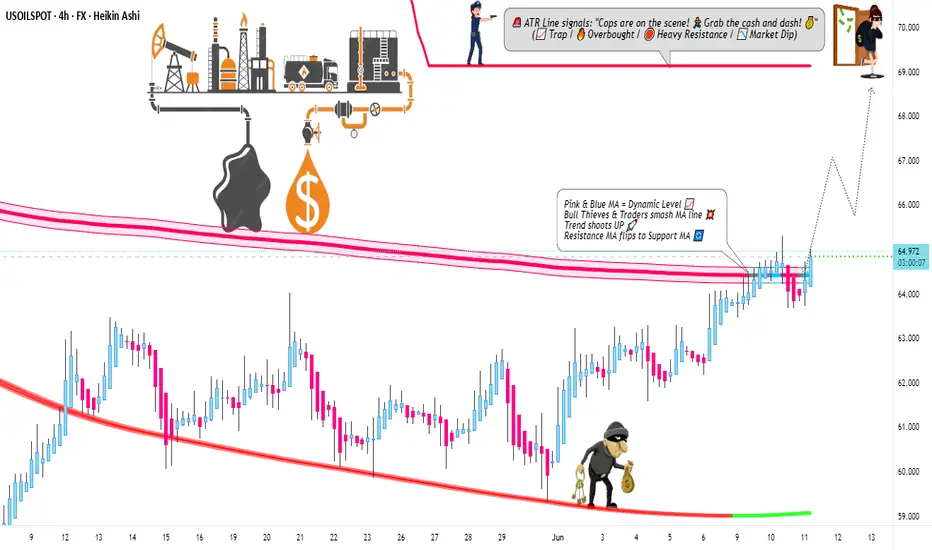
Bulls on the Loose: US Oil Spot/WTI Heist Strategy! 🚨💰 THE OIL VAULT HEIST: US OIL SPOT/WTI TRADING STRATEGY 💸🔫
🌟Hi! Hola! Ola! Bonjour! Hallo! Marhaba!🌟
Dear Money Makers & Robbers 🤑💰💸✈️
Based on our 🔥Thief Trading style analysis🔥 (both technical and fundamental), here’s the master plan to heist the US Oil Spot/WTI Energy Market. Follow the blueprint carefully—this strategy focuses on long entries, with a daring escape planned near the high-risk Red ATR line Zone where bearish robbers and consolidation traps await. 🏆💸 Take your profit and treat yourself, fellow traders—you earned it! 💪🏆🎉
🕵️♂️ Entry 📈
💥 The vault is wide open! Time to swipe that bullish loot—heist is on!
Place buy limit orders within the 15 or 30-minute timeframe, near swing lows/highs for pullback entries.
🛑 Stop Loss 🛑
📍 Thief’s SL—recent swing low and below the moving average (4H timeframe) for day/swing trades.
📍 Adjust SL based on risk, lot size, and number of orders.
🎯 Target
🏴☠️💥 69.000 (Aim for the big loot!) OR escape before the target
🔥 Market Heist Overview
The UK Oil Spot/Brent market is currently showing bullishness 🐂, driven by key factors—perfect for a day/scalping trade robbery! ☝☝☝
📰 Additional Tools & Analysis
📊 Get the Fundamental, Macro, COT Report, Quantitative Analysis, Sentiment Outlook, Intermarket Analysis, Future Targets—check our bi0 liinks 👉👉👉🔗🔗
⚠️ Trading Alert: News Releases & Position Management
📰 News can rattle the vault! 💥
✅ Avoid new trades during news releases.
✅ Use trailing stop-loss orders to protect profits.
💖 Supporting our heist plan?
💥 Smash the Boost Button 💥 to empower the robbery team.
Let’s make money every day in this market with the Thief Trading Style! 🏆💪🤝❤️🎉🚀
👀 Stay tuned for the next robbery plan, thieves! 🤑🐱👤🤗🤩
OIL IDEA /30 06 25So we are looking for this Short position, but first we need a better Premium position

WTI OIL TRADING IDEA 1 JULY 2025WTI Crude Oil is currently trading around $64.77, following a recent rejection from the $76–78 resistance zone. This area represents a strong supply zone and coincides with the upper boundary of a long-term descending channel, indicating institutional selling pressure. From a Smart Money Concepts (SMC) perspective, this move appears to be a liquidity grab above previous highs, where price tapped into a bearish order block before aggressively reversing. Price action confirms this bearish sentiment, with a visible rejection and bearish engulfing candle suggesting that sellers are defending the region aggressively.
On the supply and demand side, the $76.77–78.30 zone is the immediate supply zone, while the next key resistance above lies between $79.37 and $93.94. On the downside, demand lies at $58.69–64.00, with major demand and liquidity resting around $55.00 and $51.79. Fundamentally, the recent spike in oil prices was largely driven by heightened tensions in the Middle East, particularly renewed conflict concerns between Iran and Israel. However, as no direct disruption to oil supply has occurred, the geopolitical risk premium is now being priced out. Additionally, concerns over global demand, especially from China and Europe, along with a gradual and controlled U.S. Strategic Petroleum Reserve (SPR) refill, are putting downward pressure on prices despite OPEC+ maintaining output cuts.
Based on this analysis, the trade idea favors a bearish swing setup. A short position around $64.00–66.00 could be considered, targeting $58.69 as the first take-profit level, followed by $55.00 and $51.79 for extended targets. The stop loss should be placed just above $78.50 to allow room beyond the supply zone and trendline. This setup offers a risk-reward ratio of approximately 1:3. However, if price breaks and holds above $78.50, it may signal a structural shift toward bullish momentum, likely driven by unexpected geopolitical escalation or a change in OPEC strategy. In such a case, the bias should flip to bullish, with potential targets around $89.00–93.00.

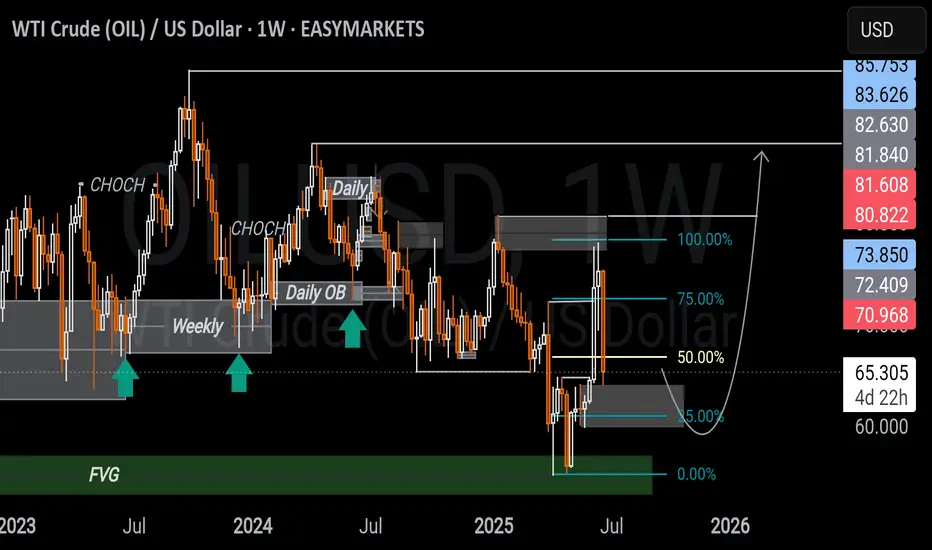
WTI CRUDE OIL USD WEEKLY ANALYSIS Price is reacting from a weekly FVG just below the 50% of a larger range, with some bullish momentum possibly fueled by recent geopolitical tensions.
But price is still within a bearish range acting as resistance, so upside may remain limited unless structure shifts.
A daily bullish OB below the 50% of that range could offer a solid pullback entry if price retraces which is aligning with the broader narrative and upside liquidity. Im having a neutral view of this and leveraging on both sides.
What are your thoughts?
USOIL Buy- Go for buy if entry setup given
- Refine entry with smaller SL for better RR, if your strategy allow
A Message To Traders:
I’ll be sharing high-quality trade setups for a period time. No bullshit, no fluff, no complicated nonsense — just real, actionable forecast the algorithm is executing. If you’re struggling with trading and desperate for better results, follow my posts closely.
Check out my previously posted setups and forecasts — you’ll be amazed by the high accuracy of the results.
"I Found the Code. I Trust the Algo. Believe Me, That’s It."

Crude Oil Eyes 3-Year Channel BreakoutCrude Oil trades between Israel-Iran-Conflict supply risks, overbought momentum, and the potential for a 3-year channel breakout.
While upside risks from a possible Strait of Hormuz closure remain uncertain, a firm hold above $78 could extend gains toward $80 and $83.50, keeping oil on a bullish edge for H2 2025.
A pullback into the channel may ease inflation concerns and reassert bearish pressure below the $80 mark. Key support lies at $72 for a potential downside resumption.
- Razan Hilal, CMT

WTI Crude Oil (USOIL) Technical Analysis: Bullish Reversal FacesOf course. Here is a detailed analysis of the provided financial chart for USOIL (WTI Crude Oil).
### Executive Summary
This is a **weekly (1W) Heikin Ashi chart** for CFDs on WTI Crude Oil (USOIL). The chart displays a long-term view, with a prominent downtrend from a peak in 2022. However, there has been a very strong bullish reversal in the most recent weeks. The analysis points to a critical juncture where the price is testing a key long-term resistance level. The bullish momentum is strong, but it faces significant hurdles ahead.
### Detailed Breakdown
#### 1. Asset and Chart Type
* **Asset:** USOIL (WTI Crude Oil), traded as a Contract for Difference (CFD).
* **Timeframe:** 1W (Weekly). Each candle represents one week of price action. This chart is used for analyzing long-term trends.
* **Chart Type:** Heikin Ashi. Unlike standard candlesticks, Heikin Ashi candles are calculated using averages, which smooths out price action and makes trends easier to identify. Long green candles with no lower wicks indicate strong buying pressure, while long red candles with no upper wicks indicate strong selling pressure.
#### 2. Current Price Action
* The last visible candle is a **strong green Heikin Ashi candle**, indicating significant bullish momentum during that week.
* The data for this candle shows: **Open 69.22, High 77.10, Low 69.22, Close 75.41**. This represents a gain of **+4.19%** for the week.
* The price has bounced sharply from a recent low and is now in its third consecutive week of gains.
#### 3. Key Technical Indicators
**a) Fibonacci Retracement:**
* This tool is drawn from a significant low (marked as 1 at **$68.01**) to a major high (marked as 0 at **$123.24**). It's used to identify potential support and resistance levels.
* The price has been trading between the 0.618 and 1 levels for a prolonged period.
* The recent low was found just below the `1` level ($68.01), indicating a potential double-bottom or failure to break lower.
* The price has since reclaimed the `0.786` level ($79.83) and is currently trading around the **$75.41** mark. The next major resistance levels based on this tool are:
* **0.786:** $79.83
* **0.618:** $89.11
* **0.5:** $95.63
**b) Moving Average (MA):**
* A **50-period Moving Average (MA 50)** is present on the chart (the blue line), with a current value of **69.89**.
* On a weekly chart, the 50-week MA is a critical long-term trend indicator.
* The price has been consistently below the 50-week MA since late 2022, confirming the long-term bearish trend.
* **Crucially, the current price is attempting to break above this moving average.** A sustained close above the 50-week MA would be a strong bullish signal. Conversely, if this level acts as resistance and the price is rejected, it could signal a continuation of the downtrend.
**c) Relative Strength Index (RSI):**
* The RSI (14) is shown at the bottom. The purple line (RSI) is currently at **63.33** and its moving average (yellow line) is at **41.95**.
* The RSI is pointing upwards and has decisively crossed above its moving average, indicating **building bullish momentum**.
* It is not yet in the "overbought" territory (typically above 70), which suggests there could be more room for the price to move higher before becoming extended.
**d) Fibonacci Time Zones:**
* The vertical blue lines numbered 0, 1, 2, 3, 5, 8 are Fibonacci Time Zones. They are used to forecast potential turning points in the market based on time intervals.
* The recent major low occurred very close to the "8" time zone marker, which may have contributed to the timing of this reversal.
### Synthesis and Potential Scenarios
* **Bullish Scenario:** The combination of strong green Heikin Ashi candles, a rising RSI, and a bounce from a key long-term low points to strong short-term bullish momentum. If the price can decisively break and hold above the **50-week MA (around $70)** and the **Fibonacci 0.786 level ($79.83)**, the next major target would be the **0.618 level at $89.11**.
* **Bearish Scenario:** The long-term trend remains bearish as long as the price is below the 50-week MA. This level, combined with the psychological resistance at $80, could prove to be a formidable barrier. If the price fails to break through, it could be rejected back down to test recent lows around the **$68.00** area.
In conclusion, the chart shows a classic battle between short-term bullish momentum and a long-term bearish trend. The price's interaction with the **50-week moving average** in the coming weeks will be critical in determining the next major directional move for WTI Crude Oil.

#USOIL - CUT n REVERSE region, still holds??#USOIL.. well guys in first go market perfectly holds our region then again n again..
Now again. Market is in our resistance region and if market hold again then again drop expected.
But
Keep in mind that above that region new will go for cut n reverse on confirmation .
Good luck
Trade wisely

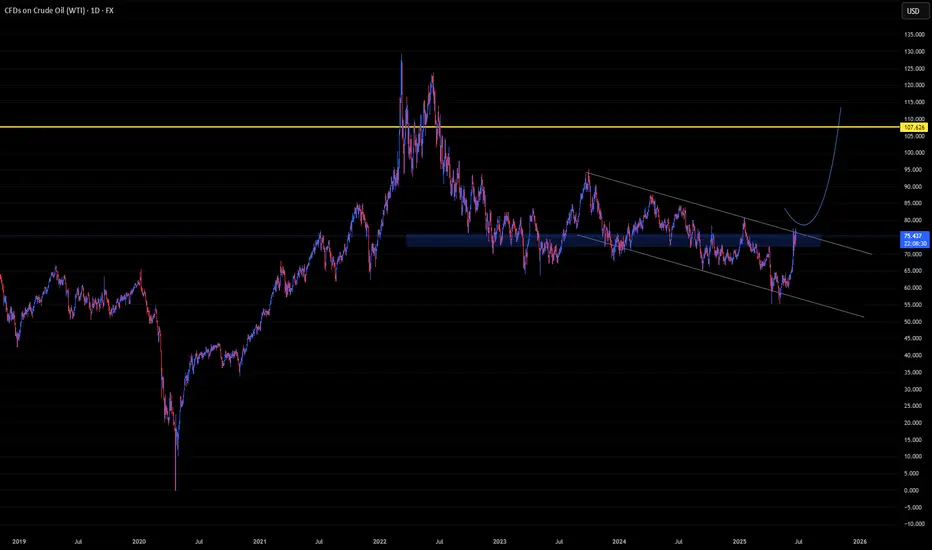
U-oyela Ongahluziwe Nenkunzi.Considering the current countries in conflict - FX:USOIL is in the middle of it. This will lead in a high demand but low supply of the commodity resulting in a soaring bullish move, fundamentally. Technically, the commodity has created a LL in the current year, tapping lows last touched since 2021 and has further recovered from last years close of 71.899.
FX:USOIL reaching highs of $110.00 is therefore likely.
***The best way to take advantage of this commodity or any other is to cherry pick stocks that are sensitive to it e.g. JSE:SOL is sensitive to FX:USOIL .***
Potential 3000+pips on XXXUSD PairsGBPUSD
We anticipate a potential bullish move towards the 1.3540 region, from there, we'll be watching closely for sign of exhaustion to initiate a short position, targeting up to 300pips to the downside. A confirmed daily close below the 1.2270 level will serve as out trigger to hold the short position with confidence,
EURUSD
For this market, we remain cautiously bearish. A 4H timeframe close below the 1.3950 region will be our signal to begin more sells to the downside targets around 1.3400 and 1.12800 zones. Until that breakdown occurs, we'll remain on the side-lines to avoid premature entries.
XAUUSD
Gold will be traded with a high level of discipline- only high conviction trades will be taken here. We're currently waiting for a clear breAK and close below the 3291.90 level before initiating any shorts positions. Until then, we maintain a neutral stance and monitor price action closely around key levels.
USOIL
We're keeping an eye on possible entry opportunities, anticipating a potential rally towards the 116 region. Updates on the setup and validation criteria will follow as price action unfolds.
Send a direct message if you are interested in more info about Capital Management.
Patience is the Way! Ieios
