Oil Set to Surge? Aggressive Entry Ahead of Potential BreakoutWTI is showing signs of a breakout following reports suggesting price spikes ahead. I've taken an aggressive position early, with an extreme risk-reward setup. A more conservative 3R idea also sits in play if price confirms. Watch for a trendline break—the clearest sign of lift-off. But be warned: the gap breakout may hit before many can get in. Momentum is building fast.
OIL_CRUDE trade ideas

USOIL FUNDAMENTALS AND TECHNICALS USOIL (WTI Crude) is currently trading near the 72.00 level and is setting up for a potential breakout from a long-standing descending channel on the higher time frame (3D chart). Price has approached the upper boundary of this bearish channel after a strong bullish rally in recent sessions. This indicates growing bullish momentum, and any sustained breakout above the descending trendline could open the path toward the 98.00 zone, a major structural target based on previous price action and Fibonacci projections.
The recent bullish surge in crude oil prices has been fueled by a combination of supply-side constraints and renewed optimism around global demand. OPEC+ continues to show discipline in supply management, and geopolitical tensions in oil-producing regions are adding risk premiums. Furthermore, the Fed’s recent signals of a potential pause in tightening, combined with an improving outlook for Chinese demand recovery, are creating a supportive environment for commodities, particularly oil. These fundamental tailwinds align with the technical structure hinting at an upside breakout.
Technically, USOIL has broken back above a critical mid-channel support level and is now challenging the descending resistance line. The most recent impulsive candles suggest strong buyer conviction. If this momentum holds, we could see a retest followed by continuation toward the 98.00 psychological level. The structure also supports a higher low formation, which is another bullish signal for long-term traders watching the macro channel breakout.
From a trading standpoint, this setup is high probability with a well-defined invalidation zone below 65.00. The confluence of macro catalysts, technical breakout formation, and seasonal demand trends makes this a compelling bullish opportunity. I am closely monitoring price action for confirmation to go long on the breakout and ride the potential wave toward the upper supply region near 98.00.
U

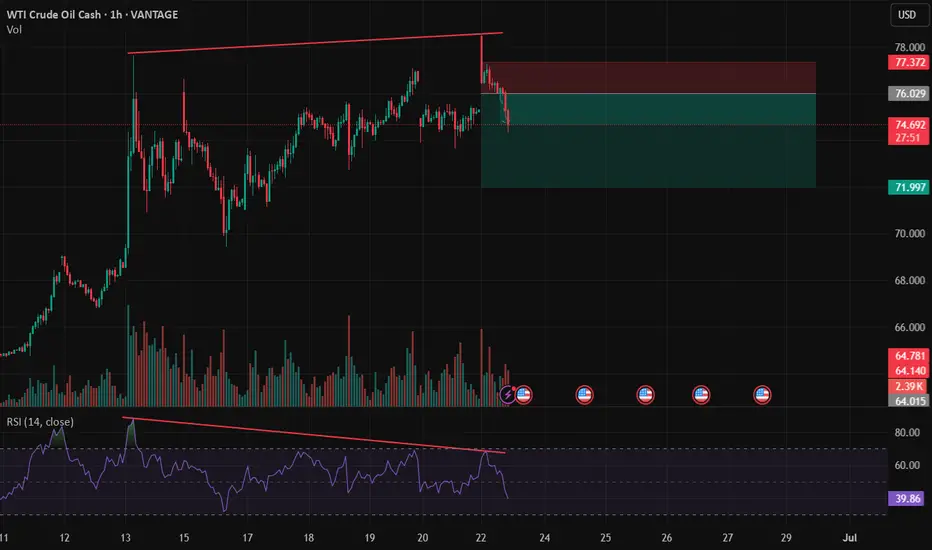
OIL: THE CHART THAT COULD TIP THE WORLDWTI Crude just bounced hard off the $65 channel support, tagging resistance at $76 — and what happens next isn’t just about price. It’s about power.
Zoom into this chart:
We're sitting at a directional pivot with two possible outcomes:
1️⃣ If this was a truncated 5th wave, the structure is complete. Any further war escalation could be the catalyst for oil to break resistance — dragging down risk assets, including CRYPTOCAP:BTC and equities.
2️⃣ If wave 5 isn’t done, we’ll likely see one more sharp leg down before oil launches. Either way, this is a high-stakes Elliott Wave setup with global macro consequences.
Chart with FIB Levels:
You'll see the wave I’ve marked (3) is messy, and on lower timeframes, that may hint at a truncated move worth watching.
Why this matters:
Over 20% of global oil flows through the Strait of Hormuz, a critical chokepoint controlled by Iran. If conflict escalates, that line gets squeezed… and oil price explodes.
Price to watch:
$76 resistance.
If oil breaks, the markets will react fast.
If it fails, we might get one more correction and maybe some relief from the sideways pain we’ve seen across risk assets.
Remember the COVID Crash?
Oil literally went below zero in April 2020. That wasn't just a chart anomaly, it was a global demand collapse. Traders were paying to get rid of oil because there was nowhere to store it. That moment marked a generational low, and what followed was a powerful multi-year 5 wave up.
Now look where we are:
That same COVID low helped form the base of the current Elliott Wave structure. The fact we’re back testing levels that once sparked global panic is no coincidence.
If you’ve been here before, you’ll see the signs. The charts always leave traces. And if this is the end of wave 5, it could be the start of a whole new macro move.
TLDR:
Stop trading headlines.
Trade the structure.
This chart is telling us everything.

USoilLatest news. If the Strait of Hormuz is closed, the restrictions on the import and export of oil and natural gas will increase greatly. Because 20% of the world's oil and natural gas exports come from the Strait of Hormuz. So the trend of geopolitics will affect the closing and opening of this important checkpoint. If the increase in geopolitics really reaches this point, the price of oil may rise to 90$-100$. This is an excellent trading opportunity for investors who like to trade oil. But at present, this is an option for Iran to negotiate. Rather than a real closure, after all, the incident has not developed to this situation. If you like to trade oil. You can also follow me. Get brand new trading opportunities and make profits. Do not trade independently to avoid losses.

US CRUDE OIL LONG RESULT Crude Oil price has been in an overall bullish trend and after it broke out of the previously formed symmetrical triangle.
Tried to get in earlier but wasn't getting enough pullback levels tapped.
Almost got our S.l hit and also missed the Tp but still managed to close in profits.
_THE_KLASSIC_TRADER_.

OIL 2 Best Places For Buy Very Clear , Don`t Miss This 1000 PipsHere is my opinion on oil , we have a very aggressive movement to upside and this is normal right now , i`m looking to buy this Pair if the price go back to retest my support and this will be the best place to buy it for me , and if the price moved directly without retest it i will wait the price to break the other res and then i can enter a buy trade and targeting the highest level the price touch it , also if the price go back to retest my support and go up and closed above the other res i will add one more entry with the same target.

Today's crude oil trading strategy, I hope it will be helpful to Crude Oil Trend Analysis
(1) Geopolitics: Tensions Propel Oil Price Expectations
The Middle East has long been a "powder keg" for the crude oil market, and recent developments have intensified tensions. Military conflicts between Iran and Israel continue to escalate—Iran’s latest attacks injured approximately 50 people in Israel. Controlling the Strait of Hormuz, through which 30% of global seaborne crude oil passes, Iran’s strategic position is pivotal. After the conflict escalated, Iran threatened to block the strait, instantly igniting international oil prices. Brent crude surged to around $79 per barrel. As long as the conflict persists, market fears of crude supply disruptions—like an invisible hand—will continue to underpin price gains.
(2) Supply Side: Interplay of Production Increases and Geopolitical Risks
OPEC+ previously announced plans to increase production by 411,000 barrels per day, but actual output growth has fallen short of market expectations. With current Middle East tensions, the feasibility of this plan remains uncertain. If Iran’s crude production and exports are constrained by the conflict, global supply could tighten. In the U.S., shale oil production remains unstable, affected by technical, cost, and policy factors. Thus, the supply side is fraught with uncertainty: production increase expectations may exert downward pressure on prices, while geopolitical risks could tighten supply outlooks and push prices higher.
(3) Demand Side: Battle Between Seasonality and Economic Prospects
From a seasonal perspective, the northern hemisphere’s summer travel peak has boosted demand for petroleum products like gasoline and jet fuel. Data from the U.S. Energy Information Administration (EIA) shows U.S. crude oil inventories have declined for several consecutive weeks, indicating rising market demand. However, the global economic environment remains bleak: trade protectionism, tariff policies, and other factors have slowed global growth, constraining crude demand. Major economies like China and Europe have failed to meet oil demand projections. Thus, the demand side is torn: seasonal factors provide support, but economic headwinds act as a drag.
Today's crude oil trading strategy, I hope it will be helpful to you
USOIL BUY@72.5~73
SL:71.5
TP:74~75

USOIL: Target Reached!Noice! I mean my dss is fully functional and working ! This is going to be my permanant edge.

BEARISH BAT ON USOIL was a huge successWhat a successful trading opportunity on usoil, the bearish bat pattern was in alignment with the weekly order block. A full video breakdown of this trade and more will be posted soon, and the link is attached to this video for you all to learn.

USOIL Is Very Bullish! Long!
Take a look at our analysis for USOIL.
Time Frame: 1D
Current Trend: Bullish
Sentiment: Oversold (based on 7-period RSI)
Forecast: Bullish
The market is on a crucial zone of demand 73.546.
The oversold market condition in a combination with key structure gives us a relatively strong bullish signal with goal 79.365 level.
P.S
We determine oversold/overbought condition with RSI indicator.
When it drops below 30 - the market is considered to be oversold.
When it bounces above 70 - the market is considered to be overbought.
Disclosure: I am part of Trade Nation's Influencer program and receive a monthly fee for using their TradingView charts in my analysis.
Like and subscribe and comment my ideas if you enjoy them!

Double topDouble top with RSI divergency. If you have the strength to ride all the way down to neck line you going to be well rewarded.
USOIL Bullish breakout from symmetrical triangle pattern🚨 USOIL Breakout Alert! 🚨
1H Time Frame | Symmetrical Triangle Breakout
Crude oil (USOIL) has broken out bullishly from a symmetrical triangle pattern — confirming strong upward momentum. 📈
🎯 Entry Level: 74.20
📍 Technical Targets:
1st Resistance: 75.70
2nd Resistance: 76.80
This setup signals a potential continuation of bullish momentum. Keep an eye on volume confirmation and price action near resistance levels.
💬 Drop your thoughts in the comments!
📲 Like, follow, and join us for more real-time market insights.
Trade smart
,
– Livia 😜

Weekly crude oil chart shows continued bullish outlook.Last week's candlestick chart closed with a strong bullish candle at the channel's upper boundary. This week's close formed a pin bar.
Two consecutive weeks of candlestick patterns.Creating a Harami pattern
Strong bullish signals
Patiently observe market developments.

USOIL BEST PLACE TO SELL FROM|SHORT
USOIL SIGNAL
Trade Direction: short
Entry Level: 73.94
Target Level: 72.14
Stop Loss: 75.12
RISK PROFILE
Risk level: medium
Suggested risk: 1%
Timeframe: 2h
Disclosure: I am part of Trade Nation's Influencer program and receive a monthly fee for using their TradingView charts in my analysis.
✅LIKE AND COMMENT MY IDEAS✅


Crude oil is displaying serious weaknessCrude oil is trapped in a descending triangle after a blow off top. might take some time to play out but target for crude oil based on the triangle is 42-40 crude oil.

Is the oil market signalling de-escalation?After an initial 6% spike at the open, U.S. crude oil futures reversed sharply—falling into negative territory—as markets priced in the possibility that Iran's latest retaliation may be more symbolic than escalatory.
According to President Donald Trump, Iran gave advance notice before launching missiles at a U.S. base in Qatar, allowing defences to intercept the attack and resulting in no reported casualties.
While Tehran publicly described the strike as “devastating and powerful,” the lack of impact on the ground and the pre-warning have fuelled speculation that Iran was aiming to save face without triggering a broader conflict.
The swift reversal in oil prices reflects that sentiment. For now, the market appears to be signaling that escalation may pause here.

Predicted with good analysisIn light of the world global chaos, the markets reacted accordingly. The analysis, speaks for itself. Be vigilant and manage risk accordingly - always.

USOIL - BullishUSOIL is testing its support level after a good retracement. This is also a trend line support. Buying at current level with stop loss below support level.

Crude Oil Strategy LayoutThe rise in oil prices on Monday will not only push up household daily expenses such as fuel and heating costs, but also increase corporate operating costs, which may in turn suppress consumption and investment activities. Ellen Zentner, Chief Economic Strategist at Morgan Stanley, pointed out in a Sunday analysis that against the backdrop of the Trump administration's high tariff policies, the U.S. economy was already facing pressure from a slowdown in growth, and the further increase in oil prices would exert "powerful pressure" on household consumption capacity. This may not only weaken consumers' willingness to purchase, but also drag down the pace of overall economic growth.
Crude oil showed a gap-up and then decline trend today, falling sharply from around $77.7. Oil prices gradually corrected today, with the lowest point touching around $72.5 and hovering there. Currently, oil prices are hovering above the support level of 72.0, which is expected to be the bottom support of the box movement. Taken together, crude oil is in a high-range consolidation. In terms of operation, it is considered to lay out long positions on pullbacks.
you are currently struggling with losses,or are unsure which of the numerous trading strategies to follow,You have the option to join our VIP program. I will assist you and provide you with accurate trading signals, enabling you to navigate the financial markets with greater confidence and potentially achieve optimal trading results.
Trading Strategy:
buy@72.0-72.5
TP:75.0-75.5

Oil buy setup H1Hello! Friends,
Greetings. Please leave a Like if you like the idea.
Before start talking about technical Let's share your LOVE by giving me LIKES to support this work. Thanks in advance.

WTI Oil H4 | Multi-swing-low support at 61.8% Fibo retracementWTI oil (USOIL) is falling towards a multi-swing-low support and could potentially bounce off this level to climb higher.
Buy entry is at 72.92 which is a multi-swing-low support that aligns with the 61.8% Fibonacci retracement.
Stop loss is at 69.10 which is a level that lies underneath a swing-low support.
Take profit is at 77.60 which is a multi-swing-high resistance.
High Risk Investment Warning
Trading Forex/CFDs on margin carries a high level of risk and may not be suitable for all investors. Leverage can work against you.
Stratos Markets Limited (tradu.com ):
CFDs are complex instruments and come with a high risk of losing money rapidly due to leverage. 63% of retail investor accounts lose money when trading CFDs with this provider. You should consider whether you understand how CFDs work and whether you can afford to take the high risk of losing your money.
Stratos Europe Ltd (tradu.com ):
CFDs are complex instruments and come with a high risk of losing money rapidly due to leverage. 63% of retail investor accounts lose money when trading CFDs with this provider. You should consider whether you understand how CFDs work and whether you can afford to take the high risk of losing your money.
Stratos Global LLC (tradu.com ):
Losses can exceed deposits.
Please be advised that the information presented on TradingView is provided to Tradu (‘Company’, ‘we’) by a third-party provider (‘TFA Global Pte Ltd’). Please be reminded that you are solely responsible for the trading decisions on your account. There is a very high degree of risk involved in trading. Any information and/or content is intended entirely for research, educational and informational purposes only and does not constitute investment or consultation advice or investment strategy. The information is not tailored to the investment needs of any specific person and therefore does not involve a consideration of any of the investment objectives, financial situation or needs of any viewer that may receive it. Kindly also note that past performance is not a reliable indicator of future results. Actual results may differ materially from those anticipated in forward-looking or past performance statements. We assume no liability as to the accuracy or completeness of any of the information and/or content provided herein and the Company cannot be held responsible for any omission, mistake nor for any loss or damage including without limitation to any loss of profit which may arise from reliance on any information supplied by TFA Global Pte Ltd.
The speaker(s) is neither an employee, agent nor representative of Tradu and is therefore acting independently. The opinions given are their own, constitute general market commentary, and do not constitute the opinion or advice of Tradu or any form of personal or investment advice. Tradu neither endorses nor guarantees offerings of third-party speakers, nor is Tradu responsible for the content, veracity or opinions of third-party speakers, presenters or participants.

The situation escalates? Crude oil gains remain stable
💡Message Strategy
The daily chart of WTI crude oil shows a 30% increase from late May to mid-June, with prices stagnating below resistance near $76. The Commodity Channel Index (CCI) has been overbought since late May and is now approaching a potential buy signal below 100.
Volatility peaked on June 14 and has since fallen back, suggesting that oil prices could see a correction if tensions in the Middle East do not escalate further. But now that the United States is out of the game and the situation could escalate at any time, crude oil is still in a bullish market.
📊Technical aspects
From the daily chart level, crude oil prices have broken through the upper resistance of the range in the medium term and tested a new high of 75.00. The moving average system is in a bullish arrangement, and the medium-term objective trend is upward. The current trend is in the upward rhythm of the main trend. The MACD indicator fast and slow lines overlap with the bullish column above the zero axis, indicating that the bullish momentum is currently full, and it is expected that the medium-term trend is expected to usher in a wave of rising rhythm.
The short-term (1H) trend of crude oil fluctuated and then broke through upward, and the oil price tested a new high near 78.40. The moving average system gradually opened upward, and the short-term objective trend direction was upward.
In terms of momentum, the MACD indicator fast and slow lines opened upward near the zero axis, and the bullish momentum was dominant. It is expected that the trend of crude oil will maintain a high level of fluctuation upward.
💰Strategy Package
Long Position:74.50-75.50,SL:73.50
Short-term target is around 77.00-78.00
