$OKB 9-12x opportunityMid term (1-3 month).
Take profit 1: 180$
Take profit 2: 240$
Stop loss: 10$
Do your own research.
OKBUSDT trade ideas

OKBUSDT ://Scalpers DreamOKB has deep roots with several projects_ one my go to L2 swap for eth n wbtc or and ZKS
this one has had very predictable and steady price action (she seems to do esp well following btc n eth main market trends) this is one ive watched but not really played with. hopefully we get some v3 zks liquidity so we can scalp a way with out a VPN etc for those in usa type jurisdiction.
OKB - $50OKB is currently trading above the support zone at $27.49. As long as this support is maintained, we could start seeing a move towards $32.60, $35.58, $39.38 and $50.36. Failure to hold the support at $27.49 could lead to a drop towards $24.26 and $21.55.

OKB/USDTesting/tracking elliot wave theory. Please do not trade off idea without S/L. Not financial advice.


OKB USDT SIGNALIt seems that we will soon see a decrease in prices.
Enter the deal with caution.
#REZA_VGR
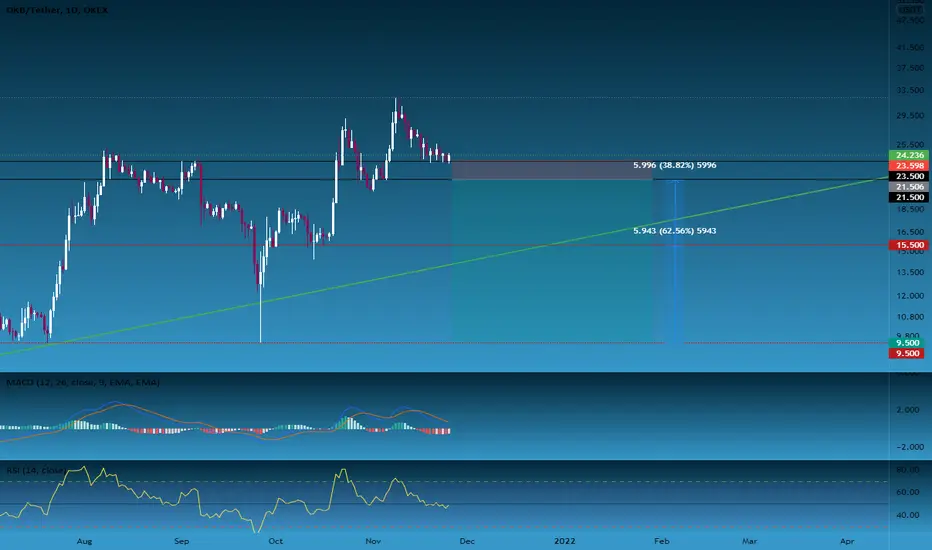
OKBHi guys, OKB is trying to break through the $22 zone to move up to the $26, $30 and $40 zone this November. But if it loses the $22 zone, we can buy it back at the $19 zone...

🆓OKB (OKB) Nov-2 #OKB $OKBOKB is trying to break through the $22 zone to move up to the $26, $30 and $40 zone this November. But if it loses the $22 zone, we can buy it back at the $19 zone
📈RED PLAN
♻️Condition : If 1-Day closes ABOVE 22$ zone
🔴Buy : 22
🔴Sell : 26 - 30 - 40
📉BLUE PLAN
♻️Condition : If 1-Day closes BELOW 22$ zone
🔵Sell : 22
🔵Buy : 19
❓Details
🚫Stoploss for Long : 10%
🚫Stoploss for Short : 5%
📈Red Arrow : Main Direction as RED PLAN
📉Blue Arrow : Back-Up Direction as BLUE PLAN
🟩Green zone : Support zone as BUY section
🟥Red zone : Resistance zone as SELL section

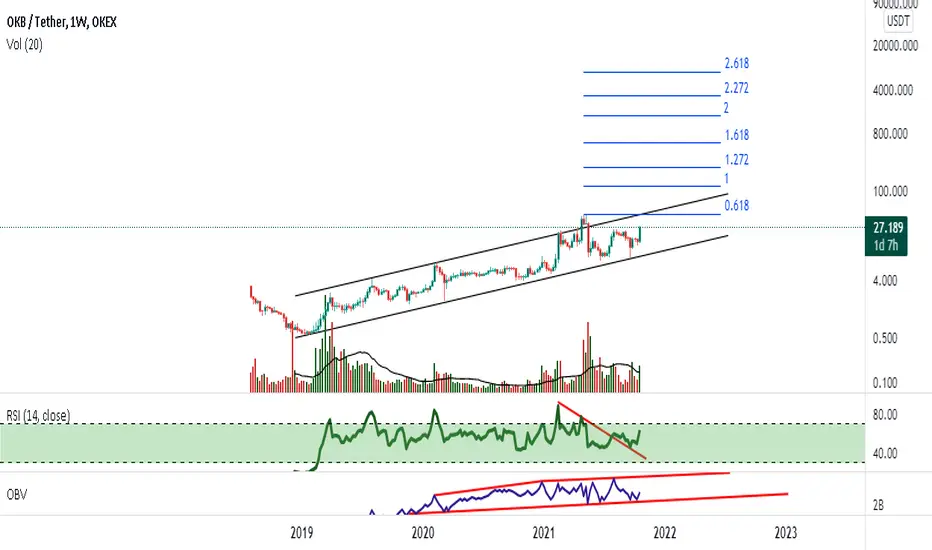
okbusdtt : w
rank : 73
OKB is a cryptocurrency released by the OK Blockchain Foundation and Maltese crypto exchange, OKEx. The exchange is one of the largest in the world and currently ranks third in liquidity, fourth in trading volume, and provides a wide selection of trading pairs. OKEx is similar in many aspects to the cryptocurrency exchange giant Binance
If the roof breaks, it will reach very high goals
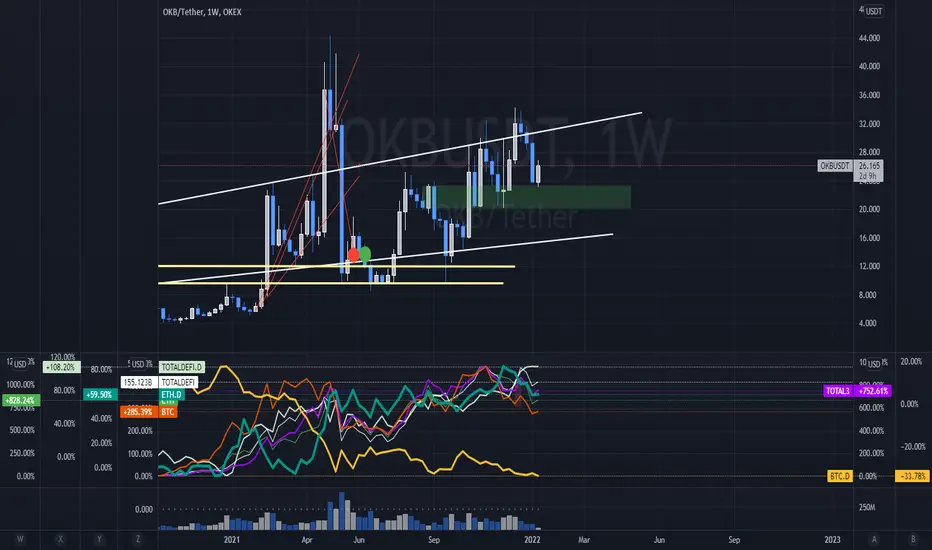
OKB Price Analysis: Bollinger Bands Squeeze and Hook PatternOKB has been one of the top-performing cryptocurrencies over the past week, with more than 58% gains. A very rare chart pattern, which on the surface might not say much, is pointing to a trend in the making. The recent explosive move was triggered by the Bollinger Bands squeeze and hook pattern.
Bollinger Bands Squeeze Pattern
In technical analysis, the Bollinger Bands squeeze happens when the two bands turn flat and get closer to each other. This indicates that there is an ongoing ranging market. This implies that when the Bollinger Bands are flat, the price tends to make explosive moves in either direction.
Often, consolidations lead to trend expansion, but many times there are false breakouts too. To distinguish between a false breakout and a genuine breakout, the Bollinger Bands come in handy.
When we have a breakout and the upper band “hooks” upwards, while the lower band hooks downwards, there is a higher probability of a trend continuation in the direction of the breakout.
The daily OKB price chart displays the exact pattern described above. The upside breakout was accompanied by the Bollinger Bands hook in the opposite direction.
Moving forward, if OKB sustains the break above the $25.21 resistance level, there is a high probability for the bulls to challenge the next resistance level found at $42.16.

OKB token from OKEx exchange!Can we now start using the break of the trend line as support. If so, I expect another big pump. After hitting the demand zone we have risen almost 100% in a few days.......nice nice. The power of Supply and Demand.


OKB/USDT GO THE MOON⭕Hello friends, I am happy to comment on this analysis below this post. ⭕📌Please like this post to support us and follow us. Thank

does it again n i sell rite b4 again lol some things that wayi seem to personally cause this one to rally every time i sell OMG we need to finish that L@ zks limit order app so help me g0000d harold!!!! we got to get that done smilez
short term advice is with eth.d so hi look for trend change in overall eth for whatever alt u are watching. if usd n btc are up n eth is not only way down but significantly different then the average on btc n fiat u know if eth turns with the other two overall pairs that alt will fly _ again in the short term

strong bounce support linehigh rr trade, you can long it after finding support on the 22$ line or right now after a breakout of the blue line (even targeting 30$ on htf)

$OKT The currency is still waiting for you to join, do not wastThe currency is still waiting for you to join, do not waste it.
the key is the simplicity.
Good luck for everyone.
Take yr risk managment.

$OKB start of movement ... start of movement. Investors in platform currencies. Good platform and its currency is good for long distance investment.
good luck for every one invest in.

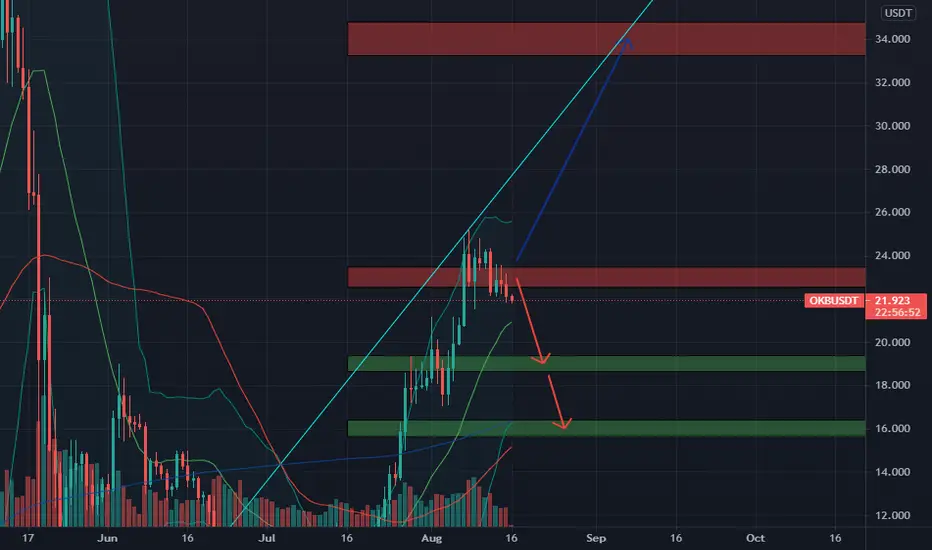
🆓OKB (OKB) Aug-15 #OKB $OKBOKB is weakening after losing the $23 zone and if it can't conquer this zone, in the next few days it will fall back to the $19 and $16 zones. But if there is strong buying force to help it conquer the $23 zone, it will rise sharply to the $34 zone in early September
📈BUY
🔴Buy : 18.6-19.4$ if A. SL if B
🔴Buy : 15.6-16.4$. SL if B
📉SELL
🔴Sell : 22.5-23.5$. SL if A
♻️BACK-UP
🔵Buy : 22.5-23.5$ if A. SL if B
🔵Sell : 33.2-34.8$. SL if A
❓Details
🕯Timeframe : 1 Day
📈Red Arrow : Main Direction as BUY and SELL section
📉Blue Arrow : Back-Up Direction as BACK-UP section
🟩Green zone : Support zone as BUY section
🟥Red zone : Resistance zone as SELL section
🅰️A : The Close price of candlestick is Above the zone
🅱️B : The Close price of candlestick is Below the zone
OKBUSDT long Risk warning, disclaimer: the above is a personal market judgment based on published information and historical chart data on Tradingview, all analysis is only subjective. Hope investors consider, I am not responsible for your investment decision. Thank you.
Good luck


OKB (OKB) - July 7Hello?
Welcome, traders.
By "following", you can always get new information quickly.
Please also click "Like".
Have a good day.
-------------------------------------
(OKBUSDT 1W chart)
We need to see support at the 9.601 point and move above the 13.451 point to see if the uptrend can continue.
(1D chart)
We need to see if we can get support by moving up to the 12.587-15.409 section.
As it fell from the 12.587 point, it is effectively entering the mid- to long-term investment area, so careful trading is required.
In order to transition into an uptrend, the price must rise to the 15.409-21.053 section and hold.
-------------------------------------
(OKBBTC 1W chart)
If the price is maintained above the 35000 satoshi point, it is expected to continue the upward trend.
(1D chart)
If the price is maintained in the 32040 Satoshi-40790 Satoshi section, it is expected to turn into an uptrend.
If it falls from the 27670 Satoshi point, there is a possibility of entering the mid- to long-term investment area, so careful trading is required.
------------------------------------------
We recommend that you trade with your average unit price.
This is because, if the price is below your average unit price, whether it is in an uptrend or in a downtrend, there is a high possibility that you will not be able to get a big profit due to psychological burden.
The center of all trading starts with the average unit price at which you start trading.
If you ignore this, you may be trading in the wrong direction.
Therefore, it is important to find a way to lower the average unit price and adjust the proportion of the investment, ultimately allowing the funds corresponding to the profits to regenerate themselves.
------------------------------------------------------------ -----------------------------------------------------
** All indicators are lagging indicators.
Therefore, it is important to be aware that the indicator moves accordingly with the movement of price and volume.
However, for the sake of convenience, we are talking in reverse for the interpretation of the indicator.
** The wRSI_SR indicator is an indicator created by adding settings and options to the existing Stochastic RSI indicator.
Therefore, the interpretation is the same as the traditional Stochastic RSI indicator. (K, D line -> R, S line)
** The OBV indicator was re-created by applying a formula to the DepthHouse Trading indicator, an indicator disclosed by oh92. (Thanks for this.)
** See support, resistance, and abbreviation points.
** Support or resistance is based on the closing price of the 1D chart.
** All descriptions are for reference only and do not guarantee a profit or loss in investment.
Explanation of abbreviations displayed in the chart
R: A point or section of resistance that requires a response to preserve profits.
S-L: Stop Loss point or section
S: A point or section where you can buy for profit as a support point or section
(Short-term Stop Loss can be said to be a point where profit and loss can be preserved or additional entry through split trading.
GAP refers to the difference in prices that occurred when the stock market, CME, and BAKKT exchanges were closed because they are not traded 24 hours a day.
G1 : Closing price when closed
G2: Opening price
(Example) Gap (G1-G2)

okbusdt short termA okb coin that is burned. expected to reach the target within a month with low risk
warning : dont use leverage or margin

OKB Resistanceit seems like we are in decision time. if bitcoin not goes crazy for sure.
( that is not any financial advice )
