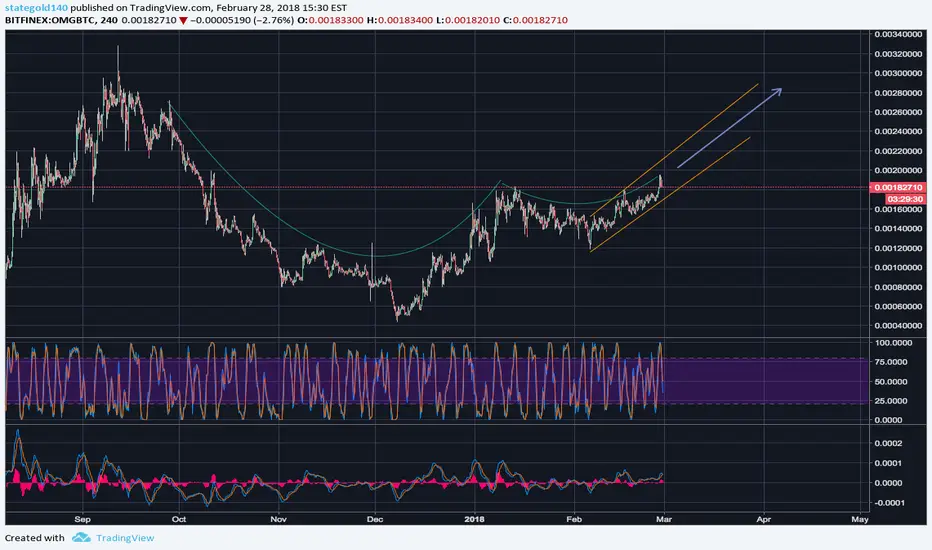
OMG....Bullish.....upward trendOMG is showing several different signals and fortunately for us....they all signal in the same direction....UP! Whether you see cup and handle , Ascending Wedge, or and Ascending Channel you see value ascending!
OMGBTC trade ideas
OMGBTC: consolidating above previous resistanceOMG consolidating above resistance and now support.
target 1: 230k sat

OMG/BTC - Short-Long rangesBased off my TA ive made short-long term target zones (ranges) that could be met. Im just starting to working on my short term TA analysis so please take this post as potential targets and do your own research before making trades on this coin.
Fingers crossed! & Good Luck!
(1-day candles)


OMGBTC head and shouldersLooks like we are in a nice channel for the finishing of a head and shoulders. If it completes I think we should have the target shown in yellow

OMG/BTC Waves Theory , 225k Sat targetvery theoritcal and depending on BTCUSD , but this is what is going through my head

OMG: saucer Base formingGood morning,
Although I love the Elliot-wave theory a lot, I saw a pattern forming that we don't see that much. A saucer-base, which is NOT a cup and handle. The dept of the saucer is less than 20% as it needs to be. The length of the saucer normally is between 7 to 65 weeks so its one week shorter. I think its creating a nice buy in opportunity here. Save trades!
(this is not a buy or sell advise) Make your own wise decisions.
Greets from Belgium!


OMG Looking for a breakout?Looks like a bullish pennant is forming, OMG might be due for a little breakout here in a bit.

Cup & Handle formation OmiseGoI've been following and building up my OMG bags for some time now. This weekly chart shows a cup & handle formation and it's also interesting to note that OmiseGo has held it's ground pretty well over these last weeks of volatile markets. I'm very bullish on this.
Good luck! :)

Conservatively THERE n THENCombine: Waves, Pattern, Trend, Fib Projection, Fib Time.
When they all come together, it's pretty solid, but nothing is for certain, one BTC big move could easily alter the course of it's history.

OMGBTC bulls in actionStorch RSI have more room to grow.
Blue line is the first resistance if we brake it than the next target will be yellow line

OMG! Wedgie Time!BITFINEX:OMGBTC
Wedge is broken and who really needs TA when the FA here is so good? Anyway, will be looking to sell of the majority of my position at the 61.8 fib retracement near .0022. It could keep rolling from there, but it'd be wise to start taking profit in that area.

I am still bullish on OMG (OmiseGo)The first project on Plasma, OmiseGo have both fundamental and technical bullish at the same time.
discover.coinsquare.io
I see a 'round bottom' and potentially 'Ascending Triangle' pattern on the chart right now, Buy on breakout could play out well.
Disclaimer
***THIS IS NOT AN ADVICE, I AM NOT YOUR FINANCIAL ADVISER***

OMG resistance broken ( 76% potential )buy now 0.00181
targets 0.002 / 0.0024 / 0.0027299 / 0.00328
stop loss 0.0154

OMG I Am SOOOOO Strong BINANCE:OMGBTC
OMG strong up channel the chart talks for itself. IF we can get a full candle breakout in the purple range it should be looking good to move on up! I will update once we get to that area/break it.

Alts counter strikeLooks like BTC increasing dominance has completed or at least give some rest with alts rebounding, so OMG is doing so far great against BTC you might consider a buy.

OMG have great targets !!POLONIEX:OMGBTC try to move to 1st target today 0.00175
if it move to this target it will achieve more targets sooner
and al least next july it will gain more 500000 sat as reward to holders
so decide if you are POLONIEX:OMGBTC Holder or just fast trader
support me with like , follow and share my idea if you think it's right
join us on Free Telegram Channel
t.me
***This is not a recommendation to buy or sell***

ytdgidisat iyi gibi.. trend bozulmaz ise tahminim bu sekilde. inis ve cikisli yavas ilerleme.. bakalim...piyasada olumsuz bir haber olmaz umarim.

OMG/BTC Is Looking Bullish 200% + ROIHello, Trading View,
Here is a buying opportunity. You can buy in now, bt if it double tops on you. Then you could lose money. So in my opinion you should wait until the breakout confirmation.
Here is my opinion as to where you should put your buy ins and stop losses based upon how risky you want to play it.
Buy-in: 0.00171350
Target 1: 0.00200580 - 25%
Target 2: 0.00231309 - 25%
Target 3: 0.00266647 - 25%
Target 4: 0.00296608 - 25%
Stoploss: 0.00129136
Conservative stoploss zone: 0.00148341
Very conservative stoploss zone: 0.00173693

OMG - C&H, Holding Support & Hype over deal with Thai Gov.Contrary to the majority of the market $OMG is still looking really strong and maintaining an upward trend. With the formation of a cup and handle and some media attention over their recent deal with the Thai government they look poised for a breakout.
The 50MA is providing strong support but be wary of resistance at 0.0018
Spike in volume to be the catalyst for a breakout, potentially linked to news at current conference.

Looks like OMG will follow with the bears.OMG brokeout the uptrend channel and created a bear flag, if this breaks down through H&S neckline then maybe it will test it and go down.
^Theories^

Cup + Handle + Handle - Omg ultra bull patternMajor Fundamentals
Beautiful bullish pattern
Entry-
Above 0.0018
Target--
0.003 But these formations tend to give potentially much higher targets because they represent a change of trend.
0.0023 short/mid term
