OMGUSDMy personal purpose.
Looks like OMGUSD trying to breakout its pattern.
Let's keep watching.
Good luck.
OMGUSD trade ideas

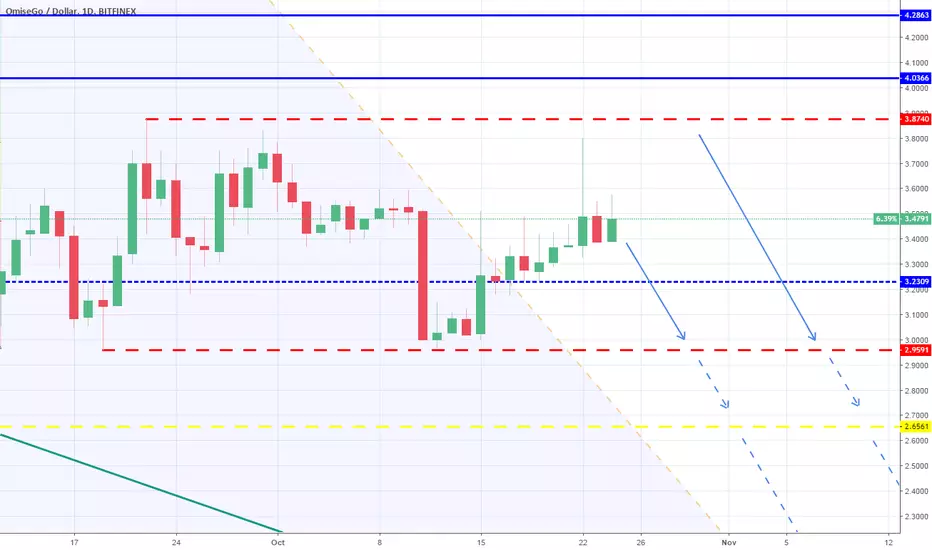
OMG long term bottom? OmiseGo, Part 2Previous analysis i showed a few signs, indicating the possible weakness on the short term, which got confirmed quite clearly eventually. It was a good example of a better safe than sorry situation. It bounced up twice exactly from that support area i showed and so far it has been moving up slowly.
I am going to try and trade this one, risking a tiny amount at the start and having a potential big win. How? well let me show you. I want to see a small drop again towards that trend line and green support zone, there i will buy a small amount and use that red zone below it as a stop loss. So if this fails, it will only be a small loss. If that plays out and we start to see the market move upwards, i will increase the size when we break that first red resistance zone and increase it even more if the second one breaks as well. While i increase, i move the stops higher as well to keep the same risk.
The daily candle looks quite good now, but still very low volume so we need to see more conviction from buyers here. The volume will probably start after the second red zone breaks.
Please don't forget to like if you appreciate this :)
Previous analysis:


OmiseGoOMGUSD
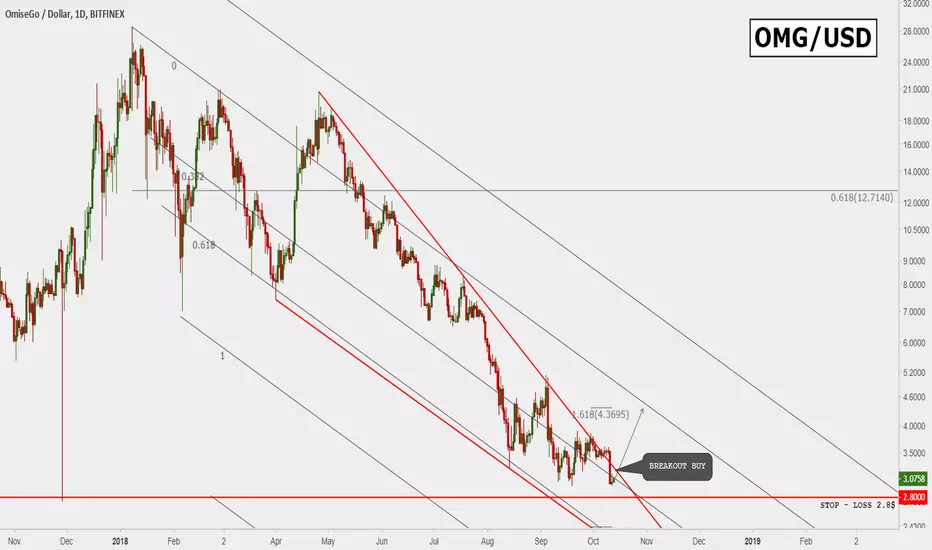
Breakout the triangle resistances. Important resistance level is 38.20%Fibonacci, main target for this trade is 50%Fibonacci.


OMGUSD: Still sideways until the Rectangle breaks.The 2.9590 - 3.8740 Rectangle remains valid (ADX = 33.882) but on increasing bearish bias (MACD = -0.046, Highs/Lows = -0.0418) indicating that a support break out is imminent. Until that happens of course, every spike towards the 3.8740 is a short opportunity since the long term trend remains bearish on 1W (RSI = 36.187). We remain bearish on Omisego with TP = 2.6561 and 1.4942 (long term).


OmiseGo analysis: 6 hour timeframeThe 6 hour timeframe of OmiseGo is presented in this analysis with price action from August 17, 2018 to current date. ~$3.84 and $2.99 have marked a horizontal barrier for price action since September 19, 2018, with $3.84 acting as a ceiling for price and $2.99 as support area.
The width of the pattern best described as a rectangle bottom pattern is indicated and taken as $0.85 ($3.84 minus $2.99). A successful breakout above $3.84 or below $2.99 should provide a $0.85 move as a minimum expectation for the price of OMGUSD i.e. projection of ensuing move following a successful bullish or bearish breakout.

OMG long term bottom? OmiseGoThe bottom formation here looks quite solid. The green support zone has been holding for quite some time now. The rejection after the triangle breakout earlier today is quite worrying though. Still above the support zone of the triangle. The target is actually around 3.9, so i am wondering if the market was too weak to reach that (bearish sign) or that the bulls will give it another try. The 3.8ish is a very strong resistance level so i see a buy signal for the mid/long term if we get a daily close ABOVE this level.
Please don't forget to like if you appreciate this :)
Previous analysis:


OMGUSD: Rectangle on 1D identified. Sideways until (S) breaks.Omisego is trading sideways within a 1D Triangle (RSI = 53.725) under High Volatility (ATR = 0.2020) that keeps the price within a 2.9590 Support and 3.8740 Resistance. Due to the underlying long term bearish trend on the 1W chart (RSI = 37.359, MACD = -2.090, Highs/Lows = -0.1851, B/BP = -1.9305), shorting every move near the Resistance is better suited than a full scalp. That is why we remain bearish on OMGUSD with TP = 2.6561 and 1.4942.
OMG/USD descending trendlineBreaking this descending trendline would be bullish in my opinion. Stochastic RSI and MACD are looking good to try an upward movement. I doubt this can by typified as a falling wedge but I included the lower line nevertheless.

Cradle strategy indicatorsI've combined the on chart indicators for the TraderCobb cradle strategy all into one indicator

OMG SignalOur OMG Signal is up 12% from entry and the 50 EMA on the 6 hour is no longer resistance and has turned to support

OMGUSD: 1D Falling Wedge. Retesting the support.Omisego gave the expected bearish 1D candle that tested the 2.9640 support creating a Falling Wedge (RSI = 43.877, MACD = -0.127, Highs/Lows = -0.0320, B/BP = -0.0909). This should technically seek a Lower Low at 2.6561 (first TP) in the coming candles, but the 2.9640 1D support needs to break as so far it has been rejected twice. Even if the Wedge breaks, any upside is limited to the 1W 0.500 (4.0367) - 0.618 (4.2860) Fibonacci retracement. Longer term TP = 1.4942.


OMGUSD looking for a breakout PRE ENTRY OMGUSD Long
Entry 3.10-3.20$ (breakout)
Target 4.30$
Stop 2.80$
OMGUSD: Still sideways. Approaching a bearish break-out.Omisego remains neutral both on 4H (RSI = 50.314, Highs/Lows = 0.0000) and 1D (RSI = 47.725, Highs/Lows = 0.0000) as it approaches the 1W Channel Down limitation. It will either be rejected towards 2.000 or bounce to the 0.500 - 0.618 Fibonacci retracement level. In both cases 1W is a strong sell (MACD = -2.179, Highs/Lows = -0.6889, B/BP = -28843) and should make a Lower Low. Our TP is intact for OMGUSD at 1.4942.

OMGUSDDonw for support line and UP to resistance line.
Predikcion to 13.10.2018
OMG is clean in canal.

OMG Breakout testWill it break?
For Omise, the end goal is “a decentralized mechanism for eWallet platforms holding fiat-backed value” , more so a network to better serve their existing payments gateways in terms of security and scalability. ‘ While OmiseGO supports payments, is not designed first and foremost a payment processor within a specific eWallet payment provider (EPP) ’. Hence, Omise’s Plasma DEX is a base infrastructure upon which a variety of payment and exchange systems can be built, allowing:
Any EPP, exchange, payments processor or other to exchange Crypto-to-Crypto, Fiat-to-Crypto, Fiat-to-Fiat, and more (nonfungibles) though their own processor built atop of the White Label SDK.
github.com
The DEX comprised of many liquidity hubs, formed through Omise’s acquisition of already existing exchanges, running Lighting Network, Swaps and HTLCs, is not only a asset-to asset gateway that allows for trading and exchange, but a liquidity pool serving expansive monetary and financial applications.
Computation and enforcement occurs via staking of OMG, bonded via plasma child chain to Ether, allowing for exit-gateways and by effect creates a scalability model for the ethereum network.
plasma.io
Owning OMG tokens buys the right to validate this blockchain, within its consensus rules. Transaction fees on the network including (but not limited to) payment, interchange, trading, and clearinghouse use, are given to non-faulty validators who enforce bonded contract states.
cdn.omise.co
