OM - fib / entry targetsWeekly TF
@ 618 = 0.180 - 0.205 price range.
Would treat this as a long trade with low lvg. 50% up vs 15% down.
@ 786 = 0.05 - 0.07 price range.
Spot buy. 11,000% (to ATH) up vs 37% down.
Weekly RSI moving to oversold would be a good buy signal.
Key stats
About MANTRA
Related coins

OM pain not over yet!OM as predicted (on my X account) we got a nasty dump and we also got some autobounce reaction on breakout area. Hard to say if this was enough or we make another autobounce from here as we are oversold. In any case I do not see a case for jumping back in now (except maybe for scalp traders), my pl

OM ... GOM (mantra) looking quite spicy.
Finding support briefly on the 0.5 fib / $0.35
Could be lining up for a recovery pump after seeing a drawdown of -94% early April 📉
Else moves down to 618 possible. In the meantime keep your fingers and toes crossed 🤞 maybe the crypto God's will be kind.

$VARA LIVE!! Orderflow Pivot Levels BULLISH TARGETS!!!Here are your daily levels guys. A lot of movement on order wall position a few larger ones opened up. Support looks good but I did make note of a small gap between about 5800 and 5000 pips.

Mantra - Send it to Zero with HasteMantra is a low liquidity shit coin with no real use case. The liquidity in wETH in the LP is lower than most memecoins, honestly - check for yourself. The CEO did an interview and admitting to selling OTC orders and pumping his token price bc the liquidity was so low.
The idea is for RWAs, howeve

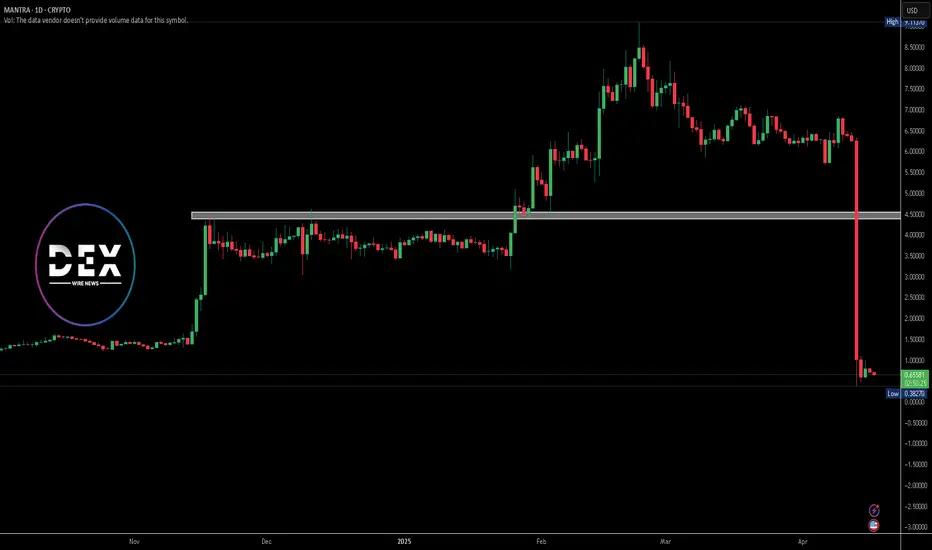
OM Token Plunges 92% as MANTRA Initiates InvestigationOn April 13, MANTRA’s native token, OM, experienced a dramatic 92% drop in price, plummeting from over $7 to just $0.66. The sharp fall occurred around 18:28 UTC during a period of low market activity. This sudden crash erased most of OM’s recent gains, bringing the weekly loss to -89.73%. As of now
OM Mantra Dao: $0.59 | Key Levels for Re Entry or Buy Buy Backmarkets placements go round as Buffet would say
goes from one pocket to another or the patient one
greed is validated
fear is all over
another opportunity
for reset or BUY BACK by informed pals
wait wait wait
--
TRUMP was the beginning of the decline or recent TOP
MANTRA may just be the bo

OMUSD - Monthly Channel IndicatorOn the monthly chart this dump is shown as just a retest of the Gaussian Channel indicator which price is still above.
Very big move which could shake a lot out.
If you are long on this Monthly you should not be very worried. Unless the intensity of the downward move is too much.
Monthly chart.

OMUSD - Big DumpA massive move downwards on this Weekly timeframe
I think still however support can be found and the overall upward phase on the longer term trend line can resume
Could be a massive buy the dip scenario
Reminds me in some ways of the LUNA crash however
I would wait till the the price label point is

Best position , super trendsuper trend,
Moving towards the $10 target
Flight to the top ten currencies of the market

See all ideas
Summarizing what the indicators are suggesting.
Oscillators
Neutral
SellBuy
Strong sellStrong buy
Strong sellSellNeutralBuyStrong buy
Oscillators
Neutral
SellBuy
Strong sellStrong buy
Strong sellSellNeutralBuyStrong buy
Summary
Neutral
SellBuy
Strong sellStrong buy
Strong sellSellNeutralBuyStrong buy
Summary
Neutral
SellBuy
Strong sellStrong buy
Strong sellSellNeutralBuyStrong buy
Summary
Neutral
SellBuy
Strong sellStrong buy
Strong sellSellNeutralBuyStrong buy
Moving Averages
Neutral
SellBuy
Strong sellStrong buy
Strong sellSellNeutralBuyStrong buy
Moving Averages
Neutral
SellBuy
Strong sellStrong buy
Strong sellSellNeutralBuyStrong buy
Displays a symbol's price movements over previous years to identify recurring trends.
Frequently Asked Questions
The current price of MANTRA (OM) is 0.21111 USD — it has risen 0.32% in the past 24 hours. Try placing this info into the context by checking out what coins are also gaining and losing at the moment and seeing OM price chart.
The current market capitalization of MANTRA (OM) is 206.47 M USD. To see this number in a context check out our list of crypto coins ranked by their market caps or see crypto market cap charts.
MANTRA (OM) trading volume in 24 hours is 35.25 M USD. See how often other coins are traded in this list.
MANTRA price has risen by 4.27% over the last week, its month performance shows a −31.23% decrease, and as for the last year, MANTRA has decreased by −78.00%. See more dynamics on OM price chart.
Keep track of coins' changes with our Crypto Coins Heatmap.
Keep track of coins' changes with our Crypto Coins Heatmap.
MANTRA (OM) reached its highest price on Feb 23, 2025 — it amounted to 9.11370 USD. Find more insights on the OM price chart.
See the list of crypto gainers and choose what best fits your strategy.
See the list of crypto gainers and choose what best fits your strategy.
MANTRA (OM) reached the lowest price of 0.01725 USD on Oct 12, 2023. View more MANTRA dynamics on the price chart.
See the list of crypto losers to find unexpected opportunities.
See the list of crypto losers to find unexpected opportunities.
The current circulating supply of MANTRA (OM) is 1.67 B USD. To get a wider picture you can check out our list of coins with the highest circulating supply, as well as the ones with the lowest number of tokens in circulation.
The safest choice when buying OM is to go to a well-known crypto exchange. Some of the popular names are Binance, Coinbase, Kraken. But you'll have to find a reliable broker and create an account first. You can trade OM right from TradingView charts — just choose a broker and connect to your account.
Crypto markets are famous for their volatility, so one should study all the available stats before adding crypto assets to their portfolio. Very often it's technical analysis that comes in handy. We prepared technical ratings for MANTRA (OM): today its technical analysis shows the neutral signal, and according to the 1 week rating OM shows the sell signal. And you'd better dig deeper and study 1 month rating too — it's sell. Find inspiration in MANTRA trading ideas and keep track of what's moving crypto markets with our crypto news feed.
MANTRA (OM) is just as reliable as any other crypto asset — this corner of the world market is highly volatile. Today, for instance, MANTRA is estimated as 2.72% volatile. The only thing it means is that you must prepare and examine all available information before making a decision. And if you're not sure about MANTRA, you can find more inspiration in our curated watchlists.
You can discuss MANTRA (OM) with other users in our public chats, Minds or in the comments to Ideas.