OM - fib / entry targetsWeekly TF
@ 618 = 0.180 - 0.205 price range.
Would treat this as a long trade with low lvg. 50% up vs 15% down.
@ 786 = 0.05 - 0.07 price range.
Spot buy. 11,000% (to ATH) up vs 37% down.
Weekly RSI moving to oversold would be a good buy signal.
OMUSD trade ideas

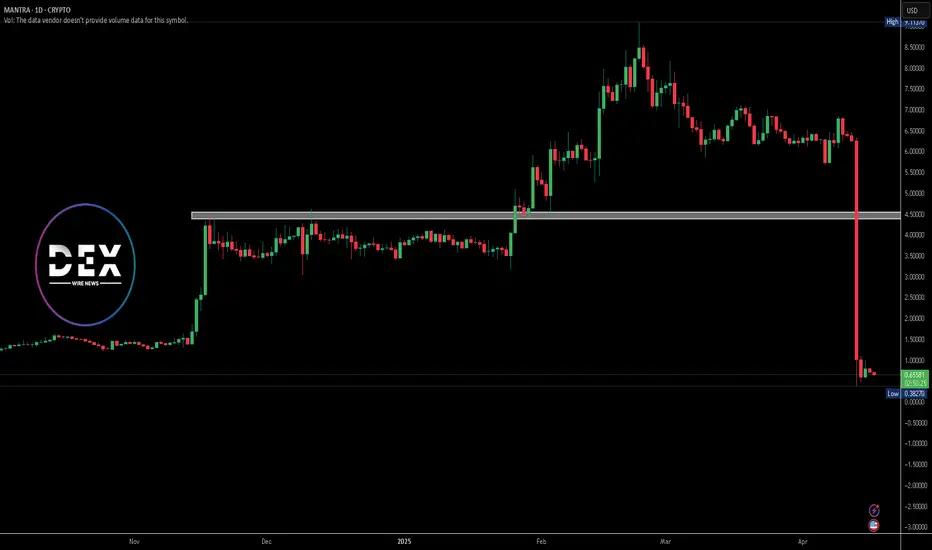
OM pain not over yet!OM as predicted (on my X account) we got a nasty dump and we also got some autobounce reaction on breakout area. Hard to say if this was enough or we make another autobounce from here as we are oversold. In any case I do not see a case for jumping back in now (except maybe for scalp traders), my plan remains - test of S/R at fibb 0.382 range and there we need to see signs of bottoming before deciding to jump back in. Also note that OM is nice canary in the coalmine for other alts (some are already in the middle of pump, some have not even started yet....but big majority of them will go trough same pain process after big pump, so take profits when in green...)

OM ... GOM (mantra) looking quite spicy.
Finding support briefly on the 0.5 fib / $0.35
Could be lining up for a recovery pump after seeing a drawdown of -94% early April 📉
Else moves down to 618 possible. In the meantime keep your fingers and toes crossed 🤞 maybe the crypto God's will be kind.

$VARA LIVE!! Orderflow Pivot Levels BULLISH TARGETS!!!Here are your daily levels guys. A lot of movement on order wall position a few larger ones opened up. Support looks good but I did make note of a small gap between about 5800 and 5000 pips.

Mantra - Send it to Zero with HasteMantra is a low liquidity shit coin with no real use case. The liquidity in wETH in the LP is lower than most memecoins, honestly - check for yourself. The CEO did an interview and admitting to selling OTC orders and pumping his token price bc the liquidity was so low.
The idea is for RWAs, however, there is only a DEX and a coin, no RWAs yet. It's was designed as a pump & dump, and the fat lady is singing.

OM Token Plunges 92% as MANTRA Initiates InvestigationOn April 13, MANTRA’s native token, OM, experienced a dramatic 92% drop in price, plummeting from over $7 to just $0.66. The sharp fall occurred around 18:28 UTC during a period of low market activity. This sudden crash erased most of OM’s recent gains, bringing the weekly loss to -89.73%. As of now, OM trades at $0.6591 with a daily decline of 9.68%. The token holds a market capitalization of $634.76 million, with 24-hour trading volume at $387.43 million, reflecting a 42.99% drop.
MANTRA’s CEO, John Patrick Mullin, addressed the incident, clarifying that the collapse did not stem from any internal activity. He blamed the crash on “reckless forced closures” by centralized exchanges. Although no exchange was named, Mullin expressed concerns over the influence and decision-making power of these platforms, particularly during low liquidity windows such as Sunday evenings.
In response to the unexpected decline, MANTRA launched an internal investigation to identify the root causes and verify the token’s current circulating supply. To restore investor confidence, the project also announced a token buyback and burn program. These actions aim to support holders and reinforce OM’s long-term stability.
Technical Analysis
The OM/USDT chart reveals aggressive selling pressure signaling panic selling. After peaking near $9.11, the price sharply reversed, erasing months of gains. The absence of any meaningful volume during the crash suggests that liquidity dried up rapidly, leading to cascading liquidations. The price now hovers around a potential psychological support zone, but sustained recovery will depend on renewed demand and market confidence.
OM Mantra Dao: $0.59 | Key Levels for Re Entry or Buy Buy Backmarkets placements go round as Buffet would say
goes from one pocket to another or the patient one
greed is validated
fear is all over
another opportunity
for reset or BUY BACK by informed pals
wait wait wait
--
TRUMP was the beginning of the decline or recent TOP
MANTRA may just be the bottom signal of market

OMUSD - Monthly Channel IndicatorOn the monthly chart this dump is shown as just a retest of the Gaussian Channel indicator which price is still above.
Very big move which could shake a lot out.
If you are long on this Monthly you should not be very worried. Unless the intensity of the downward move is too much.
Monthly chart.

OMUSD - Big DumpA massive move downwards on this Weekly timeframe
I think still however support can be found and the overall upward phase on the longer term trend line can resume
Could be a massive buy the dip scenario
Reminds me in some ways of the LUNA crash however
I would wait till the the price label point is hit before entering on this long timeframe

Best position , super trendsuper trend,
Moving towards the $10 target
Flight to the top ten currencies of the market

The Power of HODLINGMANTRA ( NASDAQ:OM ) has been making waves in the crypto market, not just for its price surge but for the incredible profit booked by a savvy trader. This feat has drawn the attention of investors worldwide. A reported $6 million profit from trading NASDAQ:OM has sparked interest and speculation about the coin's future, as well as its potential to deliver significant returns. Let's explore both the technical and fundamental aspects driving this market activity.
The Million-Dollar Trade
A crypto trader, identified by the wallet address "0xdc2," achieved a staggering return on investment (ROI) of 161X within approximately 10 months. The trader bought OM tokens at an average price of $0.026 and recently sold 600,000 tokens on Binance for a profit of $2.49 million, highlighting their total profit of $6.28 million.
This trade underscores the potential of holding onto a coin for strategic periods and taking advantage of market conditions. However, it also raises concerns about sell pressure in the wake of significant dumps.
Market Confidence Despite Sell-Off
Despite the dump, NASDAQ:OM maintained upward momentum, reflecting strong market confidence. A 26.58% price increase over 24 hours saw the token trading at $4.15, with trading volume surging 33% to $771.50 million.
Altcoin Market Sentiment
The overall positive sentiment in the altcoin market, with the crypto market cap breaching the $3 trillion mark, has helped bolster NASDAQ:OM 's price.
Futures Open Interest Growth
MANTRA Futures Open Interest surged by 53%, indicating increased investor activity and hinting at further potential price gains. This is a critical indicator of the token's growing appeal among traders.
Technical Analysis
NASDAQ:OM reached a 24-hour high of $4.47 before slightly retracing to $4.15, marking a consolidation phase after its sharp rise. The Relative Strength Index (RSI) stands at 90, indicating overbought conditions. While this suggests the potential for a short-term correction, it also reflects heightened buying pressure.
The large-scale token dump may trigger sell-offs by smaller investors, potentially leading to a short-term dip. However, the broader market sentiment and rising Futures Open Interest could mitigate this impact.
A Lesson for Traders
The $6M profit story serves as both inspiration and caution for traders. Strategic holding and avoiding FOMO (Fear of Missing Out) can lead to substantial returns. It reflects on a missed opportunity, when i sold sold a memecoin at a $3M market cap, only to watch it climb to $300M later.
This highlights the importance of conducting thorough research and believing in your investments while being mindful of market conditions.
Conclusion
MANTRA ( NASDAQ:OM ) continues to capture the attention of traders and investors alike with its significant price movements and market activity. The coin's ability to hold steady after a massive sell-off and its impressive Futures Open Interest growth hint at its strong potential in the crypto space.
While short-term fluctuations are expected, NASDAQ:OM 's broader market confidence and fundamentals position it as an asset worth watching. For savvy traders, the mantra is clear: patience, research, and timing are key to unlocking the full potential of crypto investments.

OMUSD , bull, long, so simpleThe white oscillation range has broken through the upward trend, and there are still two oscillation ranges left

MANTRA _ Side Waves Breakout & Target is 1.739594 USDSide Waves or Box formed and Breakout. Next Target is the Box Size, price at 1.739594 USD and Trading in All-Time High. Offering a Chance to Make +55% Percentage Profit.
Follow & Support me; I want to Help People Make PROFIT all over the "World".

OMUSD Breaking out. Catch it if you can!Mantra (OMUSD) broke today above the top of its Rectangle, which has been the pattern it consolidated in since late March. The recent low of May 30 was supported just above the 1D MA100 (green trend-line) and that initiated the current rebound.
This is not very different than the March 04 break-out, which after holding its 0.5 Fibonacci retracement level, it started an aggressive rally towards the 5.0 Fibonacci extension, registering a +360% rise. This gives us our current Target at 2.800.
-------------------------------------------------------------------------------
** Please LIKE 👍, FOLLOW ✅, SHARE 🙌 and COMMENT ✍ if you enjoy this idea! Also share your ideas and charts in the comments section below! This is best way to keep it relevant, support us, keep the content here free and allow the idea to reach as many people as possible. **
-------------------------------------------------------------------------------
💸💸💸💸💸💸
👇 👇 👇 👇 👇 👇

RWA TokenizationTime and again, I've stressed the significance of #RWA projects, with
OM
occupying a prominent position as my second largest investment. Here's what sets it apart:
Robust token utilities and real world use case
Great staking rewards.
OM
's pivotal role as the main chain token.
The vast potential of the RWA tokenization market.
A bright future awaits, fueled by a dedicated team.
Their MANTRA is to remain hungry always
Don't underestimate the early stages—you don't want to miss out. $2 is within reach!

OMUSDT Potential Breakout Structure📊 BINANCE:OMUSDT is currently nestled in the tight base of a Falling Wedge pattern. Keep a close eye on the support level around 0.017, as a critical price to break sits at 0.024. Key resistances and upcoming targets are at:
🎯 Targets:
Target 1: 0.036
Target 2: 0.057
Target 3: 0.084
Target 4: 0.123
Regardless of the market situation, remember to use appropriate stop loss. A prudent approach is to set the stop loss below the support zone, with a weekly candle closing around 0.016 as a viable option.
Stay vigilant and keep an eye on the charts! 🚀

$OMUSD Bullish Parallel UptrendCRYPTO:OMUSD is in a Bullish Parallel Uptrend, wait for this to break before shorting or taking profits.
In technical analysis, a parallel uptrend refers to a price movement pattern where the highs and lows of an asset's price form parallel lines on a chart, indicating a consistent upward trend. Here are some key characteristics and considerations related to a parallel uptrend:
1. **Parallel Lines:** The trendlines drawn along the highs and lows of the price chart run parallel to each other, suggesting a steady and sustainable upward movement.
2. **Higher Highs and Higher Lows:** In a parallel uptrend, each successive high is higher than the previous one, and each successive low is also higher than the previous low. This pattern signifies a series of ascending peaks and troughs.
3. **Support and Resistance:** The parallel lines serve as dynamic support and resistance levels. The lower line typically acts as support, preventing the price from falling too far, while the upper line acts as resistance, capping the upward movement.
4. **Trend Confirmation:** Traders often look for additional indicators, such as moving averages or volume analysis, to confirm the strength of the parallel uptrend.
5. **Duration:** The duration of a parallel uptrend can vary, and traders may use different time frames (daily, weekly, etc.) to analyze and confirm the trend.
6. **Trading Opportunities:** During a parallel uptrend, traders may consider looking for buying opportunities near the lower trendline or during pullbacks, anticipating that the upward momentum will continue.
7. **Caution:** While parallel uptrends can present favorable trading conditions, it's essential to exercise caution and use risk management strategies. No trend lasts indefinitely, and trends can reverse.
Remember that technical analysis is just one approach to analyzing financial markets, and it's essential to consider other factors, including fundamental analysis and market sentiment, for a comprehensive view. Additionally, past price movements do not guarantee future performance, so it's crucial to stay informed and adapt to changing market conditions.

the 1st wave is startingcrab harmonic pattern:
X=$79.6
A=$0.608
AB=0.38 XA
BC=0.88 AB
0.78 BC=$0.561
0.88 BC=$0.716
1.6 BC=$4.24
2 BC=$10.73
0.78 XA=$17.14
2.24 BC=$19.23
0.88 XA=$35
2.6 BC=$48.2
1.13 XA=$202
3.6 BC=$547
1.27 XA=$560
1.41 XA=$1508
1.6 XA=$6709

UMUSDT | Buy on Break StrategyOMUSDT is currently on correction phase after it breaks from an inverse Head & Shoulders pattern. Watching for a potential 50% upside on this coin.
Cheers!
