Omusdt long to 0.33 today!Just a while ago went into OMusdt long. Expecting a pump today all the way up to 0.33 area
Market looks to be aiming for the prior daily LH, supply area.
4hr,1hr trend flipped back bullish already.
Roughly 4rr
Time sensitive
OMUSDT trade ideas

Mantra (OM) Coin – Key Fibonacci Levels & Cycle InsightCurrent Technical Levels (Support Zones):
0.2525 – Strong Resistance
0.2237 – Minor Resistance / Potential Flip Zone
0.1813 – Key Support
0.1669 – Deep Pullback Level
0.1518 – Final Guard Support
0.0991 – Extreme Support (High-Risk Reversal Zone)
Cycle Timing:
Next Key Date: After 14-day cycle completion
Watch for price reaction and reversal structure near major levels.
Historical patterns suggest market tends to shift direction after the second level is broken.
Technical Outlook:
Fibonacci levels are drawn on the higher time frame to capture broader structure.
Lower time frame candles may show early breakouts, but true confirmation often occurs only after second-level violation.
Patience and timing are critical — wait for price rejection or confirmation near major zones.
Enter the Trade After Trendline Breakout

Om upMost bullruns end with complete irrationality. People will chase pumps and abandon coins that do nothing. OM will be in my eyes the coin that will end this bullrun.

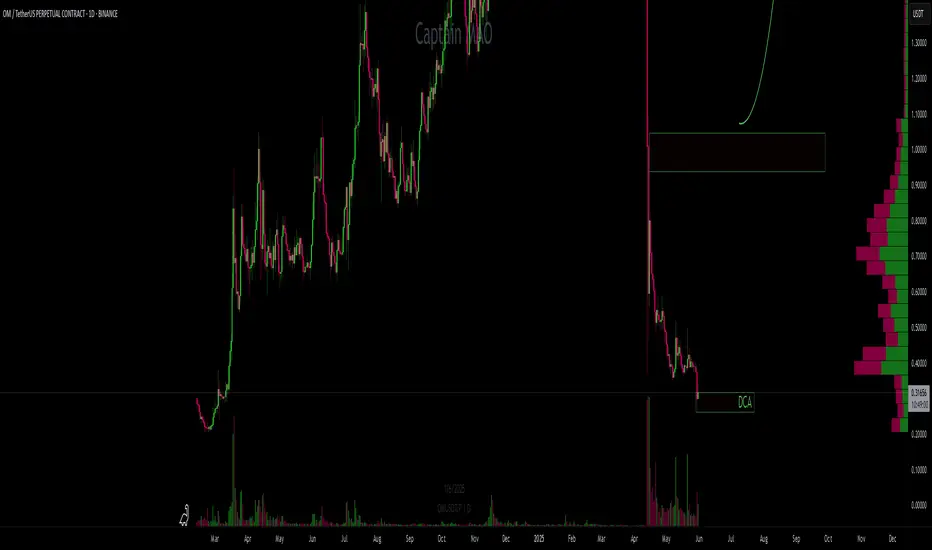
OM/USDT mid-long trade OM has recently experienced a flash crash, dropping 95–97% from its all-time high, and is now sitting at a market cap of around $300M.
Despite the brutal correction, a positive sign is that the team remains active and committed to recovery efforts — a green flag in a sea of red.
From a risk-reward perspective, this presents a potentially high-upside opportunity. I’m starting to DCA (dollar-cost average) at current levels, looking for signs of accumulation and early momentum shifts.
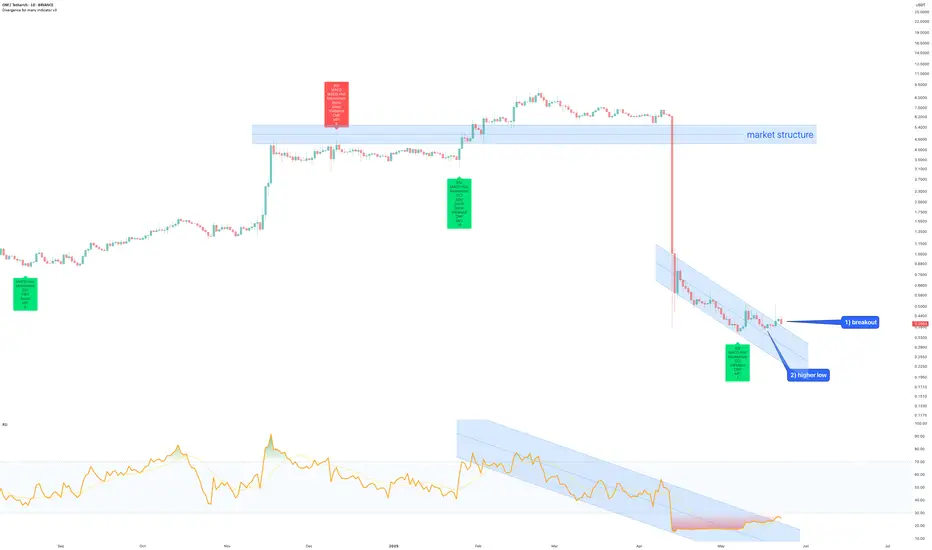
Mantra token (OM) to $4 on return to market structure40 days ago on April 13th price action corrected 95% (if this is not enough convince you the Crypto tokens are a Ponzi scheme I don’t know what is), a number of reasons now exist for traders to open a long position into the remaining sell orders of the once project faithful. The reasons?
1. Price action and RSI resistance breakouts.
2. Trend reversal, price action prints a higher low.
3. A rally followed on the same bullish divergence configuration that printed throughout the history of this token. That positive divergence has printed once more.
4. The forecast is formed on the idea price action returns to market structure before continuing the downtrend. Was about to say nothing goes down in a straight line ;-)
Is it possible price action continue to correct? Sure.
Is it probable? No.
Ww
MantraDAO Easy 810% Target —Sell High, Buy Low!Just as selling and profit taking happens naturally when prices trade high near a new All-Time High, buying also happens naturally at support.
OMUSDT was trading at a new All-Time High in February 2025 and smart traders and holders took profits. This taking profits results in a long-term higher low and a new buy-opportunity.
Always remember, never buy when prices are high up or after a strong bullish wave. Why? Because whales tend to sell when prices are high. Only buy when prices are low.
OMUSDT is trading pretty low right now compared to February 2025. We had 96% correction, but the correction bottom is still a very strong higher low compared to the start of the bullish cycle and wave. After the correction is over, which in this case is early May, we will have a new growth wave.
Easy target can be seen on the chart as 810%.
It can go higher and this is a new All-Time High. We are going with the easy target for this one. An easy trade.
Namaste.

OM volatility OMUSDT experienced extreme volatility due to a recent liquidation event. Currently, the short-term outlook is leaning bearish.

Mantra's -90% Liquidation event: Why Market-Wide Danger LoomsLast night (April 13th) the Mantra (OM) project saw its market capital drop from $6.11B to $419m!
============================================
From the team
============================================
JP Mullin (CEO of @MANTRA_Chain) remarks at BTCON RWA Summit today on CRYPTOCAP:OM price action overnight
• No exploit or hack
• No active selling from MM or investors
• Large investors using CRYPTOCAP:OM as collateral were liquidated, which caused drastic price action
• No profit taken from insiders including team members”
After the 95% correction they said:
“We want to assure you that MANTRA is fundamentally strong.”
Would you say that if Apple dropped 95% overnight?
============================================
The Official reason – A liquidation event
============================================
“There was a massive, forced liquidation from a large OM investor on a CEX. Still working on the details, but we are here, and we're fixing this.”
============================================
Could Technical analysis have foreseen this?
============================================
The correction depth? No, targets like this cannot be forecast. However, the loss of support and market structure was evident on March 26th. Price action was up 450x at this point, greed is the only reason profits were not taken.
If indeed investor confidence has not be destroyed from such an event, look for support around 30 cents. There is no recovery from an event like this until a significant consolidation period.
============================================
Why is this a danger to the whole market?
============================================
Have never be shy on the fact the entire crypto space is a Ponzi scheme. A promise you can make wealth from speculation. The outsized use of leverage compared to spot makes that evident. The number of messages Without Worries continues to receive from folks who have lost meaningful sums of money using Leverage and Futures products has been constant over the past several years. It is frustrating as it is heartbreaking.
If a liquidation event can cause a spot market to drop 95% then the question is, can this happen elsewhere?
369.78K - That was the trading volume for Bitcoin across the entire market these past 24hrs.
528.185K - The current amount of Bitcoin held by Micro Strategy on Leverage.
Average Cost per BTC: $67,458.00 or just $17k below current market prices.
strategytracker.com
"Michael Saylor's company was on a Bitcoin buying spree. Soon it might need to sell"
qz.com
If debtors demand repayment of their loans to Micro strategy, loans that used his Bitcoin as collateral (the irony), forced Bitcoin liquidation has to occur. This fund could wipe out the 24hr trading volume with ease. What do you think such an event would do the whole market?
The recent events on Mantra serves as an excellent example of why the spot market is no longer in control of price discovery. This is a fully fuelled leveraged bubble approaching margin call.
Stay safe, stay wise, and stay away from leverage!
Ww

OM scalp short to $0.5130Om scalp short .
Market likely to fall lower to $0.5130 according to my DTT strategy.
Roughly 2 RR potential
Trend trade.
Supply coming in

FINAL LEG OF THE ZIGZAG CORRECTION ?Yello, Paradisers! Are we about to see the end of this correction, or is there still one more shakeout coming? Let’s break it down.
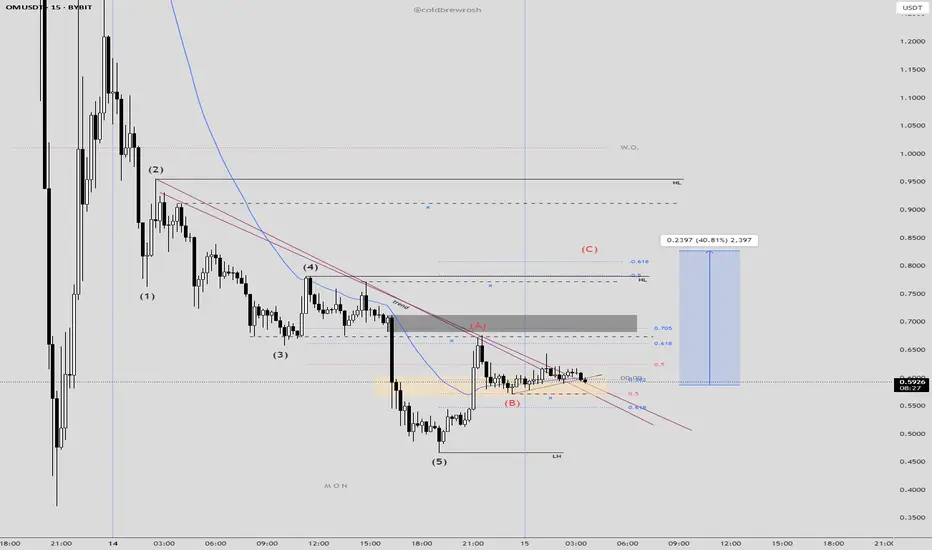
💎The market is currently unfolding within a Zigzag Correction (A-B-C) pattern, and we appear to be in Wave C the final leg of this structure. Wave A has already played out with a sharp downward move, followed by Wave B, which acted as a countertrend rally. Now, Wave C is in progress, forming the last phase of this corrective cycle.
💎Since this is a 5-3-5 Zigzag Correction, the third wave of Wave C has already developed, meaning the market is nearing a critical Demand Zone at 4.0283. This level is a strong support zone where a potential reversal could occur. If the price reacts positively from this area, it could mark the end of the correction and signal the beginning of a new bullish phase, starting Wave 1 of the next uptrend.
💎However, if the price remains trapped between the Moderate Support and Moderate Resistance zones, we may see an extended period of sideways consolidation before any decisive move. A key confirmation to watch is the RSI approaching oversold conditions, which would indicate that downward pressure is weakening and the probability of a bullish reversal is increasing.
As always, Paradisers, the key to profiting in this market is waiting for high-probability setups. If this correction is indeed ending, the next move could be explosive. Stay sharp, stay disciplined, and trade smart!
MyCryptoParadise
iFeel the success🌴

Analysis MANTRA (OM)Update on MANTRA price analysis:
The price is stuck in a downward channel and below the order block. If it breaks out of the downward channel and the order block, it has the potential to rise up to $0.70.

omIt's weekly
It can be checked here but be careful
Because it can't hold itself, the blue lines are the next point

Where Can We Rebuy OM? (1W)After the heavy drop, it became evident that a bearish trend had started, and the price is now seeking high-liquidity (buy) zones.
Based on the chart, the green zone stands out as the best area for a potential rebuy — it could launch the price upward by 100% to 500%.
Reaching this zone may take several weeks or even months.
A weekly candle closing below the invalidation level would invalidate this outlook.
For risk management, please don't forget stop loss and capital management
Comment if you have any questions
Thank You

a river no trader wants to cross.NASDAQ:OM is teetering.
The waves down are forming — a river no trader wants to cross.
Downtrend confirmed.
Liquidity zones broken.
Fibs point to 0.23.
You’ve been warned.
🩸⚔️
**Technical damage is real:
•OBs (Order Blocks) flipped bearish
•FVGs (Fair Value Gaps) wide open below
•No real bullish reaction at key zones
•Momentum bleeding off every bounce**
I’ve seen this movie before:
• VIE:LUNA before the collapse
• SEED_DONKEYDAN_MARKET_CAP:SFP after it faked strength
• FWB:ACH melting after fake-outs
When the structure breaks this bad, it’s not a dip. It’s a landslide.
Early pain looks “small.”
Then you get trapped.
Water wears down rock by persistence, not violence.
Waves keep coming until your hope is underwater.
By the time it looks obvious, it’s too late.
Without a miracle reversal at 0.3700, the flow is down.
0.2329 is the magnet.
Maybe lower.
Respect the river, or get dragged.
🩸⚔️

Om short back to $0.5955Just now opened a short position on $om. Am expecting a sell off back to $0.5955 tonight. Starting right about now.
Time sensitive.
Setup aligns with my DTT methodology

Analysis MANTRA(OM)On the 1h timeframe, the price is stuck in the range channel, which could see good growth if the blue resistance is broken.

After a -90% Dump, MANTRA(OM) Finds Support!!!Today, I want to analyze the MANTRA ( BINANCE:OMUSDT ) projec t for you, which fell by more than -90% on April 13 .
What is MANTRA(OM)?
MANTRA (OM) is a DeFi + RWA (Real World Assets) focused project aiming to bring real-world assets like real estate and bonds on-chain. Built with the Cosmos SDK, it’s developing a purpose-built layer-1 chain to facilitate tokenization and institutional adoption of RWAs.
The main crash reasons:
Massive forced liquidations on exchanges
90% of the token supply reportedly held in a single wallet
Rumors of a rug pull (which the team denied)
Team Response:
MANTRA’s team has launched an internal investigation
Plans for buybacks and token burns are underway
They reassured the community that team tokens remain locked and untouched
-----------------------------------
Technical Analysis:
Now let's take a look at the MANTRA(OM) chart on the 1-hour timeframe .
After the fall on April 13, MANTRA(OM) reacted to the Heavy Support zone($0.45-$0.20) and started to rise again (upward correction) .
From the perspective of Elliott Wave theory , MANTRA(OM)'s big fall can be considered as a main wave 3 , and it seems that MANTRA(OM) is completing a main wave 4 . The main wave 4 could be a Double Three Correction(WXY) . Since the momentum of the main wave 3 was high, there is a possibility that main wave 5 will be a Truncated type .
I expect MANTRA(OM) to start rising from the Potential Reversal Zone(PRZ) and rise to at least $0.76(+30%) ( First Target ) and then attack the Resistance zone($1.10-$0.84) ( Second Target(+60%) ).
Do you think the MANTRA(OM) project can return to its good days?
Note: If the MANTRA(OM) falls below $0.500(Round Number), we can expect further declines.
Please respect each other's ideas and express them politely if you agree or disagree.
MANTRA Analyze (OMUSDT), 1-hour time frame.
Be sure to follow the updated ideas.
Do not forget to put a Stop loss for your positions (For every position you want to open).
Please follow your strategy and updates; this is just my Idea, and I will gladly see your ideas in this post.
Please do not forget the ✅' like '✅ button 🙏😊 & Share it with your friends; thanks, and Trade safe.

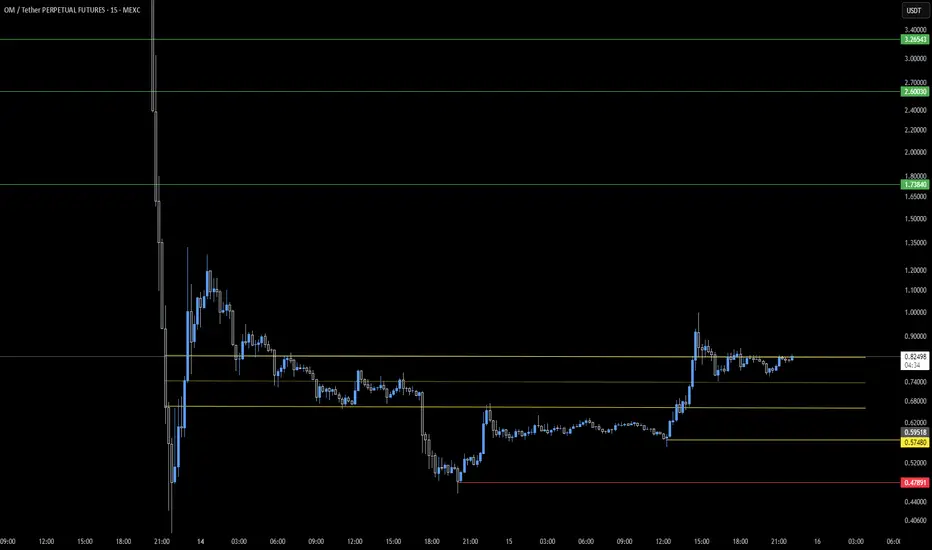
Phemex Analysis #73: Pro Tips to Trade OM Upon the 90% CrashMANTRA (OM) experienced a dramatic price crash of over 90% last Sunday (April 13th). While many initially suspected a "rug pull" event, similar to what happened with Luna and FTX, OM Founder JP Mullin attributes the massive sell-off to forced liquidations at an exchange, triggering a panic sell-off. While the exact cause of this 90% crash is still unconfirmed, this volatility presents significant trading opportunities.
We suggest that traders use smaller time frames, such as 1-hour or 15-minute charts, to identify more trading opportunities in this volatile situation.
Here are possible scenarios on the 15-minute chart:
Possible Scenarios
1. V-Shaped Recovery
If strong buying pressure emerges and quickly pushes the price back up to pre-crash levels, it could signal a V-shaped recovery. This would indicate that the market has absorbed the sell-off and buyers are back in control.
Pro Tips:
Watch for large green candles with significant volume on the 15-minute chart, that rise above $0.89 or $1.0.
Consider entering a long position on the breakout above key resistance levels ($0.89 & $1.0).
Place a stop-loss order below a recent swing low to protect against a reversal.
2. Consolidation and Accumulation.
The price may consolidate in a range after the crash, as the market tries to find a new equilibrium. This consolidation phase could represent a period of accumulation, where buyers are slowly absorbing the remaining supply.
Pro Tips:
Identify key support and resistance levels within the consolidation range, which is $0.89 to $0.73 or $1.0 to $0.55.
Consider range-bound trading strategies, such as buying near support and selling near resistance.
Alternatively, use Phemex Grid Bots to capitalize all the small price movement during the accumulation phase.
3. Further Decline
If the selling pressure continues or new negative information emerges, the price could decline further. This scenario would be characterized by continued large red candles and a lack of significant buying interest.
Pro Tips:
Monitor key support levels ($0.73, $0.55 & $0.45); a break below these levels could trigger further selling.
Consider exiting any long positions to avoid further losses.
Be cautious about entering new long positions until a clear bottom has been established.
Consider shorting opportunities if the price breaks down through significant support, but manage risk carefully.
Conclusion
The 90% crash in MANTRA (OM) has created a highly volatile trading environment. While the cause of the crash remains debated, the current market conditions offer substantial trading opportunities. By analyzing price action on smaller time frames, such as the 15-minute chart, and considering the scenarios outlined above, traders can potentially profit from both upward and downward price movements. However, it is crucial to exercise caution, manage risk effectively, and stay informed about any new developments related to MANTRA (OM).
Pro Tips:
Elevate Your Trading Game with Phemex. Experience unparalleled flexibility with features like multiple watchlists, basket orders, and real-time adjustments to strategy orders. Our USDT-based scaled orders give you precise control over your risk, while iceberg orders provide stealthy execution.
Disclaimer: This is NOT financial or investment advice. Please conduct your own research (DYOR). Phemex is not responsible, directly or indirectly, for any damage or loss incurred or claimed to be caused by or in association with the use of or reliance on any content, goods, or services mentioned in this article.

OM Coin - Last Status!All targets are on the table in OM. As long as there is no daily close below our yellow support box below, the direction is up!
OM scalp long to $0.6751 areaJust now opened a scalp long on OM. Markets moving slow so testing the lower tf with my DTT strategy.
Lets see.

Mantra (OM/USDT) Market Update – April 15, 2025Mantra (OM/USDT) Market Update – April 15, 2025
The Mantra (OM) token has undergone a significant market correction, falling nearly 90% from its peak of $9 to a current support level of approximately $0.37. This sharp decline has triggered widespread panic among investors, leading to massive sell-offs and liquidations that swept billions of dollars from the market. While alarming, such drastic movements are not new to crypto markets and are often a part of broader market cycles.
This type of market behavior has been seen before with major tokens such as XRP, where early investors chose to take profits after substantial rallies. When these large sell-offs occur, they often lead to temporary collapses in price as the market adjusts. What’s happening with OM right now seems to reflect that same pattern — early profit-taking combined with general market uncertainty has created an environment of fear and doubt.
Currently, $0.45 is emerging as a key level of interest. If OM can consolidate above this level and attract renewed buying pressure, a recovery could be on the horizon. Based on Fibonacci retracement levels from the previous highs, OM has the potential to reach $1.40 (0.382 Fib), $2.00 (0.5 Fib), and even $3.00 (0.618 Fib) in a bullish scenario. These levels could serve as potential resistance points where short-term profit-taking may occur during any recovery.
On the flip side, if OM fails to hold above the $0.45 support level, there is a strong possibility of further downside. A confirmed break below this level could send OM down toward the $0.20 range, where it might find the next solid area of buyer interest. This would represent an additional drop in value but may also serve as the bottoming point for the current cycle, assuming broader market conditions stabilize.
Given the current uncertainty, it’s important to remember the old trading adage: “Don’t catch a falling knife.” Buying during heavy downtrends, especially without any confirmation of a reversal, can lead to more losses. Instead, the safer and more strategic approach is to wait for signs of market structure forming — such as higher lows, increased volume, or resistance breakouts — before entering a position.
For seasoned traders, shorting in this kind of market can be profitable, but it requires precise timing and a clear strategy. Entering shorts too early, especially in a market known for sudden spikes and fakeouts, can be just as dangerous as buying prematurely. Risk management and patience are key in navigating a bearish environment like this.
Mantra (OM) is in the midst of a steep correction, but these phases are not uncommon in the crypto world. Holding above $0.45 could lead to a strong bounce, but a breakdown might push prices lower before any recovery begins. Right now, caution is advised. Let the market settle, watch the levels, and wait for confirmation before making any bold moves.


$OM LongIm taking a long position on OM that is very risky once market collapse 92% but i see a potential reverse into the cents are a increase of 40% will be nice, afteer the break of a downtrend