OMUSDT trade ideas

$OM LongIm taking a long position on OM that is very risky once market collapse 92% but i see a potential reverse into the cents are a increase of 40% will be nice, afteer the break of a downtrend
$OM Mega bullish recoveryCRYPTOCAP:OM suffered a sell off based on nothing theres was nothing made by the owners. Only manipulation and fear expect this coin to recovery at leat 38%

OMUSDT CHART ANALYSİS - EDUCATIONAL POSTDiscover what an NFT is and what all the hype is that's surrounding the space.
An NFT, or non-fungible token, is a unique, digital certificate stored on a blockchain. This guarantees the originality of any item, giving the owner exclusive rights to it. Such tokens cannot be discreetly tampered with, split, or replaced because of the nature of the blockchain structure and anonymous encryption technology.
Therefore, this system is best suited for securing rights to a unique object — a work of art, real estate, an artifact in a computer game, or something similar. This article will help you understand the peculiarities of the NFT concept and learn about the most expensive and unusual non-fungible tokens since their creation.

Is Mantra OM The Next Luna?Hello, Skyrexians!
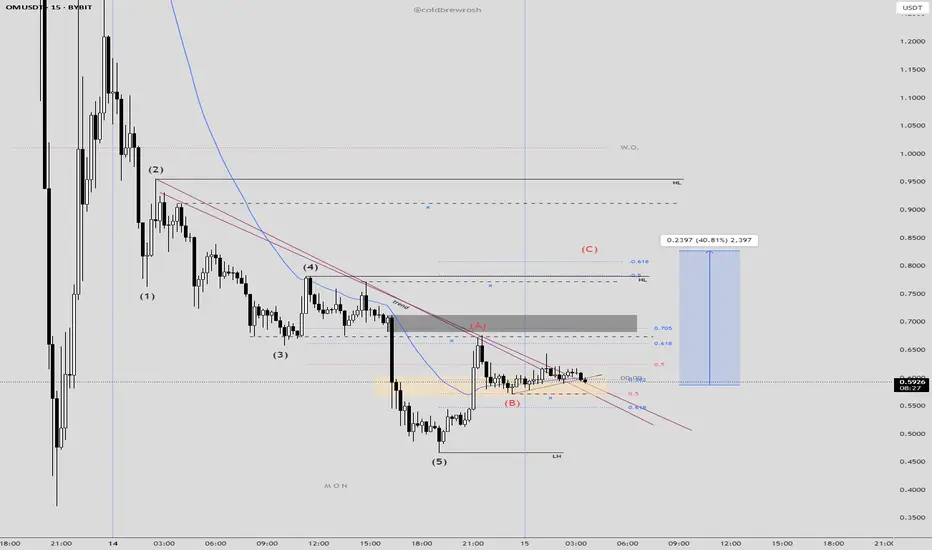
This Monday was calm until the huge drop on BINANCE:OMUSDT has not interrupted us. In 1 hour price dropped more than 80% and now Mantra's holders are panicking is this coin scam or not. It's almost useless to have any strong technical analysis, but as we know this coin dropped because of rug pull. In case of Luna scam we have seen the infinite coins printing, so its price became 0. OM only has the negative news without any algorithmic issues.
We can only apply Fibonacci levels on the log scale and we can see that there is a chance that this is only the wave A inside 2. If $0.2 will be held we can have a chance for the scenario on the chart, otherwise it's scam!
Best regards,
Skyrexio Team
___________________________________________________________
Please, boost this article and subscribe our page if you like analysis!

From LUNA to OM ??From LUNA to OM — Déjà Vu or Just Another Rug?
Left: VIE:LUNA collapse in May 2022
Right: CRYPTOCAP:OM crash in April 2025
📉 -92.45% vs -94.13%
💀 History doesn't repeat, but it sure rhymes.
🕵️ Both crashes triggered by mass sell-offs.
👀 Some OM wallets tied to insiders.
😬 "Decentralized" or just centralized exit liquidity?

OM/USDT: what happened?Hello friends
Due to the heavy price drop, many holders of this currency fell into extreme fear, but according to the price chart, you can see that after this stunning growth, the price correction should finally happen.
Now, if you are risk-averse, you can buy in steps within the specified support areas and move with it to the specified targets, of course, with capital and risk management.
*Trade safely with us*

Breaking: MANTRA coin ($OM) Nosedived Nearly 100% Today MANTRA, a Security first RWA Layer 1 Blockchain, capable of adherence and enforcement of real world regulatory requirements that is Built for Institutions and Developers, offering a Permissionless Blockchain for Permissioned applications saw its native token Mantra Coin ( CRYPTOCAP:OM ) plummeted 94% today amidst falling out of a bearish symmetrical triangle.
The bloodbath came as a shock as days ago it was sitting on a market cap of $6 Billion and major deals were iterated, including a $1 Billion tokenization pact with DAMAC.
However, the main trigger was an allegedly suspicious 3.9M CRYPTOCAP:OM deposited (linked to team wallets) to OKX, fueling sell-off fears.
Key Allegations
Team controls ~90% supply – raising manipulation concerns.
Undisclosed OTC deals – tokens reportedly sold at 50% discounts.
Exchange liquidations – forced closures worsened the crash.
However, Binance CEO Said:
"OM CRYPTOCAP:OM 90% price crash was due to massive cross-exchange liquidations, tokenomics changes, and large token dumps".
In response to an X post, the Mantra team said:
"we want to assure you that MANTRA is fundamentally strong. Today’s activity was triggered by reckless liquidations, not anything to do with the project. One thing we want to be clear on: this was not our team. We are looking into it and will share more details about what happened as soon as we can."
Technical Outlook
As of the time of writing, CRYPTOCAP:OM is down 28.6% according to the 4 hour price chart. the asset is showing signs of a reversal but the diamond hands are weak prior the extreme token sell-off as hinted by the RSI at 11.51, this is extremely oversold with a possible reversal lurking around the corner, should the team figure out the cause of the bloodbath, CRYPTOCAP:OM might reclaim $1 zone and then possibly the $5 price point.
With the market cap presently $697 million, CRYPTOCAP:OM has enough strength for a bounce back after the mainstream crypto market might have digest the news.
MANTRA Price Live Data
The live MANTRA price today is $0.719974 USD with a 24-hour trading volume of $2,499,155,492 USD. MANTRA is down 88.55% in the last 24 hours. The current CoinMarketCap ranking is #81, with a live market cap of $697,898,136 USD. It has a circulating supply of 969,337,399 OM coins and the max. supply is not available.

The Spring of OM: Wyckoff Signals a Rebirth After the CrashMANTRA ( BYBIT:OMUSDT.P ) Technical Analysis: Post-Crash Recovery and Wyckoff Accumulation Insights
TradingView
On April 13, 2025, MANTRA (OM) experienced a significant price drop, declining approximately 88% within 24 hours. This sharp downturn was attributed to a combination of factors, including market-wide volatility and potential large-scale sell-offs. Despite this abrupt decline, technical indicators suggest that OM may be entering a Wyckoff Accumulation Phase, presenting potential investment opportunities.
Understanding the Recent Price Movement
Following the crash, OM's price stabilized around $0.70, with a 24-hour trading volume exceeding $2.3 billion. The Relative Strength Index (RSI) and Commodity Channel Index (CCI) indicators both entered oversold territories, indicating a potential for price reversal.
CoinMarketCap
CentralCharts
Wyckoff Accumulation Phase Analysis
The Wyckoff Method identifies specific phases in market cycles, with the Accumulation Phase characterized by large investors ("smart money") buying assets at lower prices. Key features of this phase include:
Selling Climax (SC): A sharp price decline with high volume, as seen in OM's recent drop.
TradingView
Automatic Rally (AR): A quick rebound following the SC, indicating initial buying interest.
Secondary Test (ST): Price revisits the SC level to test support, often with lower volume.
Spring: A false breakout below support levels to shake out weak holders, potentially observed in OM's price action.
Mudrex
Sign of Strength (SOS): A strong price increase with higher volume, signaling the end of accumulation.
Currently, OM's price behavior aligns with the early stages of this accumulation pattern.
Investment Considerations
For investors considering entry points:
Risk Tolerance: Given the recent volatility, only risk capital should be used.
Technical Confirmation: Await confirmation of the SOS phase before significant investment.
Volume Analysis: Monitor trading volumes for signs of increased institutional interest.
Understanding the Wyckoff Accumulation Phase can provide insights into potential market reversals.

OMUSDT - Buy Cycle SpotOMUSDT
buy cycle
Tp@6.332
% bubble ratio
Currently in a negative bubble with fair value at 6.3302
Spot Trading plan:
Start to buy at -90% and below
TP@6.3302

Mantra $OM Welcome to crypto! Why did this happen?CRYPTOCAP:OM just embarrassed the entire RWA space.
90% wiped. Billions gone. All in under an hour.
This wasn’t random — it was coming.
The CRYPTOCAP:OM disaster explained
It started with one wallet.
A massive deposit of 3.9 million CRYPTOCAP:OM hit OKX.
That alone raised eyebrows — but when people realized who it belonged to, things got serious.
The wallet was reportedly linked to the team.
And here’s the kicker:
The OM team controls around 90% of the total token supply.
Team OM pumped price last year
When they move tokens, people notice — and for good reason.
This wasn’t the first red flag.
The CRYPTOCAP:OM community had already been losing trust:
– Quiet changes to tokenomics
– Delayed airdrops
– Alleged price manipulation via market makers
It was all bubbling under the surface.
So when the OKX deposit happened… panic set in.
The market saw it as the beginning of a dump.
And they were right.
Selling pressure started building — fast.
But things spiraled because of one more thing: OTC deals.
There were rumors the team made private token deals at huge discounts —
Some investors reportedly got in at 50% off or more.
That created a perfect storm.
Once CRYPTOCAP:OM dropped below those discounted prices, OTC buyers started cutting losses.
Retail followed. Fear kicked in.
Everyone was racing for the exit.
The chain reaction was brutal.
– Sell-offs
– Stop-losses triggered
– Leverage liquidations
– Liquidity vanished
All in under 60 minutes.
The market collapsed.
Over SEED_TVCODER77_ETHBTCDATA:6B in value gone.
It wasn’t just a price crash — it was a full ecosystem wipeout.
And the worst part?
Most holders had no idea it was coming.
If you’re in crypto, let this be a lesson.
⚠️ Be cautious with tokens where:
– A few wallets control the supply
– Promises get delayed
– The price feels “too stable”
– The team lacks transparency
DYOR isn’t optional anymore.
Final thoughts:
The RWA sector is one of crypto’s most promising narratives.
But events like this?
They damage credibility across the board.
This wasn’t just a rug. It was a trust collapse.
#RWA deserves better.
Thank you, Real World Asset Watchlist
Best regards EXCAVO

$OM MANTRA coin analysis Hi 👋🏻 it's me your " Raj_crypt0 " ..... 💚
will BINANCE:OMUSDT next KRAKEN:LUNAUSD
" Yes , I hope so - 90% new High not possible
I hope it's not possible "
coin already got squeezed at $5/5.5 in weekly to 3 month time frame as weakness we can observe
Upcoming downtrend 📉 target 🎯 is - $0.1
$0.1 / 0.0875 ...... 🎯 Support 💪🏻 let me meet u there 😂
" U have a question ⁉️ does ' alts season ' & ' BULL RUN ' completed - obviously 🙄 ' NO ' "
CRYPTOCAP:TOTAL haven't reached 5T 🎯 - still season was around corner
" Some coins complete early bull , some late _&_ some on time " nothing much ✔️

OMUSDT DEAD OR THE BEST LONG OPP TODAY?I think you would have to be putting a little something at the bottom. Bllod in the market buying with little downside apart from going to zero.
Not a lot of thesis here as timing is also a thing. Forgive me.

OMUSDT: Billions Evaporated — Just Like Your Ex’s Promises!OM just nosedived into the crypto abyss — from moonshot dreams to digital ashes — is there a bottom in sight?
Anyone still buying? Buckle up — this isn’t investing anymore, it’s survival mode.

OMUSDT massive Rug pull!!Market Warning: OMUSDT PLUMMETS 87% in Minutes!
We just saw a massive 87.5% dump on OMUSDT on Binance, crashing from $6.35 to $0.67 in mere minutes. This is NOT normal trading behavior!
This looks like a classic exit scam or insider dump. A huge, sudden sell-off with zero warning, leaving retail investors no chance to react. Someone likely accumulated a large position, artificially pumped the price, and then dumped their holdings for massive profit.
Key Stats (24H):
High: $6.35
Low: $0.6758
Red Flags to Watch Out For in Other Projects:
🚩 No clear utility for the token.
🚩 Low liquidity and a small number of holders.
🚩 Anonymous or unknown development team.
🚩 Rapid listing on exchanges followed by aggressive hype.
🚩 Heavy promotion by influencers without transparent code audits.
Protect Yourself:
⚠️ DO NOT chase green candles blindly!
Stay vigilant and always do your own research (DYOR) before investing in any cryptocurrency. If something seems too good to be true, it very likely is. Be careful out there!

OMUSDT – Strength Amid Market WeaknessWhile the broader market sentiment remains weak, OMUSDT stands out with its relatively positive data and resilience. This kind of divergence often signals underlying strength—and in such cases, hedging with a long position can be a wise move when conditions align.
📌 Key Observations:
Positive Relative Strength: Despite the general downturn in the market, OMUSDT shows signs of stability and strength, which can often precede an isolated bullish move.
Blue Box Importance: The marked blue box represents a strong area of interest. If price consolidates here and gives valid lower time frame confirmations, it could serve as a launchpad for a long position.
Hedging Perspective: In uncertain market conditions, strategic long setups like this can act as a hedge against broader downside risk, especially if risk is defined and entry is confirmation-based.
🧠 Smart Execution Plan:
Wait for LTF Confirmation: Do not rush. Let the price show strength inside the blue box, such as reclaiming key micro-levels with supportive volume.
Monitor Market Conditions: If the broader market turns, OMUSDT could outperform. Inversely, if the whole market sinks harder, a tight stop protects your downside.
Adjust Quickly if Conditions Flip: If price breaks down the blue box with high momentum and fails to reclaim, the idea is invalid. We don't hold hope—we trade facts.
I don't trade based on guesses. Every level you see is placed with professional precision based on carefully tested metrics. That’s exactly why my profile reflects one of the highest success rates around. I only trade setups that make statistical sense—and I always teach my followers to trade like professionals, not gamblers.
Stick with the data. Stick with confirmation. Stick with me if you want to trade like a pro.
📌I keep my charts clean and simple because I believe clarity leads to better decisions.
📌My approach is built on years of experience and a solid track record. I don’t claim to know it all but I’m confident in my ability to spot high-probability setups.
📌If you would like to learn how to use the heatmap, cumulative volume delta and volume footprint techniques that I use below to determine very accurate demand regions, you can send me a private message. I help anyone who wants it completely free of charge.
🔑I have a long list of my proven technique below:
🎯 ZENUSDT.P: Patience & Profitability | %230 Reaction from the Sniper Entry
🐶 DOGEUSDT.P: Next Move
🎨 RENDERUSDT.P: Opportunity of the Month
💎 ETHUSDT.P: Where to Retrace
🟢 BNBUSDT.P: Potential Surge
📊 BTC Dominance: Reaction Zone
🌊 WAVESUSDT.P: Demand Zone Potential
🟣 UNIUSDT.P: Long-Term Trade
🔵 XRPUSDT.P: Entry Zones
🔗 LINKUSDT.P: Follow The River
📈 BTCUSDT.P: Two Key Demand Zones
🟩 POLUSDT: Bullish Momentum
🌟 PENDLEUSDT.P: Where Opportunity Meets Precision
🔥 BTCUSDT.P: Liquidation of Highly Leveraged Longs
🌊 SOLUSDT.P: SOL's Dip - Your Opportunity
🐸 1000PEPEUSDT.P: Prime Bounce Zone Unlocked
🚀 ETHUSDT.P: Set to Explode - Don't Miss This Game Changer
🤖 IQUSDT: Smart Plan
⚡️ PONDUSDT: A Trade Not Taken Is Better Than a Losing One
💼 STMXUSDT: 2 Buying Areas
🐢 TURBOUSDT: Buy Zones and Buyer Presence
🌍 ICPUSDT.P: Massive Upside Potential | Check the Trade Update For Seeing Results
🟠 IDEXUSDT: Spot Buy Area | %26 Profit if You Trade with MSB
📌 USUALUSDT: Buyers Are Active + %70 Profit in Total
🌟 FORTHUSDT: Sniper Entry +%26 Reaction
🐳 QKCUSDT: Sniper Entry +%57 Reaction
📊 BTC.D: Retest of Key Area Highly Likely
📊 XNOUSDT %80 Reaction with a Simple Blue Box!
📊 BELUSDT Amazing %120 Reaction!
I stopped adding to the list because it's kinda tiring to add 5-10 charts in every move but you can check my profile and see that it goes on..

#OMUSDTWhen all the coins were falling
this coin was rising Slowly and quietly, (but that era is over.)
And it seems the whales of this coin are they are slowly leaving from this coin

Trading opportunity for OMUSDTBased on technical factors there is a Sell position in :
📊 OMUSDT
🔴 Sell Now or by Breakout
🪫Stop loss 6.7000
🔋Target 5.0000
📏 R/R 2,2
💸RISK : 1%
We hope it is profitable for you ❤️
Please support our activity with your likes👍 and comments📝

OM MANTRAi waiting fall down (buying area) fibo 0.25 price very discount, cancel if break strong low

OMUSDTmy entry on this trade idea is taken from a point of interest below an inducement (X).. I extended my stoploss area to cover for the whole swing as price can target the liquidity there before going as I anticipate.. just a trade idea, not financial advise
Entry; $6.16194
Take Profit; $6.36209
Stop Loss; $6.09760


OM.SPOT.MONTHLY.MARCH.2025OM.MONTHLY.MARCH.2025
For those who are still holding OM, congratulations, as the cash flow is currently high in OM. Today, I’m sharing a buy signal for OM intended for spot trading.
Format: Spot
Entry: $4.8 - $5.1
Holdtime: 2 months
Target: Above $10
Good luck!
