OM Head and shoulder - Bearish.OM has formed Perfect head and shoulders and will drop below in amrked range from where it can be longed with good risk rewards ratio.
OMUSDT trade ideas

Higher Lows & RSI Divergence Point to UpsideBINANCE:OMUSDT showing bullish divergence on RSI while holding higher lows.
That’s accumulation behavior, not distribution.
If momentum flips above $7.20, upside targets extend to $7.80.

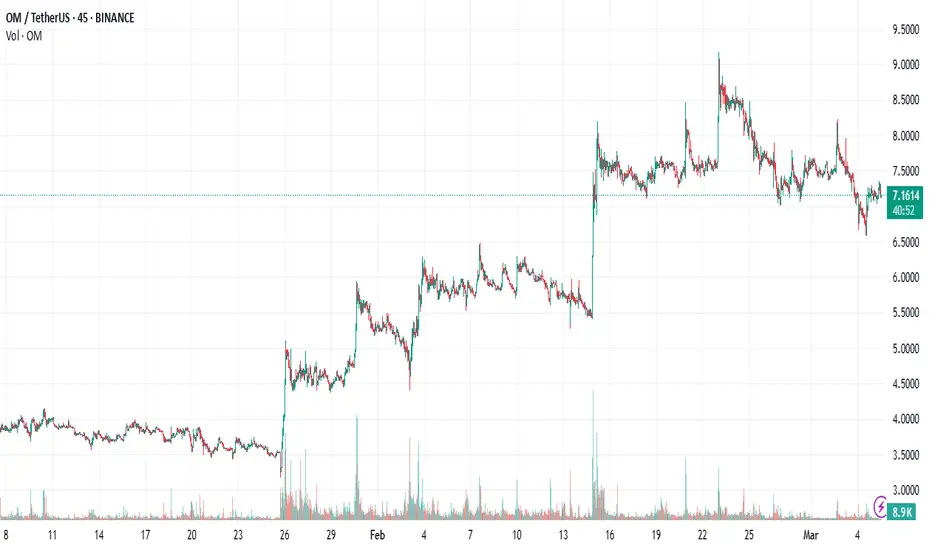
$OM Price Compression: A Big Move Is ComingVolume drying up on NASDAQ:OM as price coils tighter.
$6.60 support and $7.44 resistance are the key levels.
This compression doesn’t last — when one side breaks, expect a violent move.

$OM Demand Zone in Play: Rebound or Breakdown?BINANCE:OMUSDT back in the demand zone between $6.60-$6.80, and buyers are stepping up.
If this floor holds, first target sits at $7.20, followed by $7.50.
Lose it, and $6.30-$6.40 comes into play fast.

$OM’s EMA Showdown: Bulls Eyeing $7.80-$8.00BINANCE:OMUSDT 4H chart is all about that EMA stack.
Price reclaiming the 50 EMA, with 100 EMA just above at $7.30.
Get above both with volume, and it’s clear skies to $7.80-$8.00.

$OM Fakeout: Smart Money Accumulating Below Support?Textbook fakeout on $OMUSDT.
Swept $6.60, flushed weak hands, then immediately reclaimed $6.90.
That’s classic accumulation under support.
Now all eyes on $7.20 — break that and the squeeze begins.

$OM Tests $7.44 Again: Breakout or Rejection?BINANCE:OMUSDT just tapped $7.44 resistance again.
Third test in a week — sellers defending hard.
If bulls can flip it into support, next upside target sits around $8.20.
For now, range-bound between $6.60-$7.44.

OMusdt short.omusdt limit order short.
See chart for details.
Going to bed.
5% risk
Anticipate a break down later on in the morning

OM/USDT : Do you know what is going to happen?hello guys
As you can see, this currency has strong spikes...
Now, according to the latest spike, we have identified good support ranges for you to buy step by step and move with it until the specified goals, of course, with capital management...
*Trade safely with us*

$OM Bullish pennantBINANCE:OMUSDT is currently doing a bullish pennant pattern after an explosive move from 1.67 area. A break of this pennant could send BINANCE:OMUSDT price parabolically to around 6.40 - 6.80 area, measured using the length of the pole in confluence with 2.618 fib level.
In a typical retrace on a continuation move towards the upside, volume tends to dry out, signalling that a move may be due sooner than later. In futures, BINANCE:OMUSDT.P O/I continue to hover around $14M which is a good sign given the sentiment of the market towards premium RWA projects, with a positive L/S ratio.
On the flipside, a break of the lower level will only continue the current ranging move of BINANCE:OMUSDT towards 3.30 - 3.50 area.
Given that the market is still focusing on BTC, BINANCE:OMUSDT will continue to move in a laggard fashion, therefore there is still time to find a long entry near 3.55 - 3.63 area. Once money shifts towards alts, this will propel BINANCE:OMUSDT to new ATHs.
As always, manage your risks.
GL!
- JD

$OMUSDT nearing completion of bullish flag patternBINANCE:OMUSDT is nearing completion of its bullish flag pattern, with the following confluence:
1. FVG Gap filled in confluence with .386 - .5 fib retracement level.
2. Decreasing volume on a pullback
3. Daily Stochastic RSI has bottomed out, and is about to flip towards the upside
Also, metrics show:
4. Margin long/short ratio on Spot steadily increasing from a low of 0.02 last Feb. 24, and is currently at 1.04 (borrowed long > borrowed short)
5. Futures long/short ratio increasing, currently at 0.62 from 0.17 last Feb. 16
6. Decreasing on exchange supply with significant Spot OM token withdrawn from exchange in the last week
Things to note:
7. Daily RSI is been cooling down, currently at 52.99 from an Overbought level of 77.21 last Feb. 23 during ATH price of 9.1051, signaling a continuation of uptrend
8. Daily MACD is currently bearish, with increasing strength, supporting the current short term pullback.
If the price of BINANCE:OMUSDT will breakout from its current bullish flag pattern, next target is set at around 12.24 - 13.14, between the height of the current pole and extended fib level of 2.618

OM/BTC ShortOM has gained attention as one of the premier RWA protocols in the crypto space. OM started at 500m market cap one year ago and today stands around 7B. This kind of growth is exciting, but against BTC I see it as unsustainable. Therefore, a mean reversion OM/BTC short trade has the potential to fall 50% over the next twelve months, regardless whether prices enter a bear or bull market.
Stop loss can be placed above the local high. Good luck in your trading.

OM | MANTRA | Bullish Cycle OVER?MANTRA has made leaps and strides towards a new ATH, whilst the rets of the market was trading lower for the past few weeks.
But it seems the buying pressure has run out, if we take a look at the technical indicators.
Interestingly enough, if we take a look at OM through the Weekly timeframe and we pull up the Fibonacci extension, the current cycle ended at exactly 2.618 - a significant marker in the Fib zones.
It is said that, after reaching 2.618, a retracement to 0.786 is probable. This would put us roughly at the major previous resistance zone before the ATH breakout:
The Moving Averages is another great place to watch for possible bounce zones:
After this correction (which could go even lower) the price could potentially bounce back, as it gears up for a new ATH. I'd be looking to buy from the 0.786 and lower, possibly as low as the $2 mark.
________________________
OKX:OMUSDT

$OM Holding Strong Above EMABINANCE:OMUSDT EMA ribbon on the 1D chart is still fanned out bullishly.
As long as price remains above the ribbon, the trend remains intact.
The first test of the ribbon often acts as support in strong trends — watching this area closely.

$OM Gaining Bullish MomentumMomentum on BINANCE:OMUSDT is shifting.
The MACD just crossed bullish on the 12H, while RSI is forming a hidden bullish divergence.
These multi-timeframe signals stacking up add serious conviction to the next upside push.

$10 Is on the wayBINANCE:OMUSDT Fib retracement from the last impulse move is holding beautifully.
That’s the golden pocket where institutional bids often sit.
As long as this zone holds, the probability leans heavily toward continuation higher.
$10 is not so far!
$OM Accumulation Before BreakoutBINANCE:OMUSDT showing some clear signs of accumulation on the 6H.
Volume drying up, price coiling into a tighter range, and OBV holding steady.
This kind of low volatility chop often precedes a significant breakout.
Stay patient — $9 -$12 -$15 TPs

$OM Enters Key Liquidity ZoneBINANCE:OMUSDT just tapped into a key liquidity zone on the 1D chart.
Wicks into this area have been consistently met with heavy buy-side interest.
Whales don’t chase — they wait for price to come to them.
Smart money is positioning.

$OM Maintains Bullish StructureMarket structure on BINANCE:OMUSDT is clean right now.
Higher highs and higher lows across the 4H and daily charts.
As long as the trendline holds, dips are for buying — until that structure breaks, bulls remain in control.

$OM Bollinger Bands TightenBINANCE:OMUSDT Bollinger Bands are squeezing tighter than they’ve been in months.
That kind of compression almost always leads to a high volatility expansion.
The key level to watch is the midline — reclaim it, and upside targets open up fast. $12 soon

$OM Ascending Triangle SetupBINANCE:OMUSDT is forming a classic ascending triangle on the 4H chart.
Strong horizontal resistance, with a series of higher lows pushing price into a tighter range.
Breakouts from this pattern tend to be explosive, especially with volume this low.
A confirmed close above resistance could kick off the next leg up.

#OM/USDT#OM
The price is moving in a descending channel on the 1-hour frame and is adhering to it well and is heading to break it strongly upwards and retest it
We have a bounce from the lower limit of the descending channel, this support is at a price of 6.64
We have a downtrend on the RSI indicator that is about to break and retest, which supports the rise
We have a trend to stabilize above the Moving Average 100
Entry price 7.10
First target 7.48
Second target 7.71
Third target 8.00

Liquidity Grab in Action: Bulls Eyeing $7.50+?Price just wicked into $6.60, swept the lows, and snapped back above $6.90.
That’s a classic liquidity grab — stop loss hunt followed by instant reclaim.
If bulls can reclaim $7.20, momentum shifts back in their favor with $7.50+ in sight.
