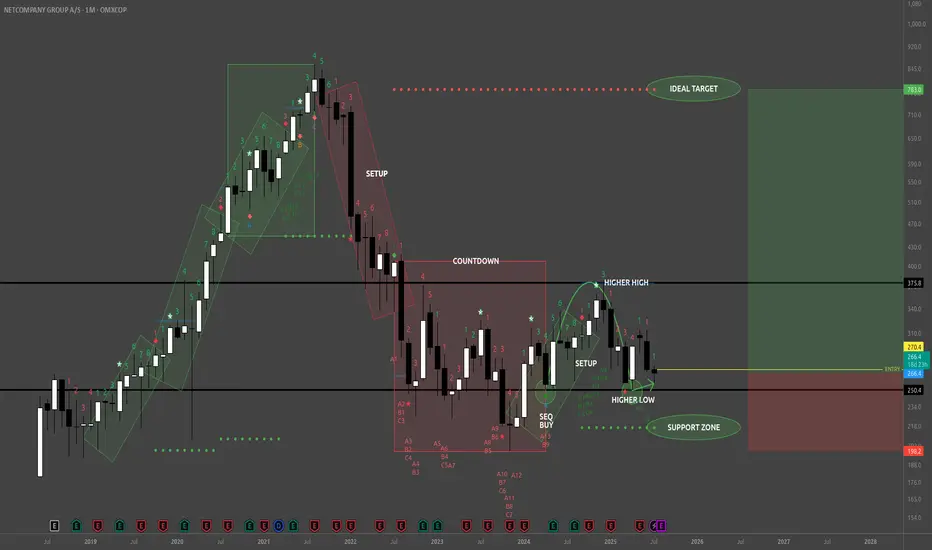
NETC - BuyReading the NETC Monthly chart from the left to right look at that remarkably strong bullish trend (green rotated rectangles) which spanned 3 consecutive TD 1-9 Setups. That's 9 strong months of uptrend culminating in the beginning of the bearish trend with a TD Sequential 13 Sell signal at the apex, a Bearish Engulfing Pattern, and a large Doji immediately preceding the TD 1-9 Setup (red rotated rectangle) which exhausted the downward momentum, and dissipated the downward momentum with the TD Sequential 13 Buy signal (first green circle).
From the TD 13 Buy signal (first green circle) buyers created a higher high, followed by 4 consecutive red TD counts, whose bearish implications were disrupted by the strong Bull Sash pattern. I really like this spot for opening a long position. One caveat is that the Weekly TD Buy Setup is on 7/9 so the next two weeks could bring the price lower, potentially even tapping the TDST support zone, but whether that happens or not look left on the chart everywhere from my entry price and below. This is all wholesale pricing territory!
TDST up at 783 is a nice upside target just shy of the ATH traders will be gunning for.
Now on fundamentals here's where things are really nice. NETC just bought themselves the Danish IT banking company SDC (for 1 Billion DKK) which serves about 100 Nordic banks. That's going to be bringing in sticky, recurring revenues in a critical financial sector. NETC revenues are also not materially tied to the U.S., and doesn't rely on American consumer sentiment, regulatory policy, or supply chains.
Whether price falls from here or not I'm holding on to my shares until this pays off big. Maybe this is a trade for your trading temperament too.
NETC trade ideas
Netcompany breakdown RSI oversold.
Sellers in line to get out.
Breakdown of consolidation zone.
No support left.

Netcompany A/S is falling but where is it gonna go ? As shown on the chart , we are deffently in a bear market on this one no douth about that.
But where is it gonna go next.
As the chart shown, we are on the 420-440 course and if that line dont hold we can see 377 but again the indicatores are very negative all aroundt and maybe even to much so and pull back or small gain to 490-520 is not out of the way befor it can continue down ( or start an new uptrend there )
BUT we have to follow the trend to see where it wanna go so we can TRY to find the bottum and then you say what is the bottum , well thats up to your way of traning when you should go in a trade, we are very defferent on how we all trade , some use support lines orther use MA lines and som priceaction and some wait for the hole trend to be positive befor jumping in , so again its up to each one of us, when we THINK its time ..
All i can is to show you the big picture and hope it helps you get a better entry point for your trading.
Good luck.

NetCompany - LONG IdeaI would like to see the stock to bounce a little bit up before buying to confirm its gonna stop at the line.

